SandRidge Energy: profit rose 36.5%, but it was oil prices, not volumes, that delivered it
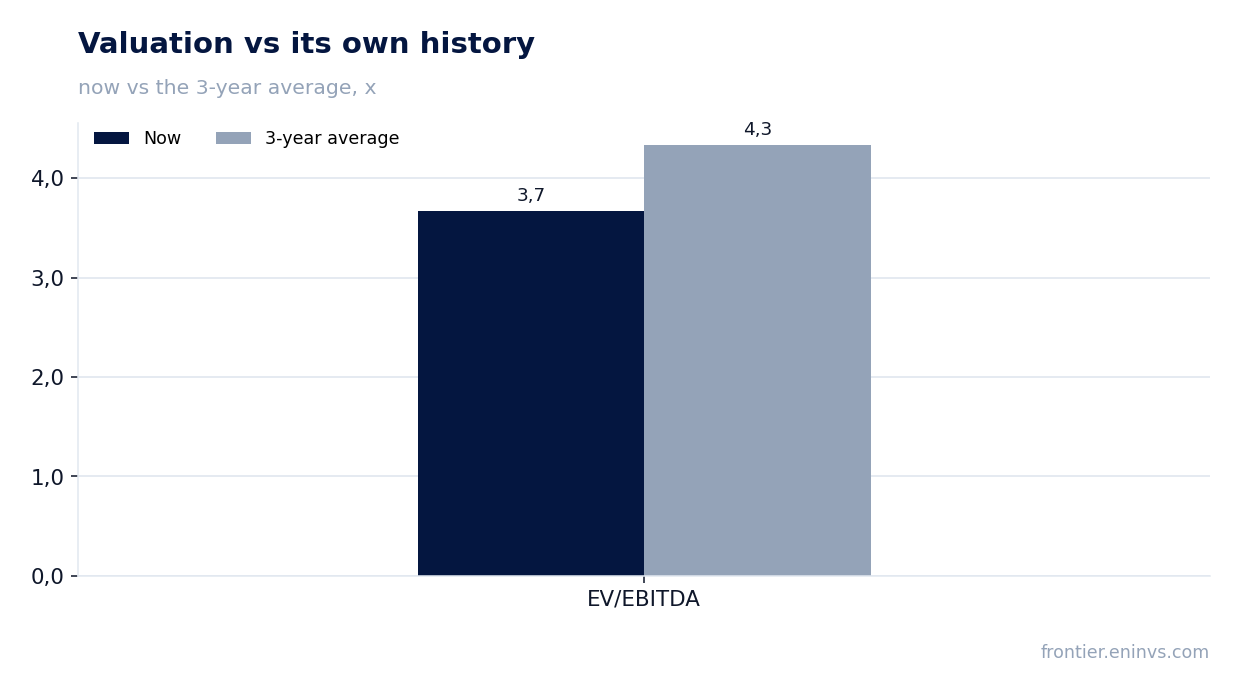
On 5 August SandRidge Energy reported results for the second quarter of 2026. Revenue rose 48.0% year on year to $51.1 million, adjusted EBITDA by 19.7% to $34.0 million, and net income by 36.5% to $26.7 million. Production added 11% on a Boe basis, but the main driver was the realised oil price: $95.35 per barrel against $62.80 a year earlier. At an EV/EBITDA of 3.67 against its own three-year average of 4.34 and with net cash of $113.3 million, the share looks attractive, though the portal's model implies 36% downside to fair value.
Key takeaways
— Revenue rose 48.0% year on year, and almost all of the gain came from the oil price, not from volumes
— EBITDA margin fell to 66.6% from 82.3% because revenue grew faster than EBITDA
— Net income of $26.7 million includes one-off items; adjusted net income is $21.0 million
— The company holds $114.7 million in cash with no debt, and that is the main argument for the share
— Free cash flow of $23.2 million for the quarter fully covers the dividend
— The $0.13 per share dividend is a 5.6% yield, but the payout rests on the oil price
— EV/EBITDA of 3.67 is below its own three-year average of 4.34, yet the portal's model sees 36% downside
Attractiveness
Key figures, USD bn
| Metric | Q2 2025 | Q2 2026 | Change |
|---|---|---|---|
| Revenue | 0.03 | 0.05 | +48.0% |
| EBITDA | 0.03 | 0.03 | +19.7% |
| Operating profit | 0.02 | 0.03 | +40.1% |
| Net profit | 0.02 | 0.03 | +36.5% |
| Operating cash flow | 0.02 | 0.04 | +85.7% |
| Capex | 0.02 | 0.02 | +23.1% |
| EBITDA margin | 82.3% | 66.6% | -15.7 pp |
| Net margin | 56.6% | 52.2% | -4.4 pp |
Revenue rose 48.0% year on year, and almost all of the gain came from the oil price, not from volumes
Second-quarter 2026 revenue came to $51.1 million, up 48.0% from a year earlier. Production over the same period rose only 11% on a Boe basis, to 19.7 thousand barrels of oil equivalent per day. The gap between those two figures is explained by price: the realised oil price climbed to $95.35 per barrel from $62.80 in the second quarter of 2025.
Oil accounted for 61% of revenue against 49% a year earlier. The natural gas share, by contrast, fell to 14% from 25%, and its realised price dropped to $1.36 per thousand cubic feet from $1.82. The company thus won on oil and lost on gas, and the overall revenue increase is the net result of that balance.
Oil production rose 22% year on year to 328 thousand barrels, a credit to the Cherokee drilling programme. But in barrels of oil equivalent total production added only 11%, because gas and NGLs grew more slowly. To keep revenue rising, the company needs either an even higher oil price or an acceleration in production, not merely the current pace.
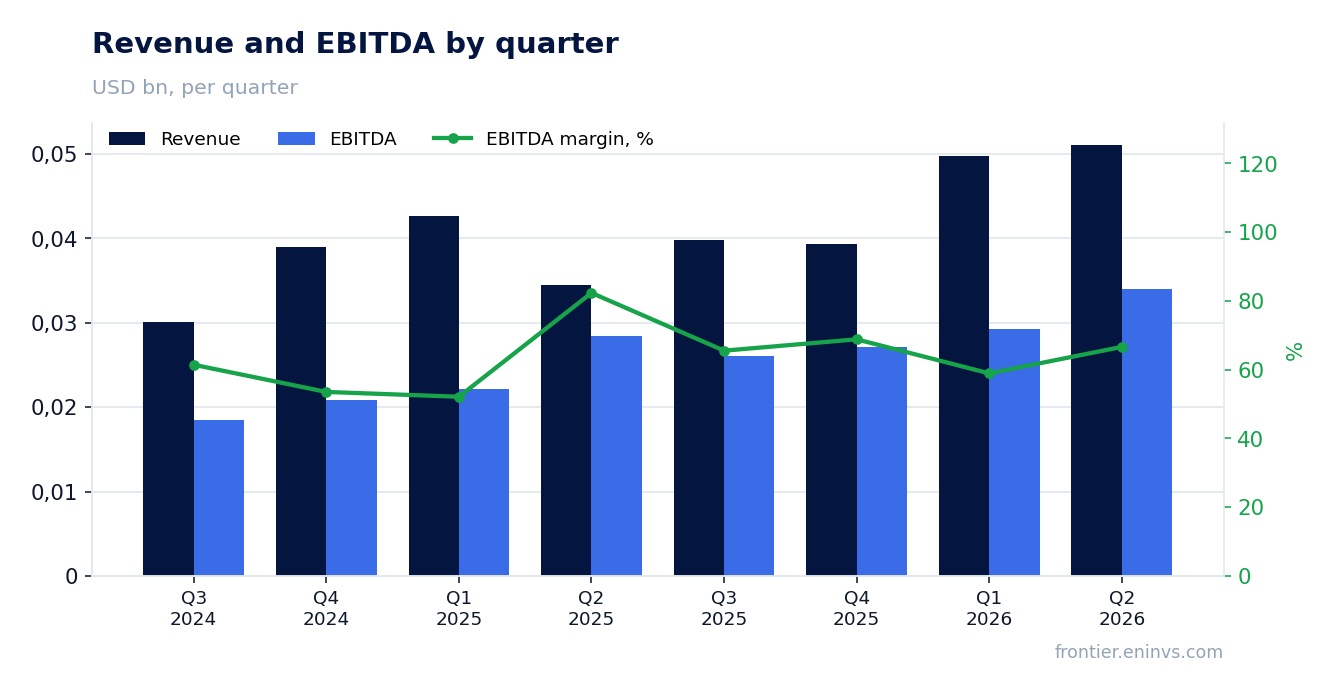
EBITDA margin fell to 66.6% from 82.3% because revenue grew faster than EBITDA
Adjusted EBITDA in the second quarter of 2026 was $34.0 million, up 19.7% from a year earlier. Revenue over the same period rose 48.0%, so the margin inevitably declined, to 66.6% from 82.3%. The reason is that costs grew faster than revenue: lease operating expenses rose to $10.3 million from $6.6 million, and production taxes to $3.2 million from $2.2 million.
Part of that increase is explained by a one-off item: a year earlier the company recorded a $2.1 million non-cash adjustment to an operating accrual, which depressed the comparison base. Without it, the cost increase would have been less sharp. Nevertheless, lease operating expense per Boe rose to $5.73 from $4.05, and that is genuine pressure on unit economics.
General and administrative costs, by contrast, remained under control: adjusted G&A came to $2.7 million, or $1.52 per Boe, against $1.48 a year earlier. The company keeps a low administrative burden, and that partly offsets the rise in production costs. But the overall picture is one of margin compression, and restoring it requires either a higher realised price or lower unit costs.
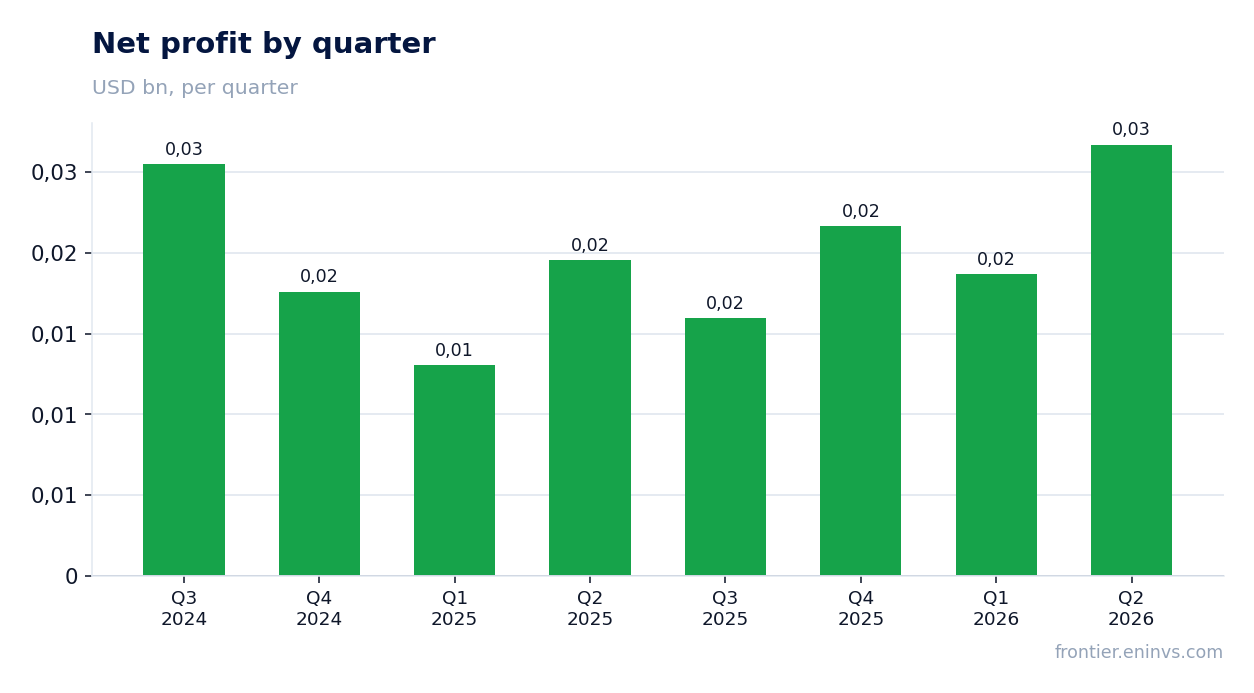
Net income of $26.7 million includes one-off items; adjusted net income is $21.0 million
Net income for the second quarter of 2026 was $26.7 million, or $0.72 per share, against $19.6 million a year earlier. Adjusted net income, which the company reports separately, was $21.0 million, or $0.57 per share. The $5.7 million difference is explained by non-cash and one-off items: gains on derivative contracts, settlements on hedges and other adjustments.
The main contributor to the gap is the '(Gain) loss on derivative contracts' line of $4.2 million, which is excluded from the adjusted figure. Also excluded are settlement gains on hedges of $0.8 million and interest income of $0.9 million. Almost a quarter of reported net income is therefore the result of derivative revaluation rather than operations.
For assessing the durability of the business, adjusted net income matters more: $21.0 million for the quarter. It is still above last year's $12.2 million, but the growth is more modest – 71.5% against 36.5% for net income. Investors should focus on this measure because it is cleansed of hedge volatility.
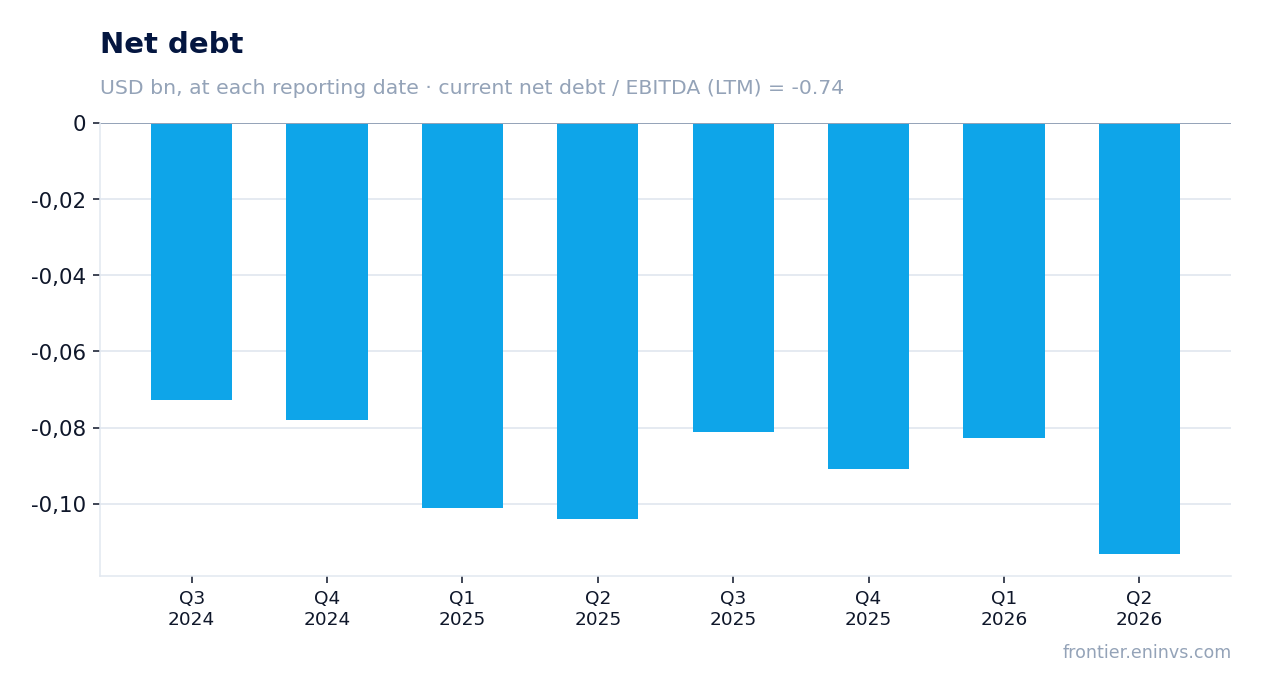
The company holds $114.7 million in cash with no debt, and that is the main argument for the share
As of 30 June 2026 SandRidge Energy held $114.7 million in cash and cash equivalents, including restricted cash. It has no debt obligations – neither term nor revolving. Net debt is negative: minus $91.0 million on the latest balance sheet. The ratio of net debt to EBITDA for the trailing twelve months is minus 0.74 – the company is not levered but carries a net cash cushion.
That cushion allows it to fund its drilling programme and acquisitions without borrowing. In the first half of 2026 capital expenditure was $36.3 million, fully covered by operating cash flow. The company is also closing its acquisition of Cherokee assets in the third quarter of 2026, adding about 7,000 net leasehold acres and interests in 21 wells.
The absence of debt is insurance against an oil price fall. With the current capital structure the company can weather a period of low prices without the risk of covenant breaches or forced asset sales. However, much of the cash is already reflected in the valuation: the market capitalisation is $541.3 million, and the cash position is more than a fifth of that.
Free cash flow of $23.2 million for the quarter fully covers the dividend
Operating cash flow in the second quarter of 2026 was $42.4 million, well above last year's $22.9 million. Free cash flow – after capital expenditure and acquisitions – was $23.2 million against $9.8 million a year earlier. This is the key metric for the dividend story: it shows how much money remains after investment to sustain and grow production.
Capital expenditure for the quarter was $19.2 million, mostly drilling and completion. In the first half capital expenditure reached $36.3 million, and the company completed four wells under its Cherokee programme, with two more in July. Free cash flow for the half-year was $22.1 million, roughly equivalent to the annual dividend.
Dividend payments in the second quarter totalled $10.6 million, including a special dividend of $0.20 per share. That is less than free cash flow, so the payout is covered by organic cash generation. However, free cash flow is volatile and depends on the oil price: if prices fall, it could contract faster than the dividend.
The $0.13 per share dividend is a 5.6% yield, but the payout rests on the oil price
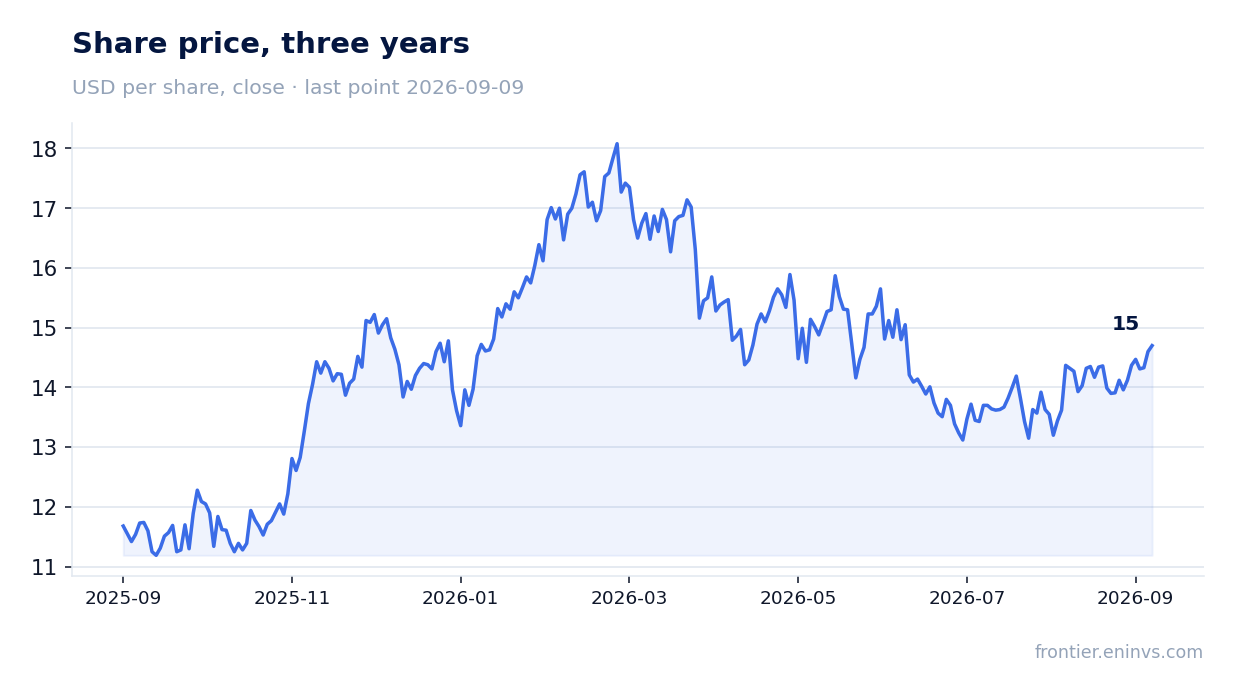
On 4 August 2026 the board declared a quarterly dividend of $0.13 per share, payable on 31 August. That equates to a yield of 5.6% on the current price. The company also paid a special dividend of $0.20 per share in the second quarter, bringing total payments for the quarter to $0.33 per share. For the first half of 2026 total dividends were $10.6 million.
Our estimate for the annual dividend assumes the quarterly payout stays at $0.13, giving $0.52 per share and a yield of about 3.8% excluding specials. However, the company has repeatedly used special dividends: $1.50 per share in 2025 and $2.00 per share in 2024. If oil prices remain high, further specials are likely, but they are not guaranteed.
The key risk to the dividend is a fall in the oil price. At $95 per barrel free cash flow covers payments with room to spare, but at $60 the cushion disappears. The company has no debt, which provides flexibility, but the dividend policy is not formalised, and the board could cut payments if conditions deteriorate. The 5.6% yield is attractive relative to the key rate, but it is not protected from the price cycle.
EV/EBITDA of 3.67 is below its own three-year average of 4.34, yet the portal's model sees 36% downside
On the trailing twelve-month EV/EBITDA the share trades at 3.67, while its own three-year average is 4.34. The market is thus valuing the company below its average of the past three years. On trailing P/E the multiple is 6.53. With a market capitalisation of $541.3 million and negative net debt, EV is below market cap, which produces such a low multiple.
However, the portal's model, which re-prices EBITDA at current commodity prices against a target EV/EBITDA, implies 36% downside to fair value. That suggests that at current oil and gas prices the market may be discounting higher prices than our model assumes. The gap between the historical multiple and the model valuation is the key question for an investor.
On one hand, the low EV/EBITDA and net cash position make the share cheap by historical standards. On the other, the portal's model points to overvaluation if one assumes sustainable prices. The 5.6% dividend yield adds appeal, but it depends on oil prices. The balance of these arguments determines our verdict.
Valuation on the latest reported figures
| Metric | Value |
|---|---|
| Market cap | 0.54 bn USD |
| P/E (LTM) | 6.5 |
| EV/EBITDA (LTM) | 3.7 |
| P/B | 1.06 |
| Net debt / EBITDA (LTM) | -0.74 |
| Operating cash flow (LTM) | 0.10 bn |
| ROE | 20.0% |
| Dividend yield (12m) | 5.6% |
| EV/EBITDA, 3-year average | 4.3 |
Bottom line
The strength of the report remains the balance sheet: $114.7 million in cash, no debt, and free cash flow of $23.2 million for the quarter covering the dividend. However, the 36.5% profit increase is largely due to the oil price and one-off items – adjusted net income is $21.0 million. The margin compressed to 66.6% from 82.3%, reflecting faster cost growth. At an EV/EBITDA of 3.67 against a three-year average of 4.34 the share looks cheap, but the portal's model sees 36% downside to fair value. The question for a holder now is whether the oil price holds above $90, since both earnings and the dividend depend on it.
Open the company's financial profile SD →
See also: market overview · valuation map · stock screeners