Sunoco LP: revenue up 2.6x on the Parkland acquisition, but preferred and Class D units diluted per-unit profit
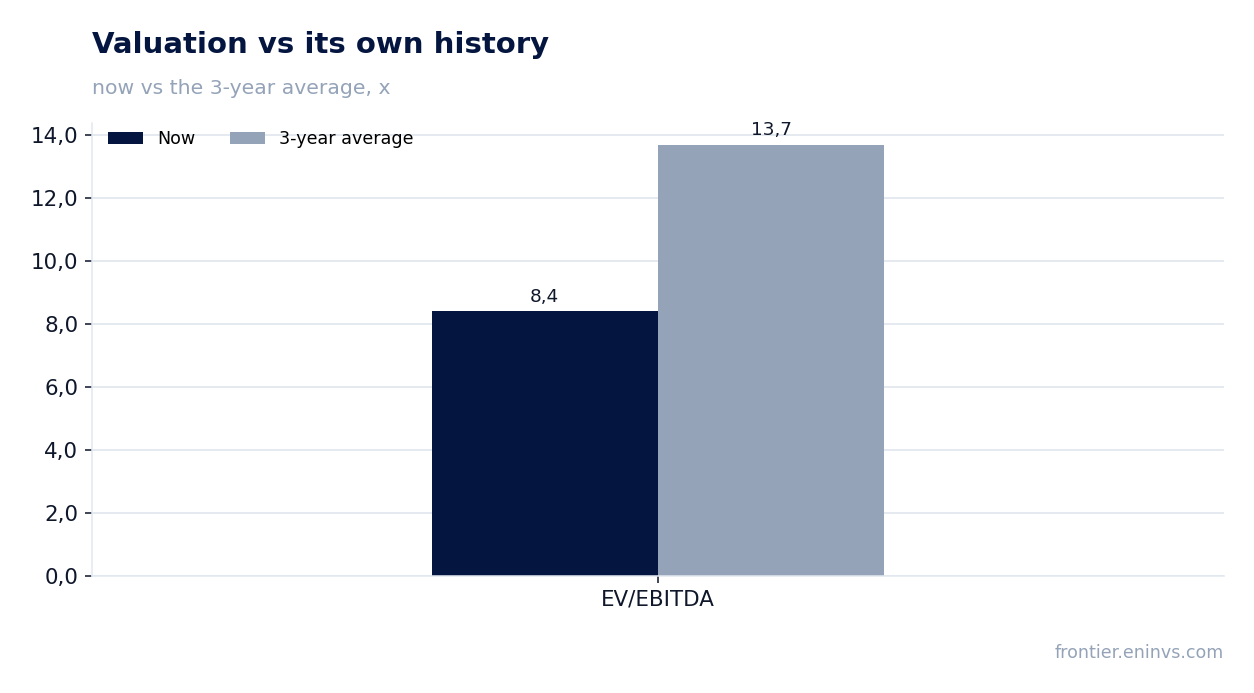
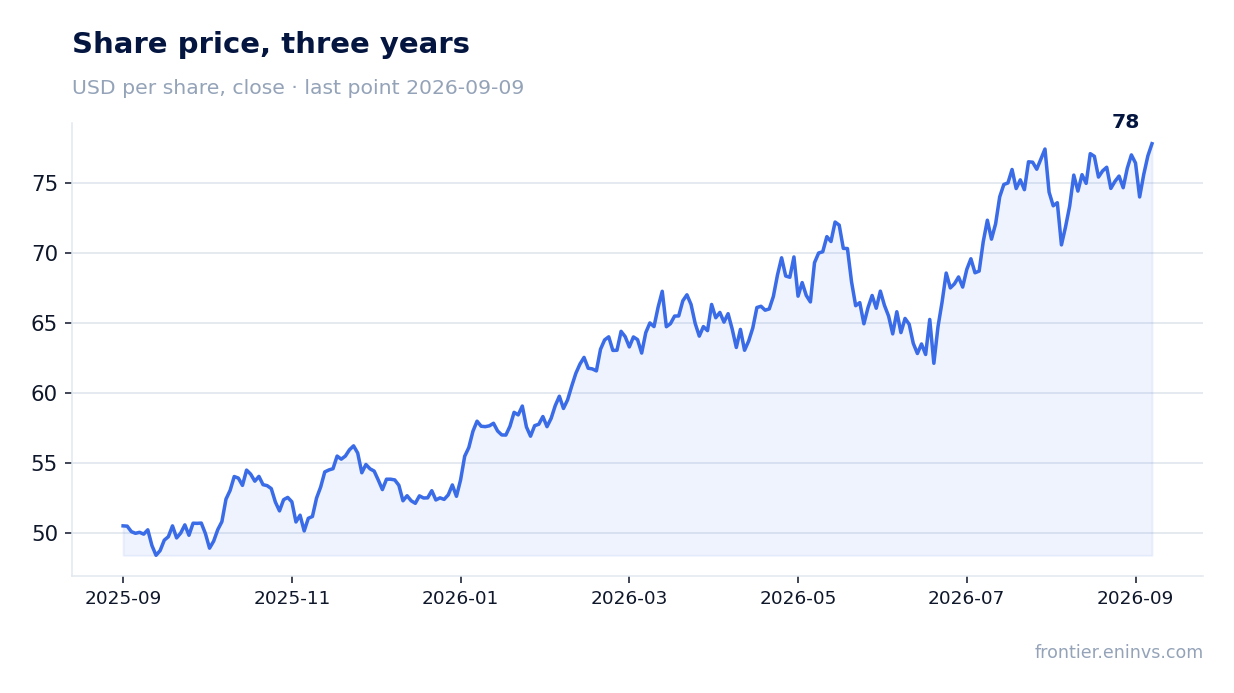
On 4 August Sunoco LP reported second-quarter 2026 results. Revenue rose 164.5% year on year to $14,259 million, adjusted EBITDA by 175.1% to $982 million, and net income by 229.1% to $283 million. The growth came entirely from the Parkland acquisition and other assets, not from organic expansion. At $77.41 the stock trades at 8.4x EV/EBITDA against its own three-year average of 13.7x, leaving room for re-rating, but leverage of 4.76x EBITDA and per-unit dilution limit the appeal – verdict 'rather attractive'.
Key takeaways
— Revenue rose 2.6x on the Parkland acquisition, not organically
— Adjusted EBITDA doubled, but $14 million of it was one-off transaction costs
— Earnings per unit barely grew because of preferred and Class D distributions
— Leverage of 4.76x EBITDA is the price of acquisitions, not of operating growth
— The distribution has risen for seven straight quarters, but FCF coverage is limited
— The 8.4x EV/EBITDA multiple is half its own three-year average
Attractiveness
Key figures, USD bn
| Metric | Q2 2025 | Q2 2026 | Change |
|---|---|---|---|
| Revenue | 5.39 | 14.3 | +164.5% |
| EBITDA | 0.36 | 0.98 | +175.1% |
| Operating profit | 0.20 | 0.58 | +187.2% |
| Net profit | 0.09 | 0.28 | +229.1% |
| Operating cash flow | 0.24 | 1.10 | +353.1% |
| Capex | 0.16 | 0.17 | +8.1% |
| EBITDA margin | 6.6% | 6.9% | +0.3 pp |
| Net margin | 1.6% | 2.0% | +0.4 pp |
Revenue rose 2.6x on the Parkland acquisition, not organically
Revenue in the second quarter of 2026 was $14,259 million, up 164.5% year on year. This growth comes from the Parkland acquisition and other assets: in the Fuel Distribution segment, fuel volumes sold rose from 2,188 million to 4,125 million gallons, nearly doubling. Without the deal, revenue growth would have been far more modest.
The Fuel Distribution segment generated $504 million of adjusted EBITDA versus $206 million a year earlier, Pipeline Systems – $190 million versus $177 million, Terminals – $113 million versus $71 million. The new Refinery segment, which appeared after the acquisition, added $175 million. Thus, the main increase came from Fuel Distribution and Refinery, i.e. the acquired assets.
Organic growth in Pipeline Systems and Terminals looks much more modest: $13 million and $42 million respectively. This means that without the deal, the company would have grown by single digits, not multiples. For an investor, it is important that future revenue dynamics will depend on the ability to integrate Parkland and realise synergies, not on market conditions.
Adjusted EBITDA doubled, but $14 million of it was one-off transaction costs
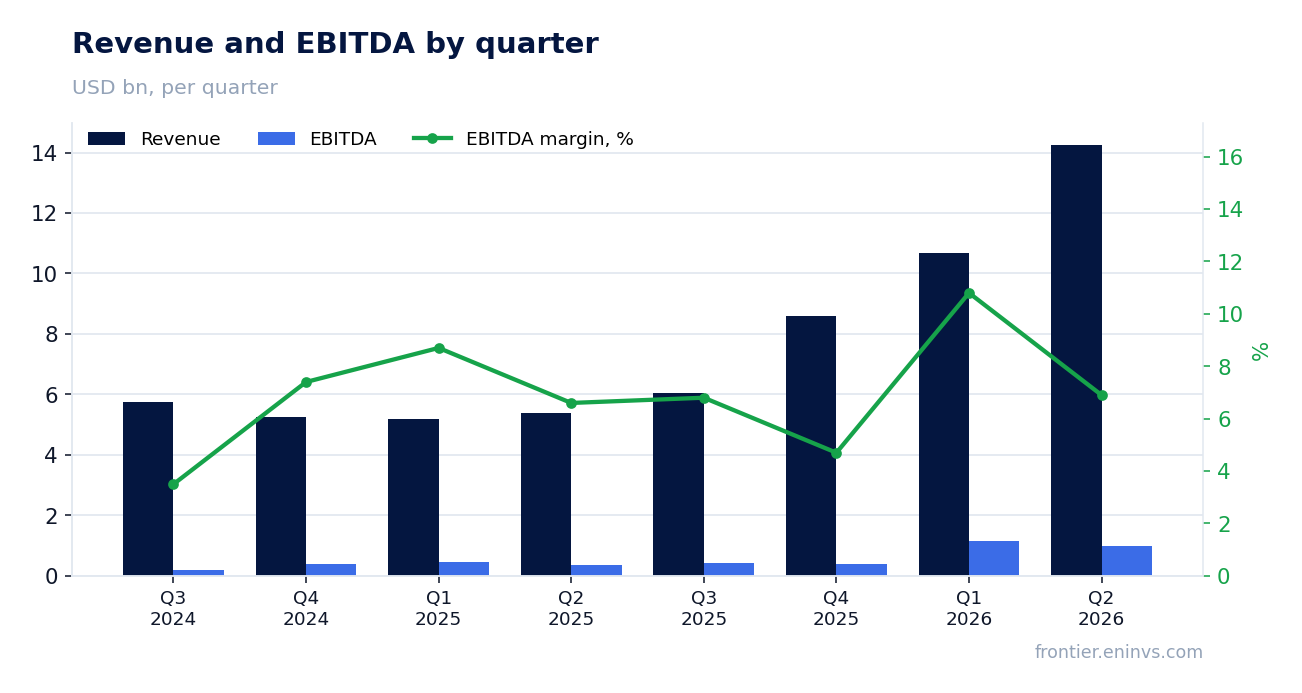
Adjusted EBITDA in the second quarter of 2026 was $982 million, up 175.1% year on year. However, it includes $14 million of one-off transaction-related expenses. Excluding them, the figure would have been $996 million. A year earlier such expenses were $10 million, so their impact on growth is small but present.
The EBITDA margin rose to 6.9% from 6.6% a year earlier. The 0.3 percentage point improvement looks modest against a 2.6x revenue increase. The reason is that the acquired assets have lower margins than the existing business. For example, in Fuel Distribution, margin per gallon rose from 10.5 to 17.1 cents, but segment expenses increased by $327 million, eating much of the gain.
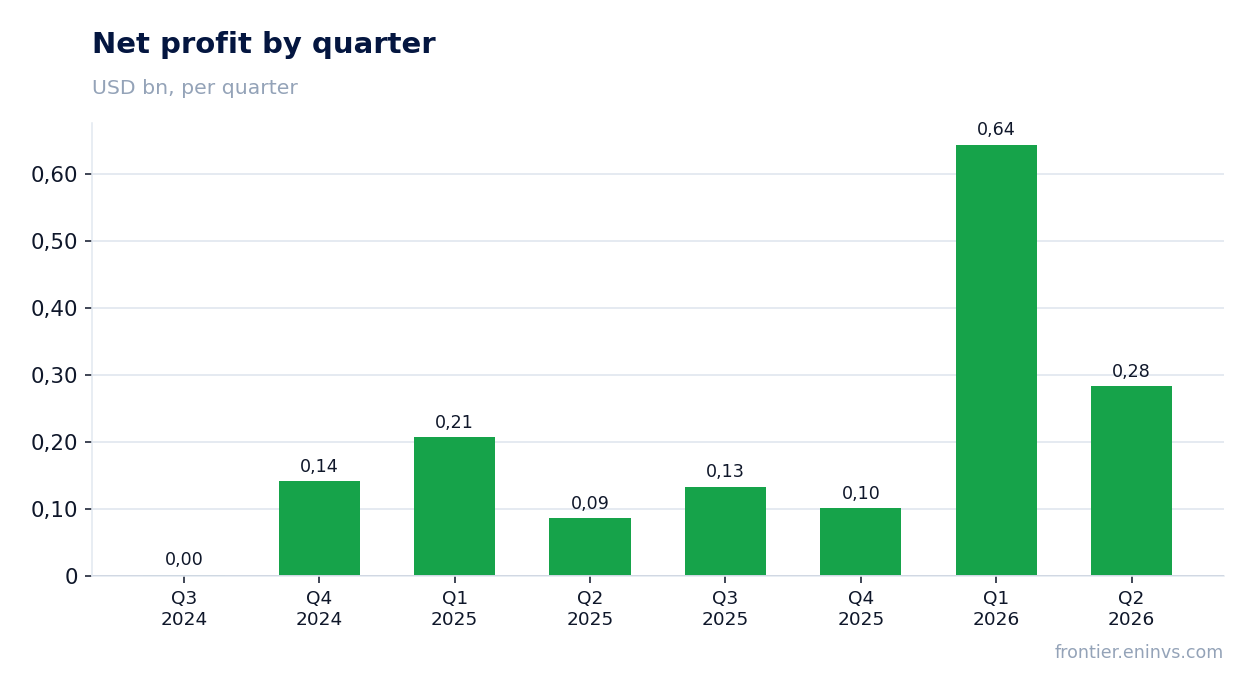
Net income rose 229.1% to $283 million, and the net margin – to 2.0% from 1.6%. Here the scale effect and one-off items are more visible. However, it is worth remembering that profit includes one-off transaction expenses, as well as gains from inventory revaluation and other non-cash items that will not repeat next quarter.
Earnings per unit barely grew because of preferred and Class D distributions
Net income in the second quarter of 2026 was $283 million, but after deducting distributions to preferred unitholders ($29 million) and the Class D holder ($49 million), only $205 million remained for common units. A year earlier, the entire $86 million went to common unitholders, as preferred and Class D appeared later. As a result, earnings per common unit rose only to $0.94 from $0.33, i.e. 2.8x, not 3.3x like net income.
The dilution stems from the issuance of $1.5 billion of preferred units and 51.5 million Class D units to finance acquisitions. These instruments have priority in profit distribution, reducing the share of common unitholders. In the first half of 2026, the situation is similar: out of $927 million of net income, $670 million went to common units.
For an investor, this means that business growth does not fully translate into earnings per unit growth. As long as preferred and Class D remain in the capital structure, the gap will persist. If the company repurchases or converts these instruments, the dilution effect will decrease, but no such announcement has been made yet.
Leverage of 4.76x EBITDA is the price of acquisitions, not of operating growth
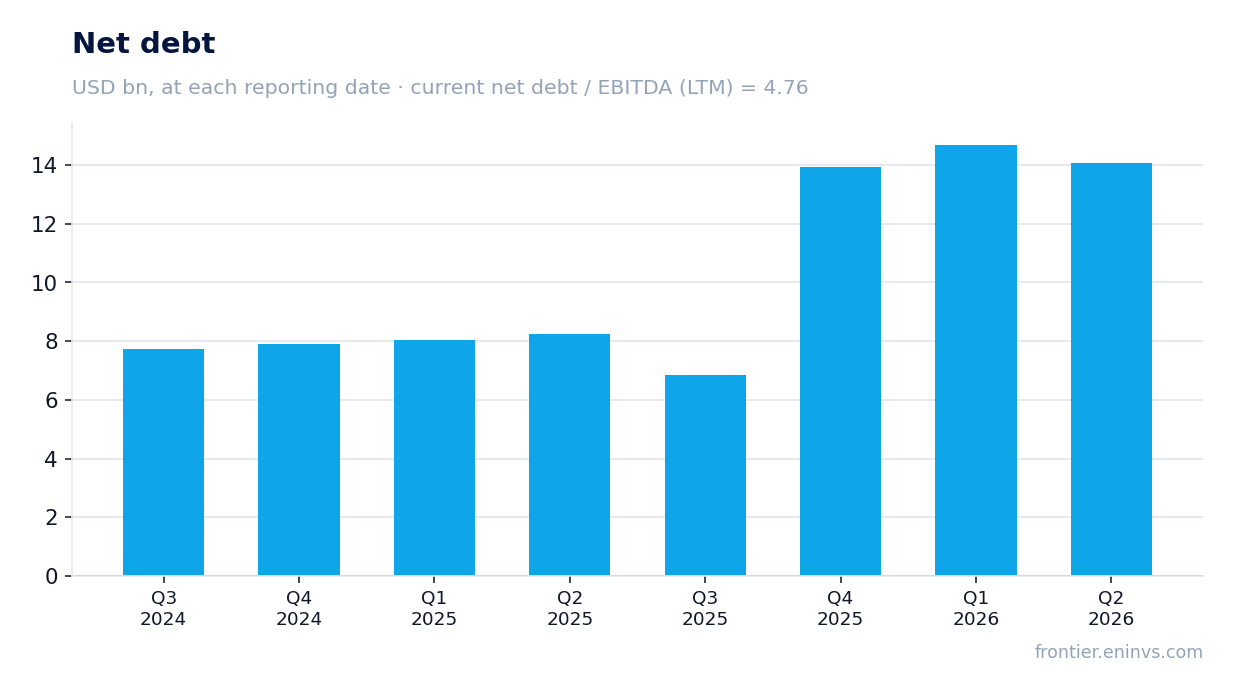
Net debt at the end of the second quarter of 2026 was $13,947 million, corresponding to 4.76x EBITDA for the last twelve months. This is a high level for a company with a market capitalisation of $10.7 billion. Debt rose due to acquisition financing: over 12 months it increased by $5.8 billion. At the same time, the net debt / EBITDA ratio under the credit agreement is stated as 3.7 – the difference is explained by the use of adjusted EBITDA, which includes synergies and excludes certain items.
Interest expense in the second quarter of 2026 was $204 million versus $123 million a year earlier. The 66% increase is due to the larger debt portfolio. At current quarterly EBITDA of $982 million, interest payments consume about 21% of EBITDA, which is still acceptable, but could become a problem if profits decline.
Operating cash flow over the last twelve months was $1,200 million, which covers interest expense but leaves little free cash after capital expenditures. The company plans to grow distributions, which requires stable cash flow. If EBITDA declines, leverage could become a constraint on further distribution increases.
The distribution has risen for seven straight quarters, but FCF coverage is limited
Sunoco LP declared a quarterly distribution for the second quarter of 2026 of $1.0023 per unit, 10% higher than a year earlier. This is the seventh consecutive increase. The annualised rate is $4.0092, giving a dividend yield of 4.94% at the price of $77.41. The company follows a policy of at least 5% annual distribution growth.
Distribution coverage from Distributable Cash Flow, as adjusted, in the second quarter of 2026 was $608 million, while $263 million was allocated to distributions. Thus, coverage is more than double. However, this is a quarterly figure and includes one-off items. Over the last twelve months, operating cash flow was $1,200 million and capital expenditures about $600 million, leaving about $600 million for distributions against annual payments of about $1 billion. This means coverage may be insufficient without additional debt or EBITDA growth.
Our estimate for the 2026 distribution is about $4.0 per unit, in line with the current annual rate. It is based on the stated policy of at least 5% growth and expected EBITDA of $3.5–3.7 billion. If EBITDA comes in lower, the company may slow distribution growth. The risk of a cut is linked to high leverage and the need to fund capital expenditures.
The 8.4x EV/EBITDA multiple is half its own three-year average
Based on second-quarter 2026 results, Sunoco LP's EV/EBITDA is 8.4x, while the three-year average is 13.7x. Thus, the stock trades significantly below its historical valuation. This may be explained both by a general decline in sector multiples and by company-specific risks: high leverage, dilution, and integration of a large acquisition.
The trailing twelve-month P/E is 9.2x, which also looks low. However, trailing twelve-month profit includes one-off income and expenses related to acquisitions, so the multiple may be understated. Return on equity (ROE) is 13.6%, which is decent for a capital-intensive business.
According to the portal's model, which re-prices EBITDA at current commodity prices at the target EV/EBITDA, the upside to fair value is estimated at +19%. This is our own estimate, not a market consensus. It assumes that the multiple will return to higher levels as leverage declines and Parkland is integrated.
Valuation on the latest reported figures
| Metric | Value |
|---|---|
| Market cap | 10.7 bn USD |
| P/E (LTM) | 9.2 |
| EV/EBITDA (LTM) | 8.4 |
| P/B | 1.33 |
| Net debt / EBITDA (LTM) | 4.76 |
| Operating cash flow (LTM) | 1.20 bn |
| ROE | 13.6% |
| Dividend yield (12m) | 4.9% |
| EV/EBITDA, 3-year average | 13.7 |
Bottom line
Sunoco LP delivered strong revenue and EBITDA growth in the second quarter of 2026, but it was driven by acquisitions rather than organic development. Earnings per common unit rose only 2.8x due to preferred and Class D distributions. Leverage of 4.76x EBITDA remains high, and distribution coverage from cash flow is limited. The 8.4x EV/EBITDA multiple is half its own three-year average, offering re-rating potential, but realising it requires deleveraging and successful Parkland integration. Verdict – 'rather attractive'.
Open the company's financial profile SUN →
See also: market overview · valuation map · stock screeners