Talos Energy: $149.7m profit on $664.8m revenue – but the stock trades below its own history
On August 4, Talos Energy reported second-quarter 2026 results. Revenue rose 56.5% year on year to $664.8m, adjusted EBITDA reached $402.2m, and net income was $149.7m versus a $185.9m loss a year earlier. Yet the stock trades at EV/EBITDA LTM of 5.56 – below its own three-year history – while the portal's model puts fair value 61% below the current price. The share looks attractive on the multiple and operating results, but the portal's model points to a significant premium of price over calculated value.
Key takeaways
— Revenue rose 56.5% year on year to $664.8m, almost entirely from oil – $620.8m at an average price of $99.47 per barrel
— EBITDA margin of 60.5% versus minus 0.9% a year earlier – the gap came not from prices but from the absence of a $223.9m impairment that wiped out quarterly EBITDA a year ago
— Net income of $149.7m includes one-off items: excluding them, adjusted profit would be $97.8m, or $0.57 per share
— Free cash flow of $231.6m on capital expenditure of $112.5m – the quarter was a record for cash generation
— Leverage at 0.5x on the company's own methodology and 1.36x on the LTM EBITDA calculation – the difference is that the company deducts $577.6m of cash
— The company has bought back 7% of shares since mid-2025, but no repurchases occurred in Q2 due to a blackout period related to the Gulf of America acquisition
— The portal's model values fair value 61% below the current price – the market is pricing in higher oil prices or success from new projects
Attractiveness
Key figures, USD bn
| Metric | Q2 2025 | Q2 2026 | Change |
|---|---|---|---|
| Revenue | 0.42 | 0.66 | +56.5% |
| EBITDA | -0.00 | 0.40 | to profit |
| Operating profit | -0.27 | 0.20 | to profit |
| Net profit | -0.19 | 0.15 | to profit |
| Operating cash flow | 0.35 | 0.30 | -14.5% |
| Capex | 0.15 | 0.10 | -31.0% |
| EBITDA margin | -0.9% | 60.5% | +61.4 pp |
| Net margin | -43.8% | 22.5% | +66.3 pp |
Revenue rose 56.5% year on year to $664.8m, almost entirely from oil – $620.8m at an average price of $99.47 per barrel
Revenue in the second quarter of 2026 was $664.8m, up 56.5% from a year earlier. This growth is explained by two factors: the oil price and production volume. The average realised oil price reached $99.47 per barrel, whereas a year earlier it was significantly lower. Production was 93.7 thousand barrels of oil equivalent per day, exceeding the upper end of the company's guidance.
Oil generated $620.8m of revenue, or 93% of the total. Natural gas brought in only $31.0m, and NGL $13.0m. This structure makes the financial result extremely sensitive to the oil price: if quotations fall, revenue declines faster than for companies with a more balanced portfolio.
The company raised its 2026 production guidance to 64–68 thousand barrels of oil per day and 87–91 thousand barrels of oil equivalent per day. This guidance excludes the effect of the Gulf of America acquisition and reflects the closed sale of shelf gas assets. Revenue growth in the next quarter will depend on whether oil prices hold above $90.
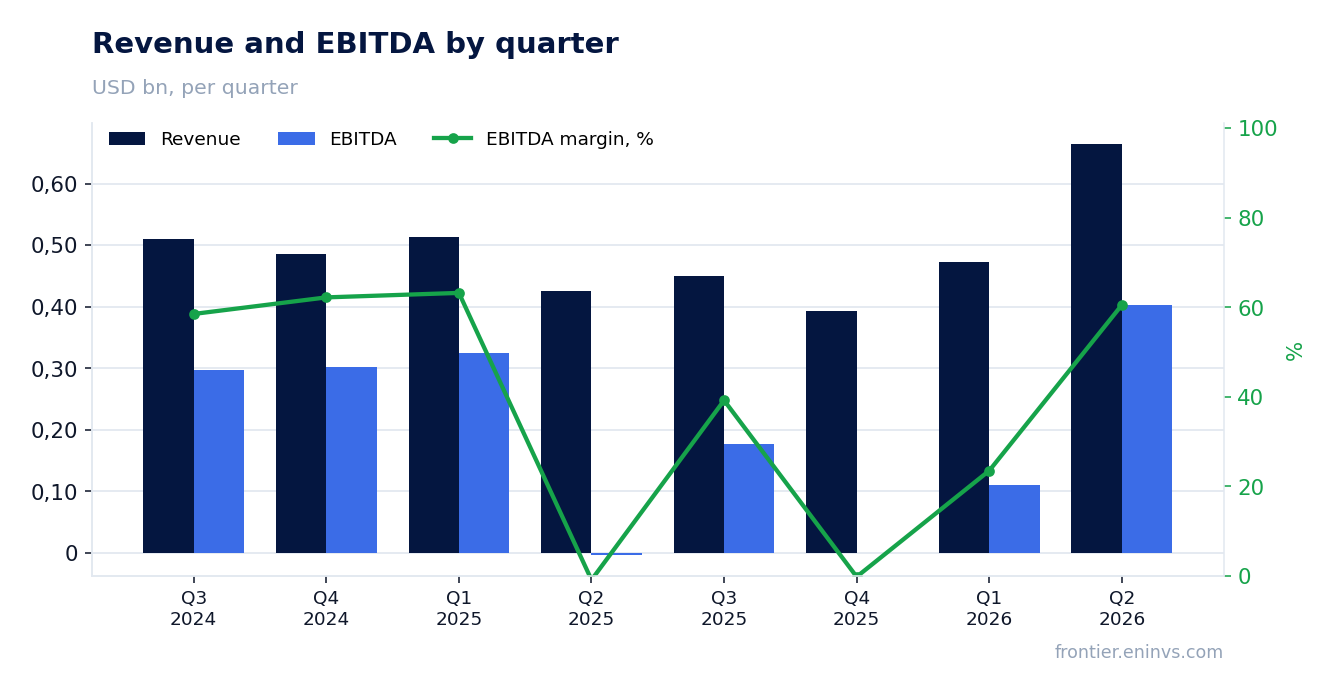
EBITDA margin of 60.5% versus minus 0.9% a year earlier – the gap came not from prices but from the absence of a $223.9m impairment that wiped out quarterly EBITDA a year ago
Adjusted EBITDA in the second quarter of 2026 was $402.2m, with a margin of 60.5%. A year earlier, EBITDA was negative – minus $3.9m at a margin of minus 0.9%. This reversal is explained not only by revenue growth but also by the absence of an impairment of oil and gas properties, which a year ago amounted to $223.9m and completely offset operating profit.
Operating profit in the reporting quarter was $198.2m versus a loss of $273.6m a year earlier. Excluding the impairment effect from the prior-year base, the improvement looks less dramatic but still substantial. The main contribution came from higher oil prices and increased production.
Adjusted EBITDA excluding hedges was $476.3m, which is $74.1m higher than the actual figure. This means that hedging contracts cost the company $74.1m of foregone revenue in the reporting quarter. In the next quarter, some contracts expire, which could improve actual EBITDA if prices hold.
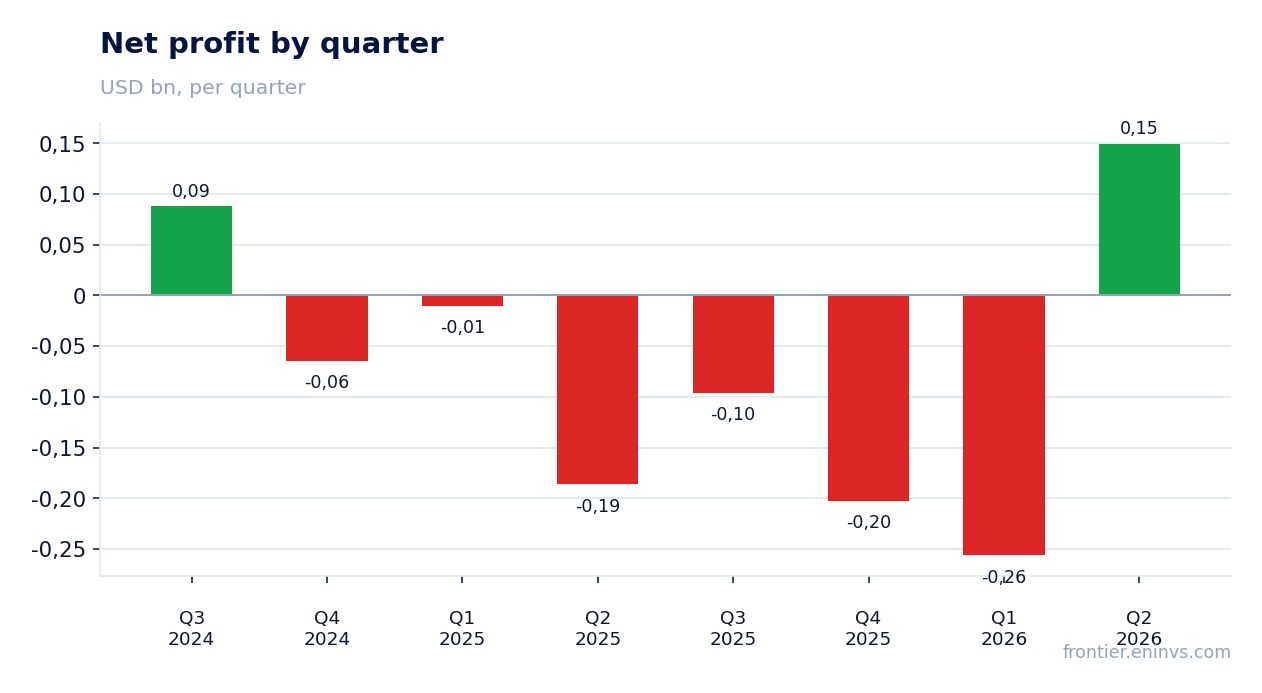
Net income of $149.7m includes one-off items: excluding them, adjusted profit would be $97.8m, or $0.57 per share
Net income in the second quarter of 2026 was $149.7m, or $0.88 per diluted share. A year earlier, the company posted a loss of $185.9m. However, the reported profit includes one-off items: adjusted net income, according to the company, was $97.8m, or $0.57 per share. The $51.9m difference is mainly explained by gains on hedging instruments, which are not recurring.
In the reporting quarter, the company recorded income from price risk management activities of $30.5m. A year earlier, this income was $86.9m. The profit also includes the effect of the sale of an equity method investment – the company received $49.7m in cash from the sale, which may have created a difference between accounting and adjusted profit.
For assessing the sustainability of the business, adjusted profit is more important. At $97.8m on revenue of $664.8m, it gives a margin of 14.7%, which is significantly below the EBITDA margin but still a positive result after several loss-making quarters. The question is how repeatable this $97.8m will be amid oil price volatility.
Free cash flow of $231.6m on capital expenditure of $112.5m – the quarter was a record for cash generation
Operating cash flow in the second quarter of 2026 was $300.6m, and capital expenditure was $112.5m. Free cash flow, according to the company's calculation, reached $231.6m, a record. For comparison: in the first quarter of 2026, operating cash flow was $174.0m and capital expenditure was $152.4m, giving a significantly lower free cash flow.
Capital expenditure of $112.5m includes $85.3m for U.S. drilling and completions, $13.2m for asset management, and $14.1m for seismic, land, and other items. The company confirmed its annual capital expenditure guidance of $500–550m, implying an acceleration of investment in the second half.
Free cash flow is important for assessing the company's ability to fund share repurchases and service debt. At current oil prices, the company generates enough cash to cover capital expenditure and pay interest. However, if prices fall below $80 per barrel, free cash flow could shrink to zero, given the high dependence on oil.
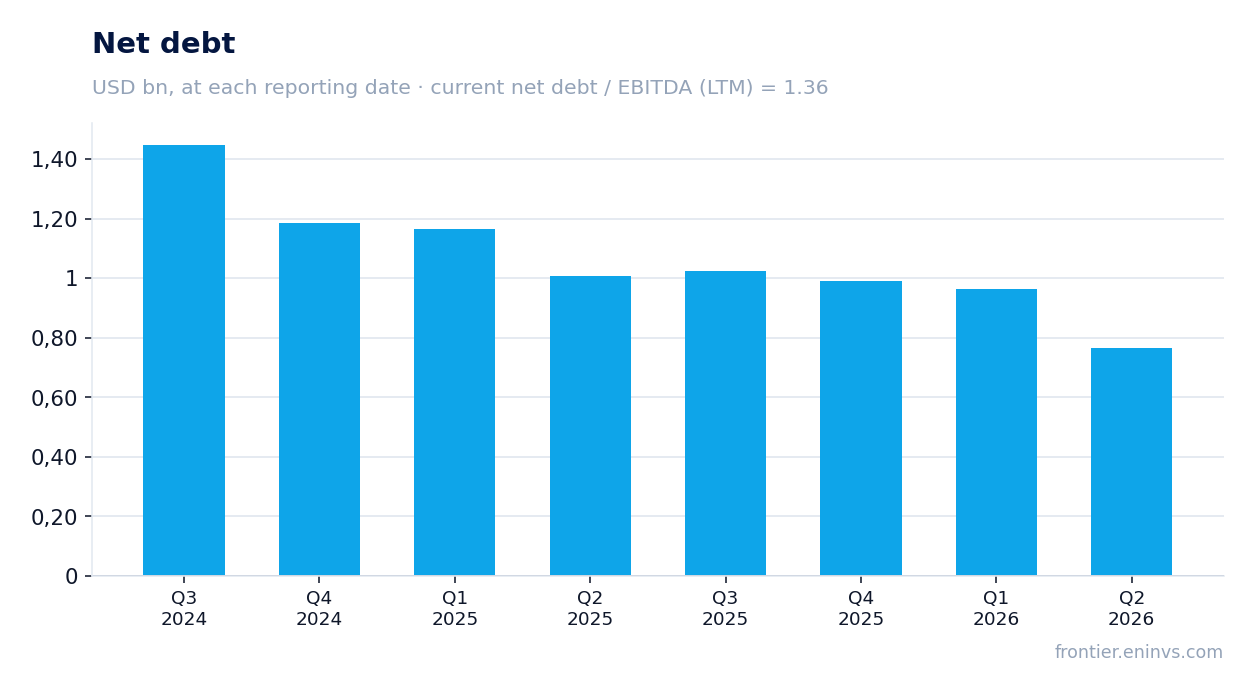
Leverage at 0.5x on the company's own methodology and 1.36x on the LTM EBITDA calculation – the difference is that the company deducts $577.6m of cash
As of June 30, 2026, Talos Energy's total debt was $1,250.0m and cash was $577.6m. The company reports net debt of $672.4m and a net debt to LTM adjusted EBITDA ratio of 0.5x. However, using LTM adjusted EBITDA of $729.2m and net debt of $990.6m, the ratio would be 1.36x. The difference arises because the company deducts all cash from debt, including funds that may be used for acquisitions.
In June 2026, the company issued $800m of 8.000% notes due 2034. These proceeds were used to fully redeem $625m of 9.000% notes due 2029 and to fund a portion of the Gulf of America acquisition. As a result, absolute debt increased, but the cost of servicing debt decreased.
The company also upsized its credit facility from $700m to $850m, effective upon closing of the acquisition. This provides additional flexibility but also increases potential debt. At current EBITDA of $729.2m and interest expense of about $155–165m per year, interest coverage remains comfortable but depends on oil prices.
The company has bought back 7% of shares since mid-2025, but no repurchases occurred in Q2 due to a blackout period related to the Gulf of America acquisition
Since announcing its current repurchase programme in the second quarter of 2025, Talos Energy has returned about $135m to shareholders through share repurchases, reducing the number of shares outstanding by approximately 7%. However, no repurchases occurred in the second quarter of 2026 due to a corporate blackout period related to the announced Gulf of America acquisition.
The Board of Directors recently increased the total share repurchase authorisation back up to $200m. The remaining authorisation as of August 1, 2026, is $200m. The company plans to allocate up to 50% of annual free cash flow to share repurchases. With free cash flow of $231.6m in the second quarter, this implies a potential repurchase of up to $115.8m per quarter if the blackout is lifted.
Share repurchases are an important element of capital return for Talos Energy, as the company does not pay dividends. Amid oil price volatility, buybacks help support the share price and reduce the number of shares, increasing earnings per share. However, if oil prices fall, the company may cut repurchases to preserve liquidity.
The portal's model values fair value 61% below the current price – the market is pricing in higher oil prices or success from new projects
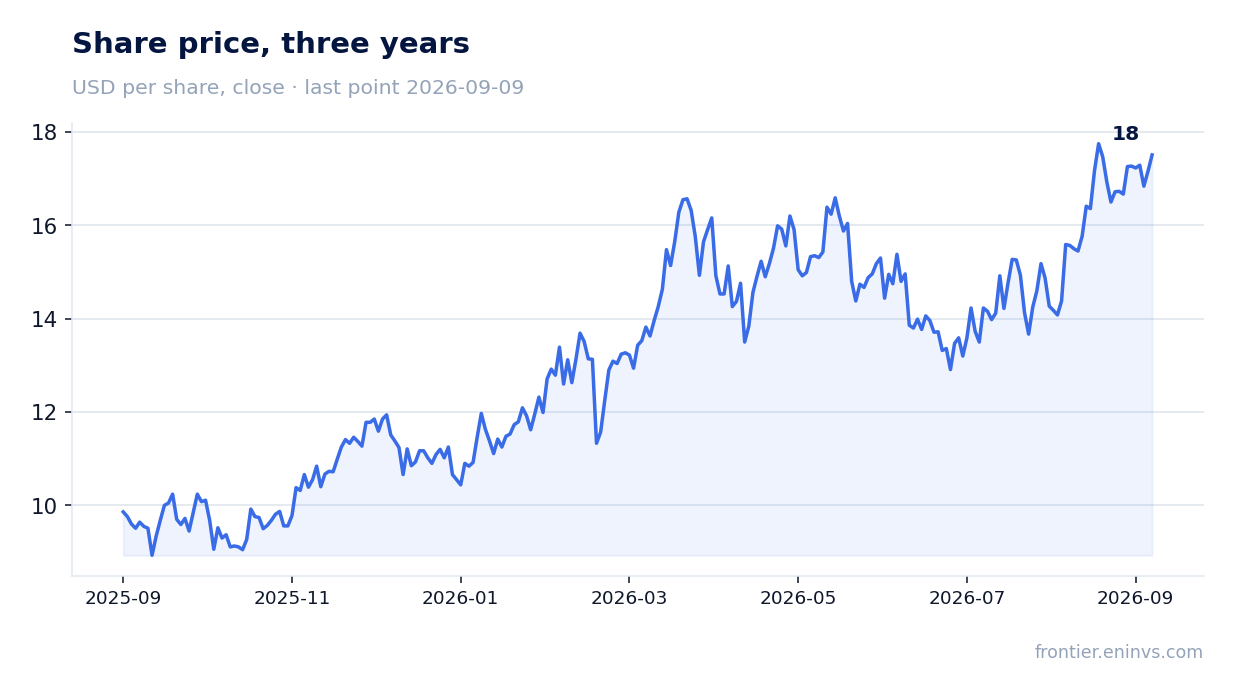
Talos Energy trades at EV/EBITDA LTM of 5.56. This is below its own three-year history, which may indicate undervaluation. However, the portal's model, which re-prices EBITDA at current commodity prices at the target EV/EBITDA, values the share's fair value 61% below the current price. This means the market is pricing in either higher oil prices or the success of new projects such as Monument and Daenerys.
The company's market capitalisation is $3,066.6m, and net debt is $990.6m. The EV/EBITDA LTM ratio of 5.56 looks moderate for an oil and gas company, but if oil prices fall to $70 per barrel, EBITDA could shrink and the multiple would rise. The portal's model likely uses more conservative prices, which explains the difference.
For an investor, it is important to understand that the portal's model is not a consensus forecast but its own calculation. It shows that at current oil prices, the share may be overvalued. However, if the company successfully executes the Monument and Daenerys projects, production and EBITDA will grow, which could justify the current price. The key question is whether Talos Energy can grow production without significantly increasing debt.
Valuation on the latest reported figures
| Metric | Value |
|---|---|
| Market cap | 3.07 bn USD |
| EV/EBITDA (LTM) | 5.6 |
| P/B | 1.41 |
| Net debt / EBITDA (LTM) | 1.36 |
| Operating cash flow (LTM) | 0.94 bn |
| ROE | 30.6% |
Bottom line
Bottom line: Talos Energy delivered a record quarter in revenue, EBITDA, and free cash flow, but a significant part of this result is explained by high oil prices and the absence of an impairment that wiped out profit a year ago. Adjusted profit of $97.8m and free cash flow of $231.6m confirm that the business generates cash, yet leverage on a conservative calculation is 1.36x EBITDA, and the portal's model points to a 61% premium of price over fair value. For a holder, the key question is whether the company can sustain production and EBITDA at current levels under lower oil prices and justify the current valuation through the success of the Monument and Daenerys projects. Verdict: the share looks attractive on the EV/EBITDA LTM multiple of 5.56, but the portal's model and high oil price dependence make the assessment balanced, so the final rating is neutral.
Open the company's financial profile TALO →
See also: market overview · valuation map · stock screeners