Taseko Mines: revenue nearly tripled, but profit rose only 3.4% – costs consumed the growth

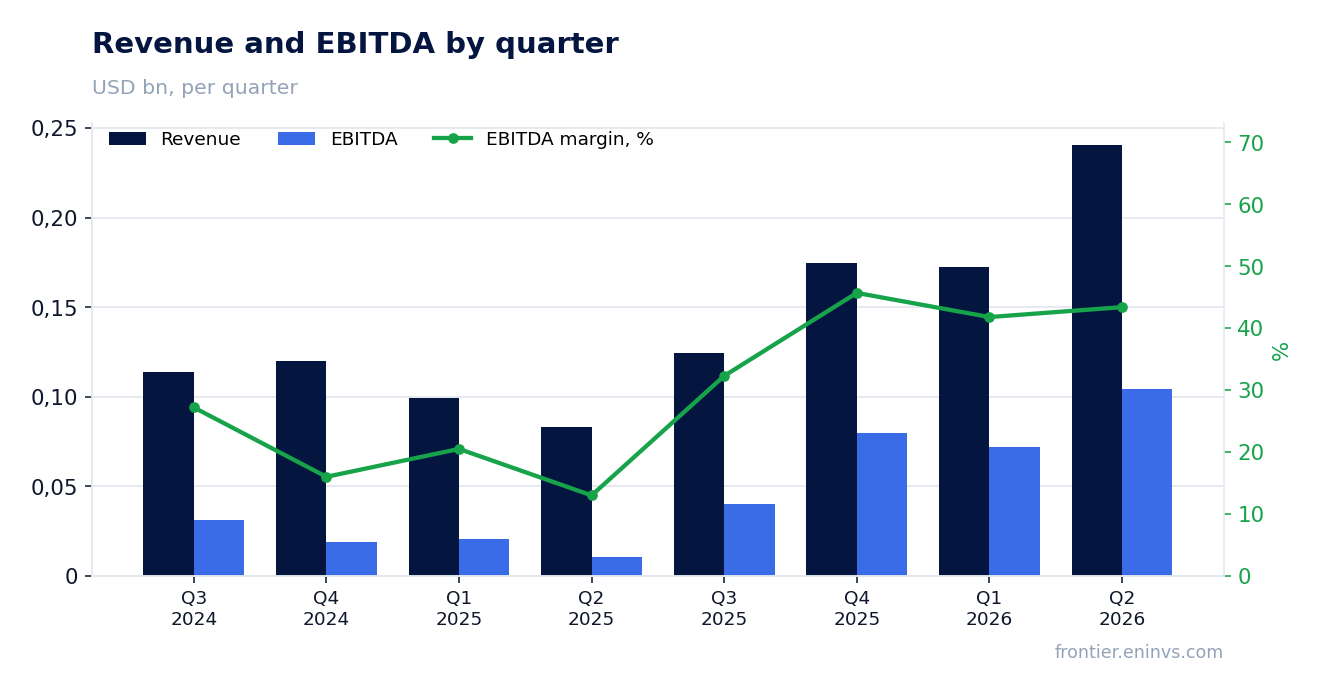
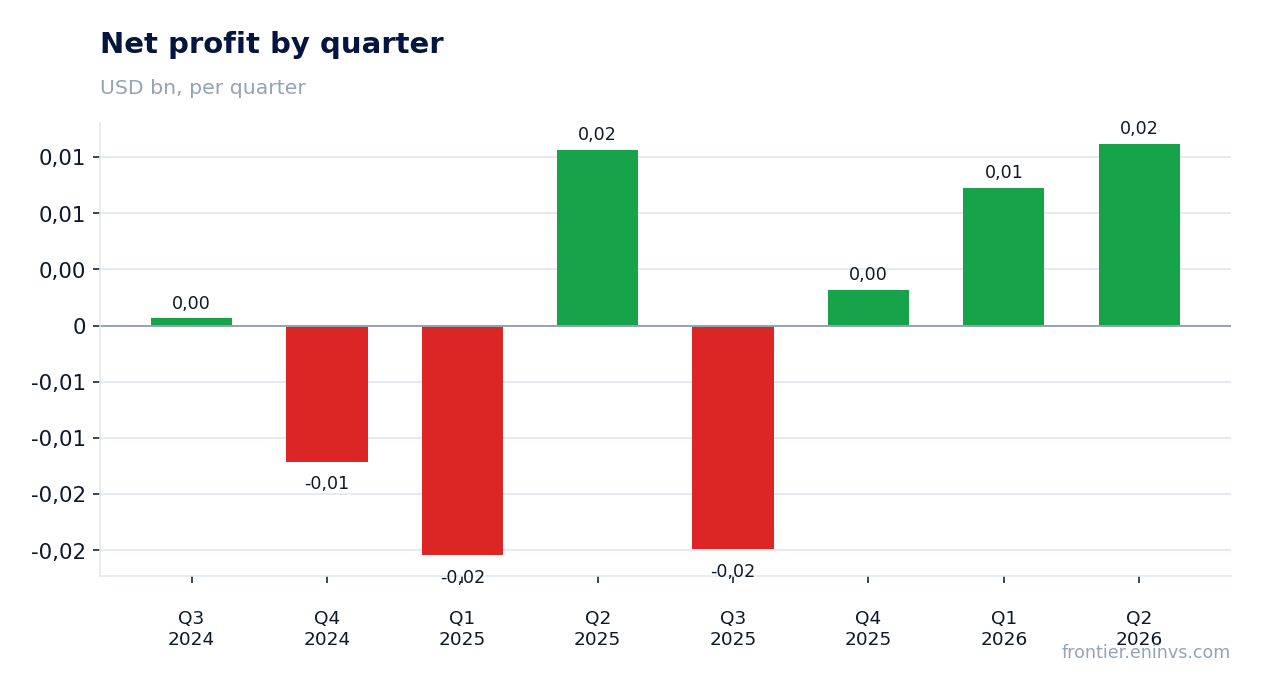
Taseko Mines reported second-quarter 2026 results. Revenue jumped 189.8% year on year to $240.8 million, EBITDA soared 870.0% to $104.6 million, but net profit added only 3.4%, reaching $16.2 million. The EBITDA margin leapt to 43.4% from 13.0% a year earlier, while the net margin fell to 6.7% from 18.8%. At the current price the stock looks neutral: the operating momentum is impressive, but it barely reaches the bottom line, and the multiples already price in a lot.
Key takeaways
— Revenue rose 189.8% year on year to $240.8 million, but net profit added only 3.4% – top-line growth is not converting into earnings
— EBITDA margin jumped to 43.4% from 13.0%, but net margin fell to 6.7% from 18.8% – costs below the operating line absorbed the effect
— Operating cash flow for the quarter was $133.6 million – 55.5% of revenue, pointing to high earnings quality
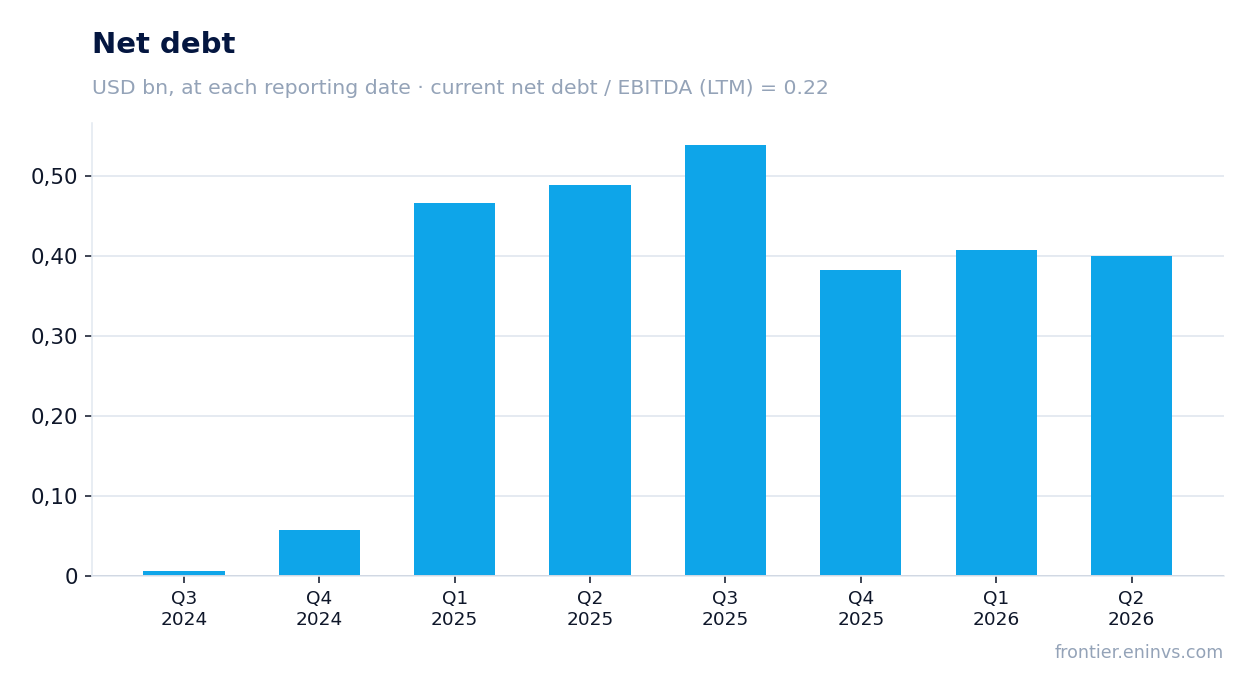
— Net debt stands at $400.2 million, with net debt / EBITDA LTM at 0.22, indicating low leverage
— P/E LTM is 275.2 and EV/EBITDA LTM is 12.2 – the market values the company well above its current earnings
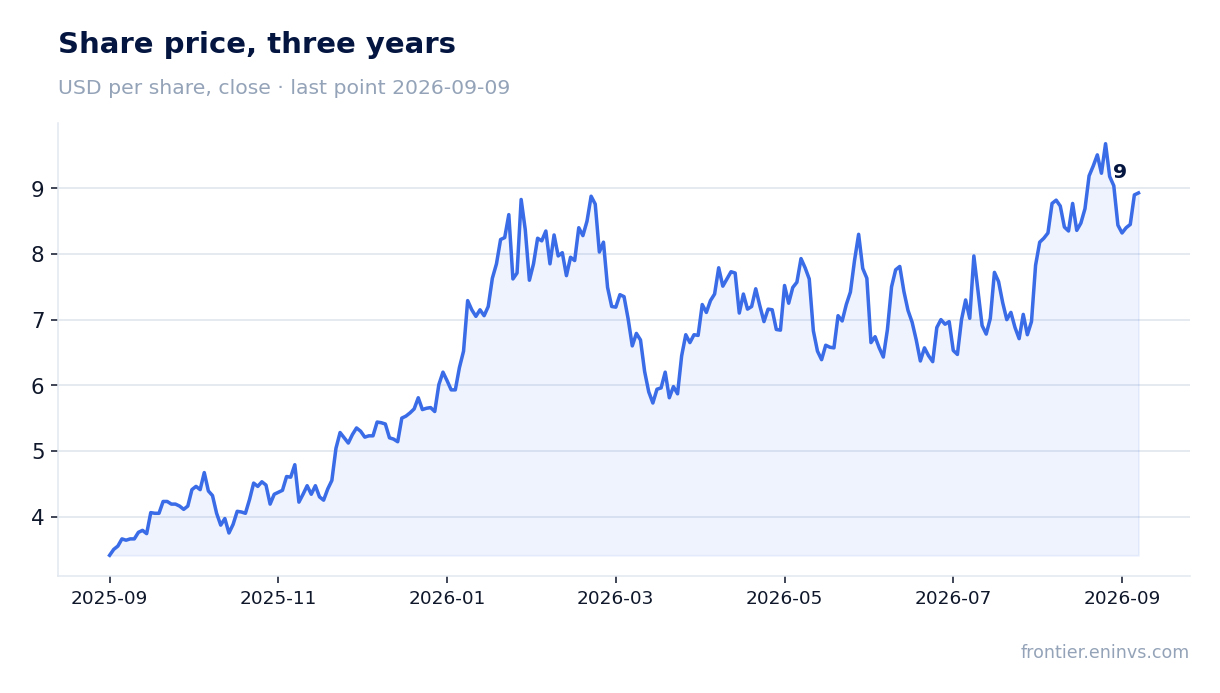
— On the portal's model, the upside to fair value is +4% – the market is already close to our model's valuation
Attractiveness
Key figures, USD bn
| Metric | Q2 2025 | Q2 2026 | Change |
|---|---|---|---|
| Revenue | 0.08 | 0.24 | +189.8% |
| EBITDA | 0.01 | 0.10 | +870.0% |
| Operating profit | -0.01 | 0.08 | to profit |
| Net profit | 0.02 | 0.02 | +3.4% |
| Operating cash flow | 0.02 | 0.13 | +619.2% |
| Capex | 0.03 | — | — |
| EBITDA margin | 13.0% | 43.4% | +30.4 pp |
| Net margin | 18.8% | 6.7% | -12.1 pp |
Revenue rose 189.8% year on year to $240.8 million, but net profit added only 3.4% – top-line growth is not converting into earnings
In the second quarter of 2026, Taseko Mines' revenue reached $240.8 million, up 189.8% year on year. For comparison, growth was 73.4% in the first quarter and 45.5% in the fourth quarter of 2025. The acceleration stems from both a low base last year and a significant increase in physical sales volumes and copper prices.
However, net profit rose only 3.4%, to $16.2 million. The reason is a sharp increase in costs below the operating line: cost of sales, selling, general and administrative expenses, and likely higher interest and taxes. As a result, despite nearly tripling revenue, the company earned only slightly more than a year ago.
This divergence between revenue and profit dynamics is the key takeaway from the report. Investors focusing solely on the top line may be disappointed. The sustainability of the profit improvement will depend on the company's ability to control costs as production grows further.
EBITDA margin jumped to 43.4% from 13.0%, but net margin fell to 6.7% from 18.8% – costs below the operating line absorbed the effect
The EBITDA margin in the second quarter of 2026 was 43.4% versus 13.0% a year earlier. This increase is explained by operating leverage: revenue nearly tripled while a significant portion of costs remained relatively fixed. In absolute terms, EBITDA reached $104.6 million, up 870.0% from the second quarter of 2025.
However, the net margin fell to 6.7% from 18.8%. This means that costs below the operating line – depreciation, interest, taxes and others – grew faster. There may have been one-off write-offs or higher interest payments due to increased debt. In any case, the contrast between operating and net profit is very sharp.
For investors, this signals that revenue growth is not yet translating into higher net profit. If the company can maintain a high EBITDA margin while normalising costs below the operating line, net profit could grow substantially in the coming quarters.
Operating cash flow for the quarter was $133.6 million – 55.5% of revenue, pointing to high earnings quality
Operating cash flow in the second quarter of 2026 reached $133.6 million, which is 55.5% of revenue. This is a very high figure, indicating that the company not only recognises revenue in the income statement but actually collects the cash. For comparison, a year earlier operating cash flow was only $18.6 million.
Such strong cash flow allows the company to fund capital expenditures and service debt without additional financing. In a period of production growth, this is particularly important as it reduces the risk of shareholder value dilution.
However, it is worth remembering that operating cash flow can be volatile due to changes in working capital. Nevertheless, the current level appears sustainable and confirms the company's ability to generate cash.
Net debt stands at $400.2 million, with net debt / EBITDA LTM at 0.22, indicating low leverage
At the end of the second quarter of 2026, Taseko Mines' net debt stood at $400.2 million. This is $0.1 billion lower than over the last 12 months and $0.0 billion lower than at the previous reporting date. The reduction in debt alongside EBITDA growth brought the net debt / EBITDA LTM ratio to 0.22.
Such a leverage level is considered low and gives the company significant financial flexibility. With LTM EBITDA of $268.7 million and LTM operating cash flow of $300.5 million, the company easily services its obligations.
It is important to note that we do not have data on the previous value of this ratio, so we cannot say whether leverage increased or decreased. However, the absolute reduction in net debt alongside EBITDA growth is a positive fact.
P/E LTM is 275.2 and EV/EBITDA LTM is 12.2 – the market values the company well above its current earnings
The P/E LTM for Taseko Mines is 275.2, reflecting extremely low trailing twelve-month net profit of just $11.7 million. This makes earnings-based valuation almost meaningless: the market is clearly pricing in future growth rather than current results.
EV/EBITDA LTM is 12.2. This is a more relevant metric for a mining company, and it looks moderate but not cheap. For comparison, the company may have historically traded at a lower multiple, but we do not have data on the three-year average, so we cannot say whether the current level is above or below its own history.
The company's market capitalisation is $3,224.6 million. With LTM EBITDA of $268.7 million and net debt of $400.2 million, EV is approximately $3,624.8 million, which yields the EV/EBITDA of 12.2. Investors are paying a fairly high price for current cash flow, which requires confidence in sustained high copper prices.
On the portal's model, the upside to fair value is +4% – the market is already close to our model's valuation
Our model, which reprices EBITDA at current commodity prices and a target EV/EBITDA, shows that the fair value of Taseko Mines shares is only 4% above the current market price. This means the market has already almost fully priced in favourable copper prices.
Such limited upside suggests that further gains require either higher metal prices or operational improvements beyond current expectations. At the same time, downside risks could be significant if the market is disappointed.
For investors, this signals that the current valuation does not offer a large margin of safety. The stock may only appeal to those who believe in further copper price increases or in the company's efficiency improvements.
Valuation on the latest reported figures
| Metric | Value |
|---|---|
| Market cap | 3.22 bn USD |
| P/E (LTM) | 275.2 |
| EV/EBITDA (LTM) | 12.2 |
| P/B | 8.78 |
| Net debt / EBITDA (LTM) | 0.22 |
| Operating cash flow (LTM) | 0.30 bn |
| ROE | 10.6% |
Bottom line
Taseko Mines delivered impressive revenue and EBITDA growth in the second quarter of 2026, but net profit barely increased due to faster growth in costs. Operating cash flow remains strong and leverage is low, giving the company resilience. However, the current valuation multiples look high relative to historical levels, and the upside on our model is limited to 4%. The key question for a holder now is whether the company can convert operating growth into net profit and justify the expectations embedded in the price.
Open the company's financial profile TGB →
See also: market overview · valuation map · stock screeners