US Energy: revenue is falling more slowly, but the loss per dollar of revenue is growing
On 25 April US Energy released its first-quarter 2026 results. Revenue fell 26.9% year on year to $1.604 million, EBITDA remained negative at –$2.585 million, and the net loss was $3.185 million. With a market capitalisation of $58.8 million and a negative return on equity of –40.7%, the share does not look attractive: the scale of the business continues to shrink, and costs are not keeping pace.
Key takeaways
— Revenue has been falling for five consecutive quarters, but the rate of decline slowed to 26.9%
— Negative EBITDA deepened: –$2.585 million versus –$1.969 million a year earlier
— The net loss of $3.185 million is nearly twice the quarter's revenue
— Operating cash flow is negative again at –$2.452 million, with zero capital expenditure
— Net debt is negative at –$7.905 million, but that does not offset the losses
— Return on equity is –40.7% with a market capitalisation of $58.8 million
Attractiveness
Key figures, USD bn
| Metric | Q1 2025 | Q1 2026 | Change |
|---|---|---|---|
| Revenue | 0.00 | 0.00 | -26.9% |
| EBITDA | -0.00 | -0.00 | — |
| Operating profit | -0.00 | -0.00 | — |
| Net profit | -0.00 | -0.00 | — |
| Operating cash flow | -0.00 | -0.00 | — |
| Capex | 0.00 | 0.00 | -100.0% |
| EBITDA margin | -89.8% | -161.2% | -71.4 pp |
| Net margin | -141.9% | -198.6% | -56.7 pp |
Revenue has been falling for five consecutive quarters, but the rate of decline slowed to 26.9%
In the first quarter of 2026, US Energy's revenue was $1.604 million, down 26.9% from a year earlier. This is the fifth consecutive quarterly decline: in Q3 2024 the drop was 43.3%, in Q2 2025 – 66.5%, in Q3 2025 – 64.9%. The slowing rate of decline is the only positive in the report, but it does not signal a turnaround: revenue is still far below 2024 levels.
The revenue decline reflects an overall contraction of the business. The company does not disclose the reasons, but the dynamics of quarterly figures suggest that demand for its services or products continues to shrink. Even if the decline slows, the absolute level of revenue at $1.6 million per quarter is extremely small for a company with a market capitalisation of nearly $59 million.
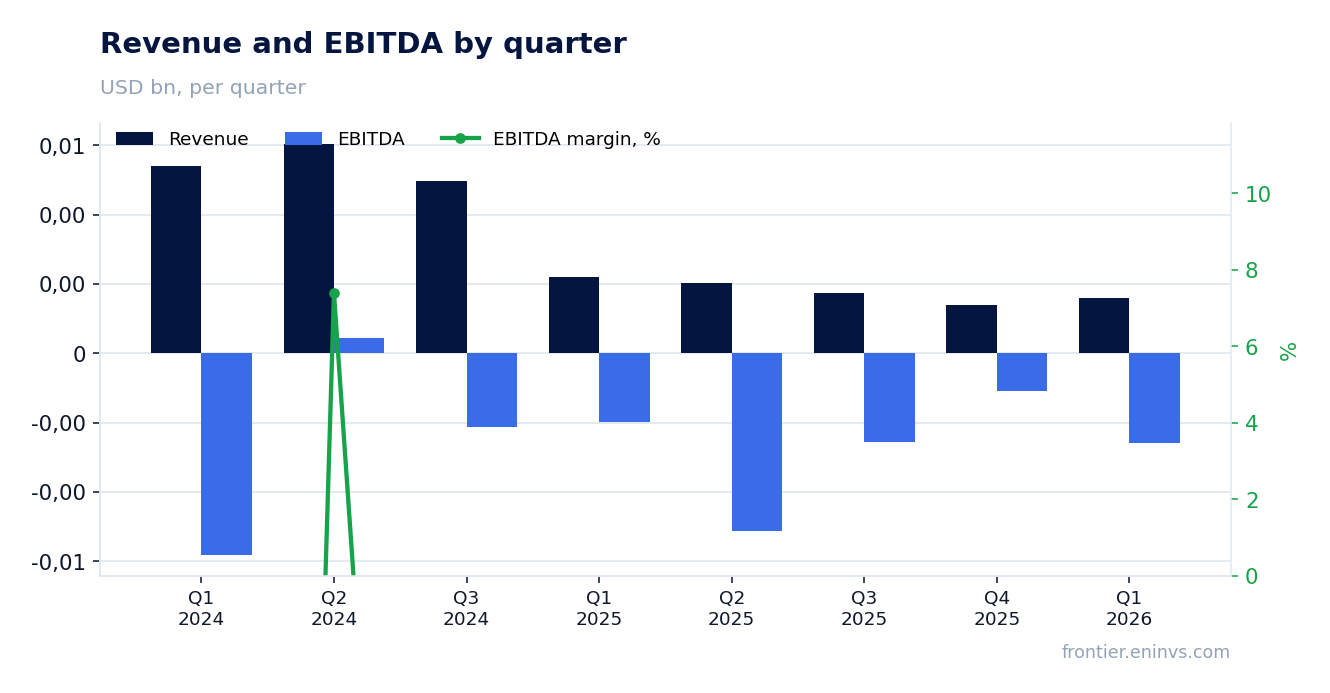
Negative EBITDA deepened: –$2.585 million versus –$1.969 million a year earlier
EBITDA in Q1 2026 was –$2.585 million versus –$1.969 million a year earlier. The EBITDA loss widened by 31.3%, even though revenue fell only 26.9%. This means the company could not cut operating expenses proportionally: fixed costs are weighing on the result.
The EBITDA margin in Q1 2026 was –161.2% versus –89.8% a year earlier. The negative margin nearly doubled. With revenue of $1.604 million, an EBITDA loss of $2.585 million means that for every dollar of revenue, there is $1.61 of loss before interest, taxes and amortisation. This points to critically low business efficiency.
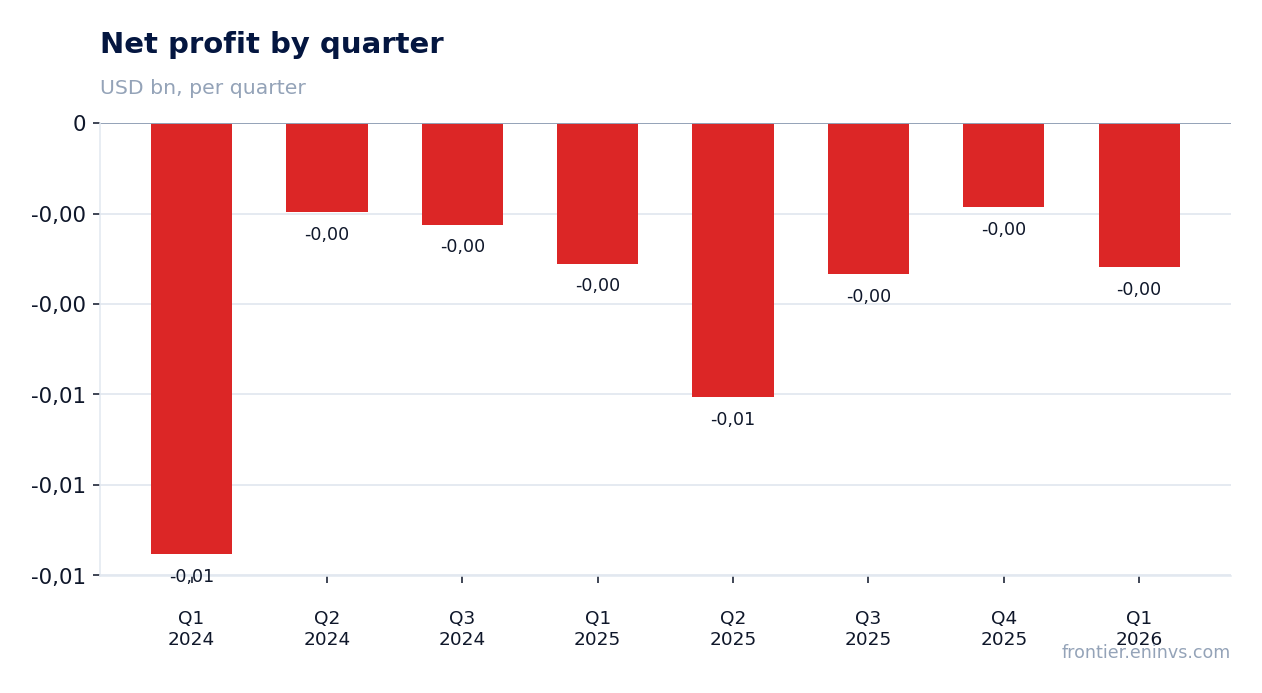
The net loss of $3.185 million is nearly twice the quarter's revenue
The net loss in Q1 2026 was $3.185 million, up 2.4% from $3.111 million a year earlier. With revenue of $1.604 million, the loss is nearly twice the revenue. The net margin deteriorated to –198.6% from –141.9% a year earlier.
The operating loss also widened to $3.144 million from $3.088 million a year earlier. The difference between operating and net loss is small, indicating no significant interest expenses or tax effects. The loss is driven by operations, not by financial or one-off items.
Operating cash flow is negative again at –$2.452 million, with zero capital expenditure
Operating cash flow in Q1 2026 was –$2.452 million versus –$4.544 million a year earlier. The $2.092 million improvement came despite lower revenue, possibly due to working capital reduction or one-off inflows. However, cash outflow continues, and the company is not generating cash from core operations.
Capital expenditure in Q1 2026 was zero, as in the previous three quarters. The company is not investing in development, which in a shrinking revenue environment could mean either a lack of funds or a refusal to maintain infrastructure. Over the trailing twelve months, operating cash flow was –$7.1 million – a persistent outflow.
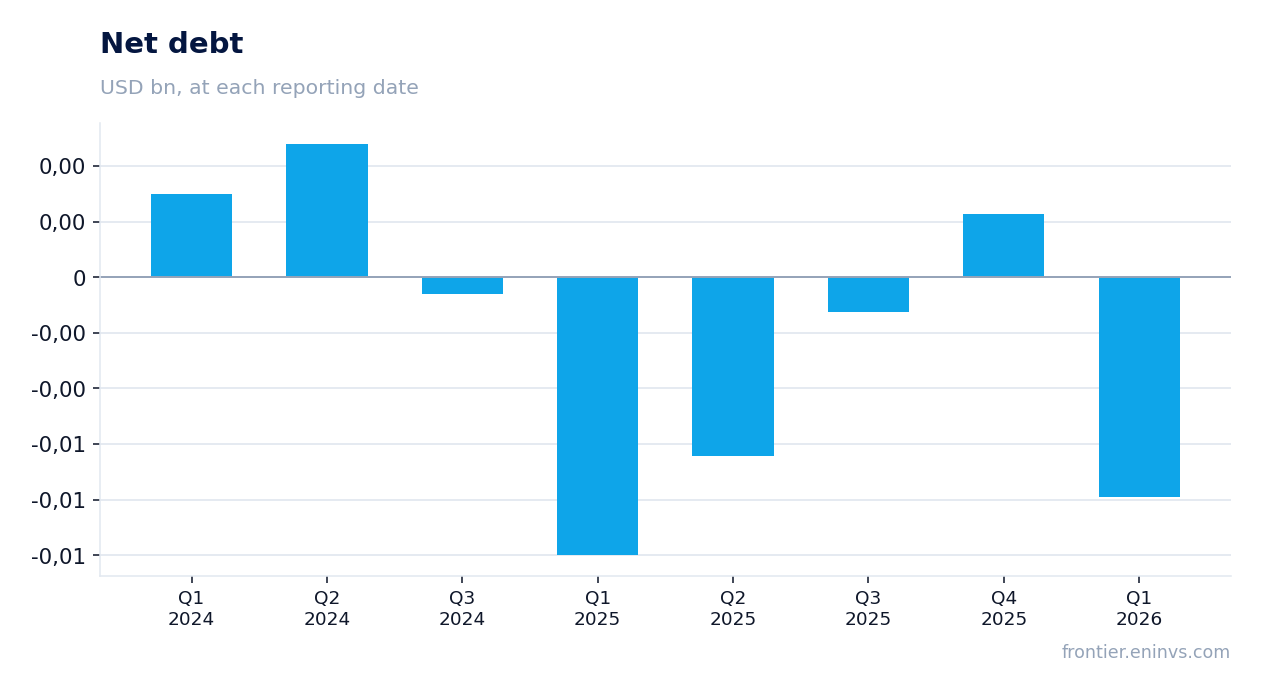
Net debt is negative at –$7.905 million, but that does not offset the losses
Net debt at the end of Q1 2026 was –$7.905 million, meaning cash exceeds debt. This is the company's only financial buffer. However, negative net debt does not offset operating losses: $2.452 million of cash was burned in the quarter, and at this pace liquidity would be exhausted in about three quarters.
Compared with the previous reporting date, net debt was virtually unchanged – the change was less than $0.1 million. Over the trailing twelve months, net debt also remained at the same level. This means the company is not raising new debt or spending significantly on repayment, but it is also not improving its debt position.
Return on equity is –40.7% with a market capitalisation of $58.8 million
Return on equity (ROE) is –40.7%, reflecting the unprofitability of the business. With a market capitalisation of $58.8 million and negative or low equity base, this indicator signals value destruction for shareholders. The company is losing money on every dollar of invested capital.
The company's market value ($58.8 million) against trailing twelve-month revenue of $6.8 million gives a P/S multiple of about 8.6. For a loss-making business with declining revenue, this valuation level appears inflated. Comparison with the company's historical multiples is not possible due to lack of data in the FACTS, but the current level is not supported by fundamentals.
Valuation on the latest reported figures
| Metric | Value |
|---|---|
| Market cap | 0.06 bn USD |
| P/B | 2.43 |
| Operating cash flow (LTM) | -0.01 bn |
| ROE | -40.7% |
Bottom line
In Q1 2026, US Energy showed a slowdown in revenue decline to 26.9%, but that is the only positive. Losses at all levels – EBITDA, operating, net – increased, and negative operating cash flow with zero capital expenditure indicates no internal sources of financing. Negative net debt of $7.905 million provides temporary relief, but at the current cash burn rate it will not last long. The share does not look attractive: the business is shrinking, losses are growing, and the valuation at a P/S of about 8.6 is not justified by fundamentals.
Open the company's financial profile USEG →
See also: market overview · valuation map · stock screeners