Valvoline: revenue up 24% but EPS lagged and net debt stands at 4.05x LTM EBITDA
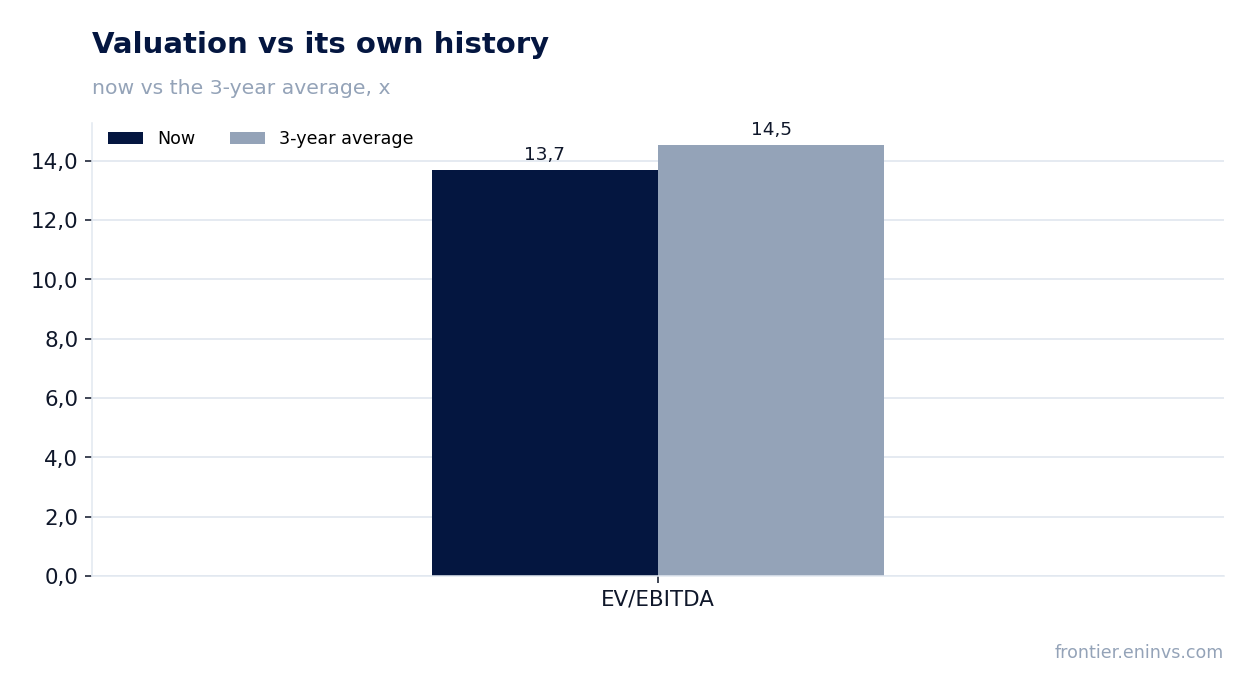
On August 5, Valvoline reported results for the third quarter of fiscal 2026. Revenue rose 24.1% year on year to $544.6 million, adjusted EBITDA grew 25% to $162.4 million, and net income from continuing operations increased 14.2% to $65.0 million. Adjusted EPS rose 21% to $0.57, but net income lagging EBITDA points to higher interest and depreciation costs. With an LTM EV/EBITDA of 13.7 versus its own three-year average of 14.5 and net debt at 4.05x LTM EBITDA, the share is neutrally valued: business growth is strong, but leverage and slowing profit growth limit its appeal.
Key takeaways
— Revenue rose 24.1% year on year to $544.6 million, but growth slowed from 25.0% in the prior quarter
— Adjusted EBITDA grew 25% to $162.4 million, with margin reaching 29.8% versus 28.5% a year earlier
— Net income from continuing operations rose only 14.2% to $65.0 million, lagging EBITDA due to interest and depreciation costs
— Adjusted EPS rose 21% to $0.57, but the gap with net income is driven by one-off items
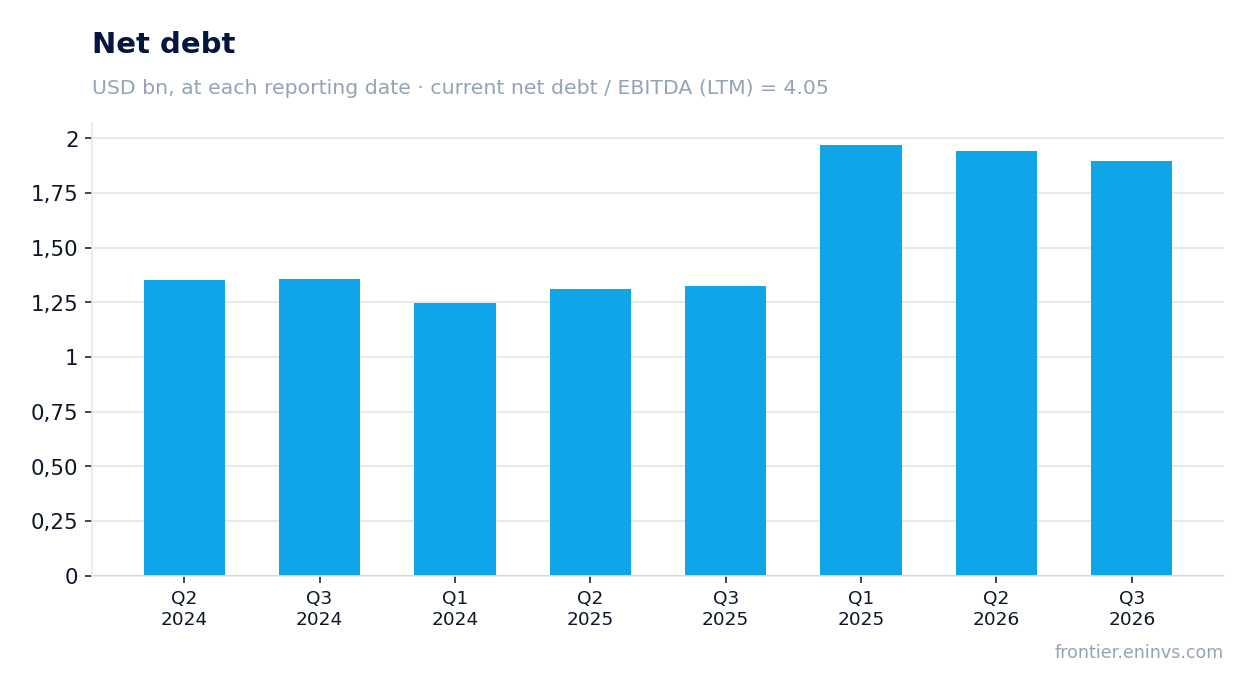
— Net debt of $1,615.8 million and leverage of 4.05x LTM EBITDA limit financial flexibility
— Operating cash flow for the nine months rose to $284.6 million, with free cash flow at $112.3 million
— The LTM EV/EBITDA multiple of 13.7 is below the company's own three-year average of 14.5, leaving the stock moderately undervalued
Attractiveness
Key figures, USD bn
| Metric | Q3 2025 | Q3 2026 | Change |
|---|---|---|---|
| Revenue | 0.44 | 0.54 | +24.1% |
| EBITDA | 0.12 | 0.16 | +30.0% |
| Operating profit | 0.09 | 0.11 | +18.5% |
| Net profit | 0.06 | 0.06 | +14.2% |
| Operating cash flow | 0.09 | 0.12 | +43.2% |
| Capex | 0.05 | 0.06 | +4.0% |
| EBITDA margin | 28.5% | 29.8% | +1.3 pp |
| Net margin | 12.9% | 11.8% | -1.1 pp |
Revenue rose 24.1% year on year to $544.6 million, but growth slowed from 25.0% in the prior quarter
In the third quarter of fiscal 2026, Valvoline's revenue reached $544.6 million, up 24.1% year on year. This continues a strong trend: growth was 25.0% in the prior quarter and only 4.2% a year earlier. The acceleration began in the first quarter of fiscal 2026, when revenue rose 25.0% following the Breeze Autocare acquisition.
System-wide store sales drove the growth, rising 19% to $1,053.9 million, while same-store sales increased 8.0%. The company attributes this to pricing actions taken during the quarter and store additions: 47 new stores were added, including 22 company-operated and 25 franchised.
The store count reached 2,456 at quarter-end, up 15.6% year on year. Network expansion remains a key revenue driver, but its contribution to profit is limited by higher opening and integration costs.
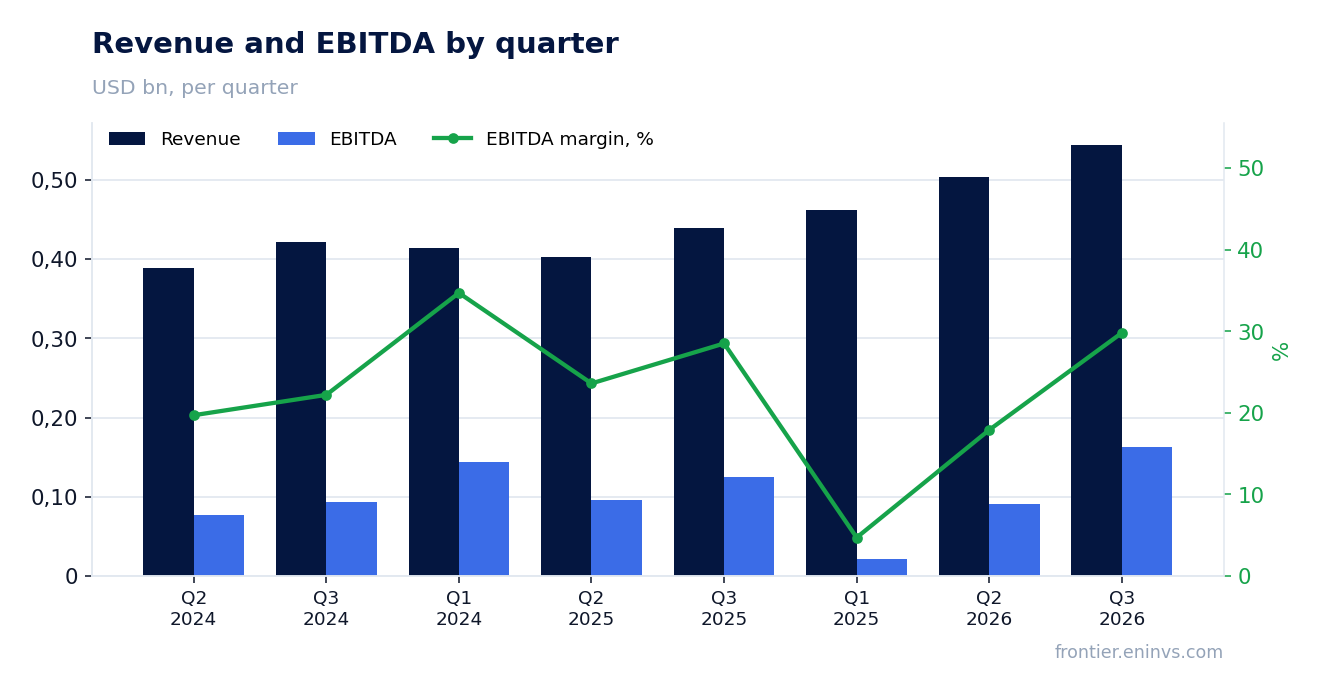
Adjusted EBITDA grew 25% to $162.4 million, with margin reaching 29.8% versus 28.5% a year earlier
Adjusted EBITDA in the third quarter was $162.4 million, up 25% year on year. The margin on this metric reached 29.8% versus 28.5% a year earlier. Margin improvement came on the back of revenue growth and operational discipline, as stated by CEO Lori Flees.
The company notes improved SG&A leverage – the ratio of selling, general and administrative expenses to revenue declined. This is supported by SG&A rising to $103.0 million, but its share of revenue decreased. However, rising labor and material costs remain a pressure point.
Adjusted EBITDA differs from reported EBITDA ($151.7 million) by key items totaling $10.7 million, including IT transition costs ($7.0 million) and investment-related costs ($4.9 million). These items are non-operational and do not affect cash flow.
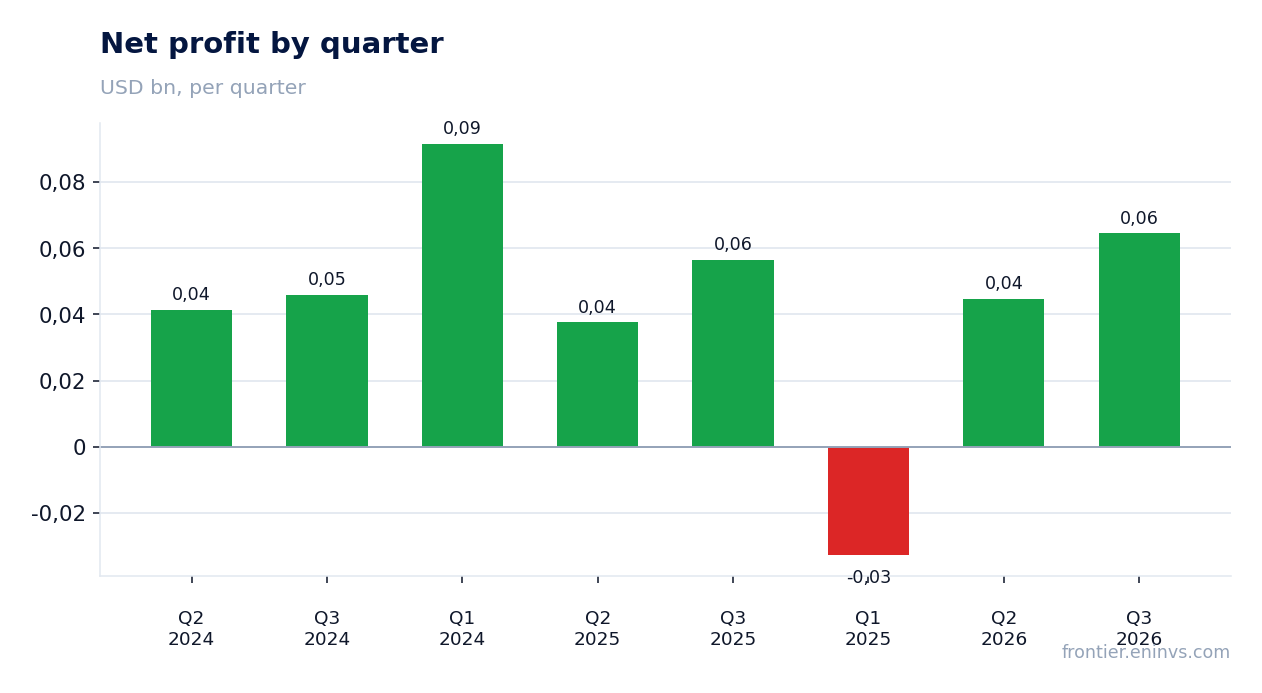
Net income from continuing operations rose only 14.2% to $65.0 million, lagging EBITDA due to interest and depreciation costs
Net income from continuing operations was $65.0 million, up 14.2% year on year. This growth significantly lags EBITDA dynamics (+30.0% on a reported basis), explained by higher interest expenses and depreciation.
Interest expenses rose to $27.9 million from $18.6 million a year earlier – a 50% increase due to higher debt following the Breeze Autocare acquisition. Depreciation and amortization also increased to $38.2 million from $30.2 million, linked to network expansion and integration of acquired assets.
As a result, net margin declined to 11.8% from 12.9% a year earlier. This reflects the pressure of financial costs eating into operational growth. To improve profitability further, the company needs to reduce leverage or refinance debt on more favorable terms.
Adjusted EPS rose 21% to $0.57, but the gap with net income is driven by one-off items
Adjusted earnings per share were $0.57, up 21% year on year. Reported EPS rose 16% to $0.51. The difference between these metrics is due to key items that the company excludes from adjusted profit.
Total after-tax adjustments amounted to $7.9 million, including IT transition costs ($7.0 million pre-tax), investment-related costs ($5.8 million), and debt extinguishment costs ($0.8 million). These items do not reflect operational activity and do not affect cash flow.
Adjusted profit better reflects current operational efficiency, but investors should note that one-off expenses recur from quarter to quarter. For example, IT transition and legacy costs have been present for several periods.
Net debt of $1,615.8 million and leverage of 4.05x LTM EBITDA limit financial flexibility
Net debt at quarter-end was $1,615.8 million, with the ratio of net debt to LTM EBITDA at 4.05. This is a high level for a company with a market capitalization of $3,854 million, creating risks if market conditions deteriorate.
Total debt stands at $1.6 billion, including $31.1 million short-term and $1,570.9 million long-term. During the quarter, the company voluntarily repaid $50 million on its Term Loan A, slightly reducing debt but not changing the overall picture. Interest expenses for the nine months rose to $81.1 million from $53.0 million a year earlier.
High leverage limits opportunities for share buybacks and dividend increases. The company does not pay dividends, preferring to direct funds toward growth and debt servicing. Reducing leverage remains a key task for improving investment appeal.
Operating cash flow for the nine months rose to $284.6 million, with free cash flow at $112.3 million
Operating cash flow from continuing operations for the nine months was $284.6 million versus $180.0 million a year earlier. Free cash flow reached $112.3 million, an improvement of $93 million year on year. This is a positive signal indicating the ability to generate cash.
Capital expenditures for the nine months were $172.3 million, of which $43.3 million was maintenance and the rest growth. The company lowered its full-year capex guidance to $240–260 million from $250–280 million, which could free up additional funds.
Free cash flow excluding growth capex was $241.3 million, significantly above last year's $144.9 million. This shows that operations generate enough cash to cover maintenance costs and debt servicing.
The LTM EV/EBITDA multiple of 13.7 is below the company's own three-year average of 14.5, leaving the stock moderately undervalued
The current LTM EV/EBITDA multiple is 13.7, below its own three-year average of 14.5. This indicates the stock is trading at a discount to its historical valuation. The LTM P/E is 38.0, reflecting low net income due to high interest expenses.
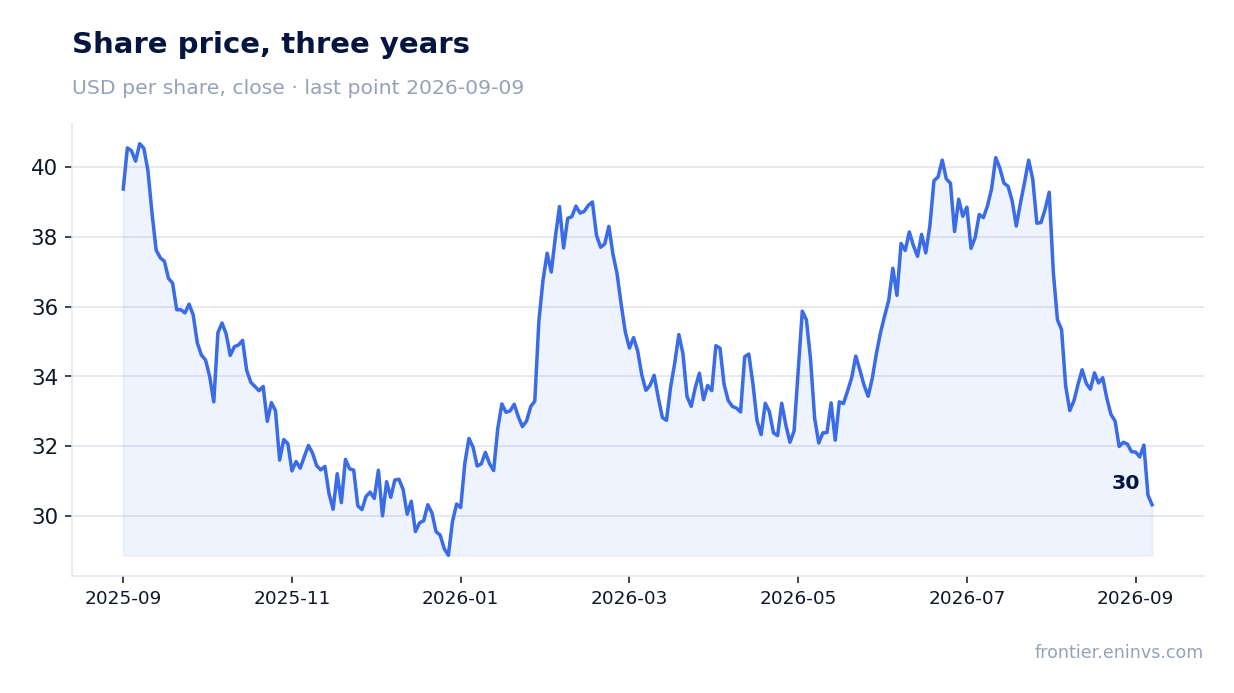
Market capitalization at the time of the report was $3,854 million. Since publication, the stock fell 5.9% on the report day and 22.8% by September 9, 2026. This dynamics may be linked to investor disappointment with profit growth rates and high debt.
A multiple below the historical average may signal undervaluation, but it also reflects risks associated with leverage and slowing profit growth. For a sustainable valuation re-rating, the company needs to demonstrate the ability to grow profit faster than revenue.
Valuation on the latest reported figures
| Metric | Value |
|---|---|
| Market cap | 3.85 bn USD |
| P/E (LTM) | 38.0 |
| EV/EBITDA (LTM) | 13.7 |
| P/B | 11.39 |
| Net debt / EBITDA (LTM) | 4.05 |
| Operating cash flow (LTM) | 0.30 bn |
| ROE | 22.3% |
| EV/EBITDA, 3-year average | 14.5 |
Bottom line
Valvoline delivered strong revenue growth of 24.1% and improved EBITDA margin to 29.8%, confirming business resilience and successful integration of acquisitions. However, net income rose only 14.2% due to higher interest and depreciation costs, and leverage at 4.05x LTM EBITDA remains high. Free cash flow improved to $112.3 million for the nine months, but a significant portion goes to debt servicing. The LTM EV/EBITDA multiple of 13.7 is below the three-year average of 14.5, which may indicate undervaluation, but risks related to debt and slowing profit growth limit the upside. The stock is neutrally valued: the current price fairly reflects both strong operational results and financial constraints.
Open the company's financial profile VVV →
See also: market overview · valuation map · stock screeners