Weyerhaeuser: profit doubled, but almost all of it came from land sales, not from the mills
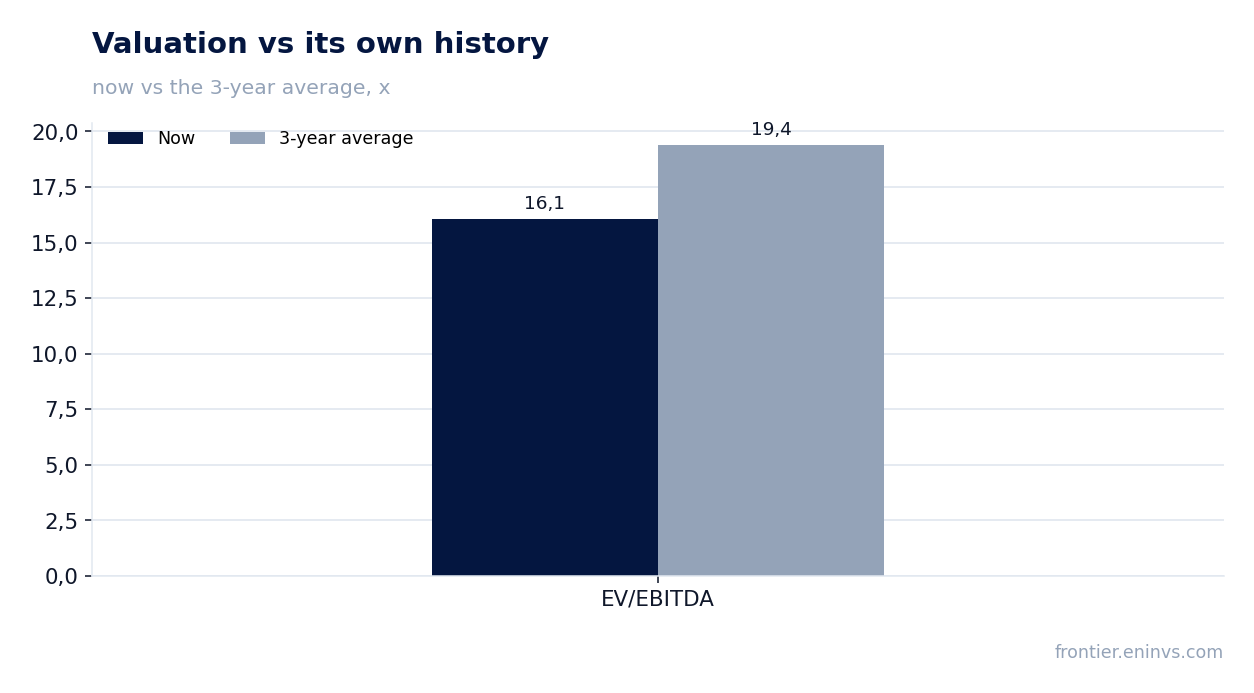
On 30 July Weyerhaeuser reported second-quarter 2026 results. Revenue fell 0.9% year on year to $1,867 million, EBITDA added 2.3% to $310 million, and net profit rose 86.2% to $162 million. The profit jump came almost entirely from one-off timberland sales: excluding them, earnings per share would have been $0.13 against the reported $0.23. At an EV/EBITDA of 16.1 versus its own three-year average of 19.4 and a dividend yield of 3.7%, the share looks rather attractive, but only if one-off land sales do not prove to be the sole source of profit.
Key takeaways
— Revenue has fallen for six straight quarters, with the decline slowing to 0.9% in Q2
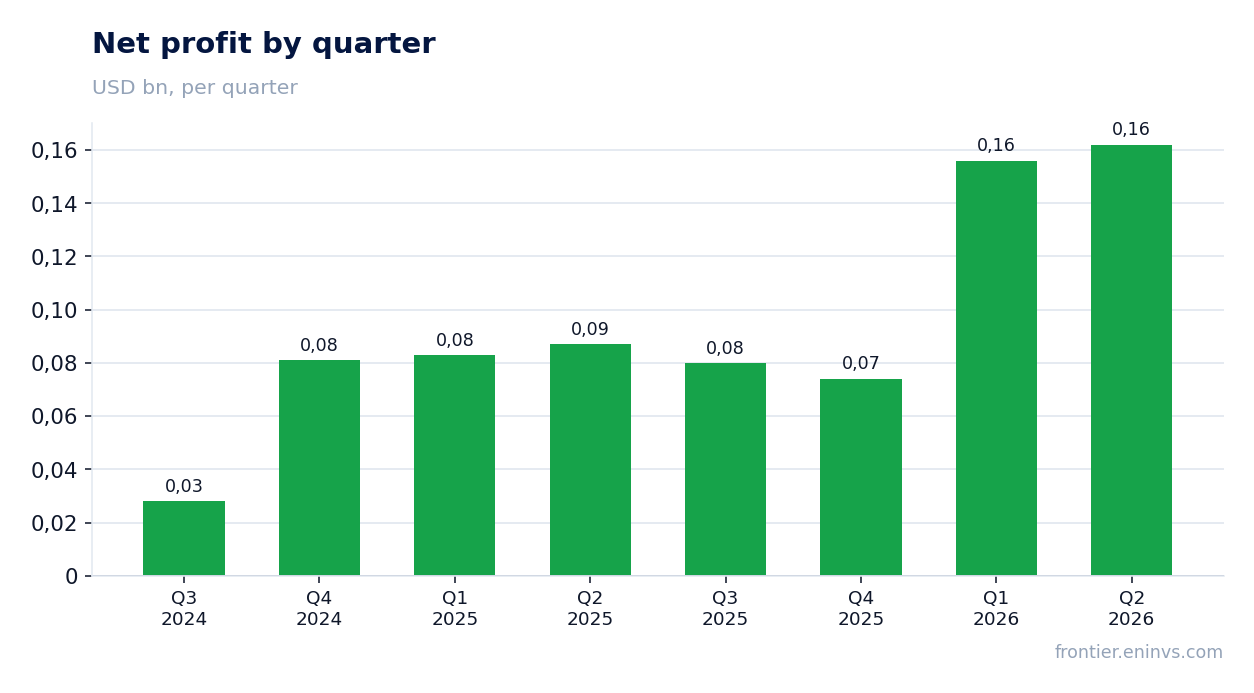
— Profit rose 86.2%, but $71 million of it came from timberland sales
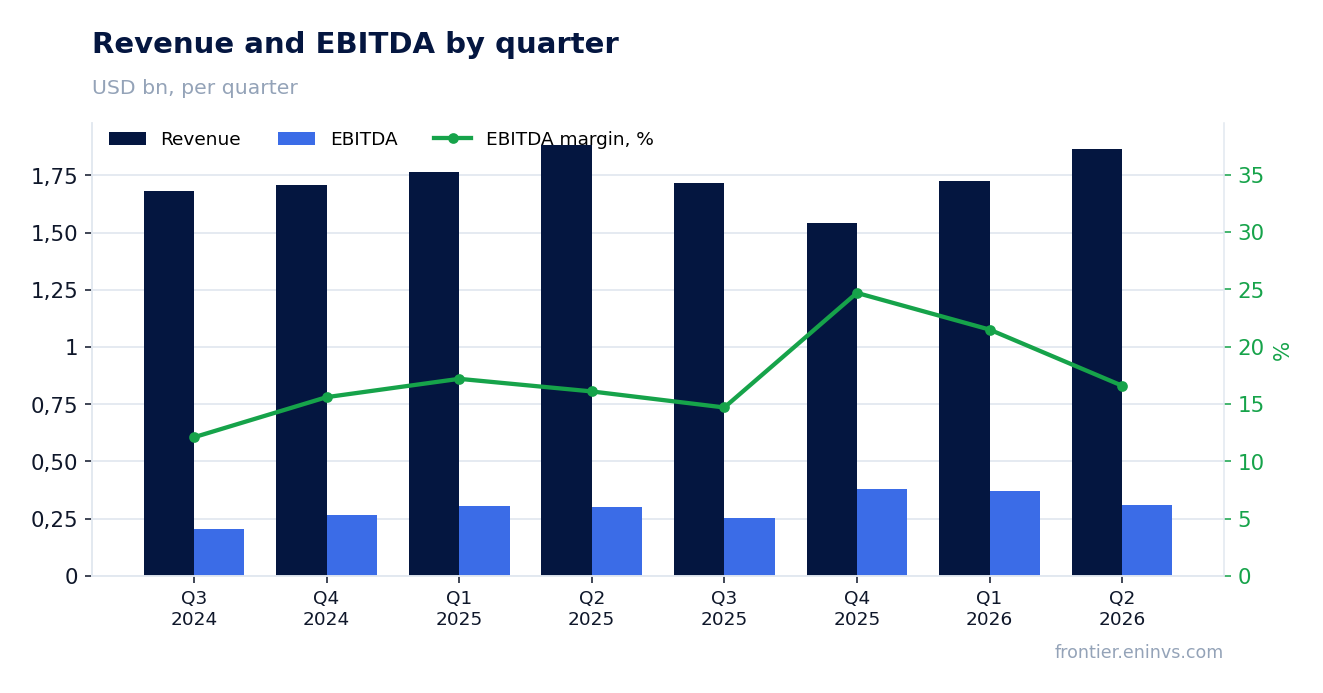
— EBITDA margin rose to 16.6% on lower selling and G&A expenses
— Leverage of 3.91x EBITDA consumes almost all of free cash flow
— The $0.21 dividend at a 3.7% yield remains the main support for a holder
— EV/EBITDA of 16.1 versus its own three-year average of 19.4 — a discount to history
Attractiveness
Key figures, USD bn
| Metric | Q2 2025 | Q2 2026 | Change |
|---|---|---|---|
| Revenue | 1.88 | 1.87 | -0.9% |
| EBITDA | 0.30 | 0.31 | +2.3% |
| Operating profit | 0.18 | 0.22 | +25.3% |
| Net profit | 0.09 | 0.16 | +86.2% |
| Operating cash flow | 0.40 | 0.40 | +0.8% |
| Capex | 0.11 | 0.14 | +29.9% |
| EBITDA margin | 16.1% | 16.6% | +0.5 pp |
| Net margin | 4.6% | 8.7% | +4.1 pp |
Revenue has fallen for six straight quarters, with the decline slowing to 0.9% in Q2
Second-quarter 2026 revenue came in at $1,867 million, down 0.9% from a year earlier. This is the sixth consecutive quarterly decline: the first quarter was down 2.0%, the fourth quarter of 2025 was down 9.8%, and the third quarter of 2025 actually grew 2.1%. The slowing decline is the only positive signal in the top line.
The main drag came from the wood products segment: revenue there fell to $1,360 million from $1,357 million a year earlier, but the internal shifts are more telling. OSB sales dropped to $180 million from $205 million, and realisations fell to $242 per square foot from $280. Lumber prices, by contrast, rose to $508 from $454 per thousand board feet, partially offsetting lower volumes.
The Timberlands segment posted revenue of $367 million against $373 million a year earlier. Western log prices fell to $115.27 per ton from $117.69, but volumes in that region rose to 1,487 thousand tons from 1,430 thousand tons. In the South, prices were almost flat at $38.20 versus $37.71, while volumes fell to 3,812 thousand tons from 4,074 thousand tons.
The Strategic Land Solutions segment saw revenue decline to $140 million from $154 million a year earlier. Notably, climate solutions sales collapsed to $15 million from $56 million, while real estate sales rose to $91 million from $72 million. The average price per acre in real estate rose to $4,319 from $4,161.
Profit rose 86.2%, but $71 million of it came from timberland sales
Second-quarter 2026 net profit came in at $162 million against $87 million a year earlier — growth of 86.2%. However, the report explicitly states that $71 million pre-tax came from timberland sales, recorded as a one-off gain. Without that transaction, earnings per share would have been $0.13 rather than the reported $0.23.
One-off items are not limited to land sales. In the first quarter of 2026 the company received $21 million in product remediation insurance, also recorded as a special item. In total, special items pre-tax for the first half of 2026 amounted to $157 million, and excluding them earnings per share for the half would have been $0.23 against the reported $0.44.
Operating profit in the second quarter rose to $223 million from $178 million a year earlier, but here too the contribution of one-off factors is decisive. Excluding the land sale, operating profit in the Timberlands segment would have been $59 million against $88 million a year earlier — meaning the underlying timberland business would have shown a decline, not growth.
The Wood Products segment increased operating profit to $71 million from $46 million a year earlier. There were no one-off items here, and the improvement came mainly from cost reduction: cost of sales fell to $1,223 million from $1,243 million, and G&A expenses fell to $37 million from $40 million. This is genuine operational improvement, not an accounting effect.
EBITDA margin rose to 16.6% on lower selling and G&A expenses
The EBITDA margin in the second quarter of 2026 was 16.6% against 16.1% a year earlier. A 0.5 percentage point increase on a 0.9% revenue decline means the company cut costs faster than sales fell. EBITDA in absolute terms rose to $310 million from $303 million.
The main contribution to the margin improvement came from lower selling and G&A expenses. Selling expenses fell to $24 million from $23 million a year earlier, though in the Wood Products segment they rose to $23 million from $22 million. G&A expenses declined to $115 million from $114 million, with the Wood Products segment down to $37 million from $40 million, while Timberlands stayed flat at $24 million.
Cost of sales for the company overall fell to $1,556 million from $1,559 million a year earlier. In the Wood Products segment, cost of sales dropped to $1,223 million from $1,243 million, which on revenue of $1,360 million produced a gross margin of $137 million against $114 million a year earlier. In Timberlands, cost of sales rose to $434 million from $416 million, linked to higher harvest volumes.
The net margin rose to 8.7% from 4.6% a year earlier, but that increase is almost entirely explained by one-off items. Without the land sale, the net margin would have been closer to 5.5%. The operating margin in Wood Products rose to 5.2% from 3.4% — a sustainable improvement — while in Timberlands, excluding one-offs, the operating margin would have fallen to 11.4% from 16.6%.
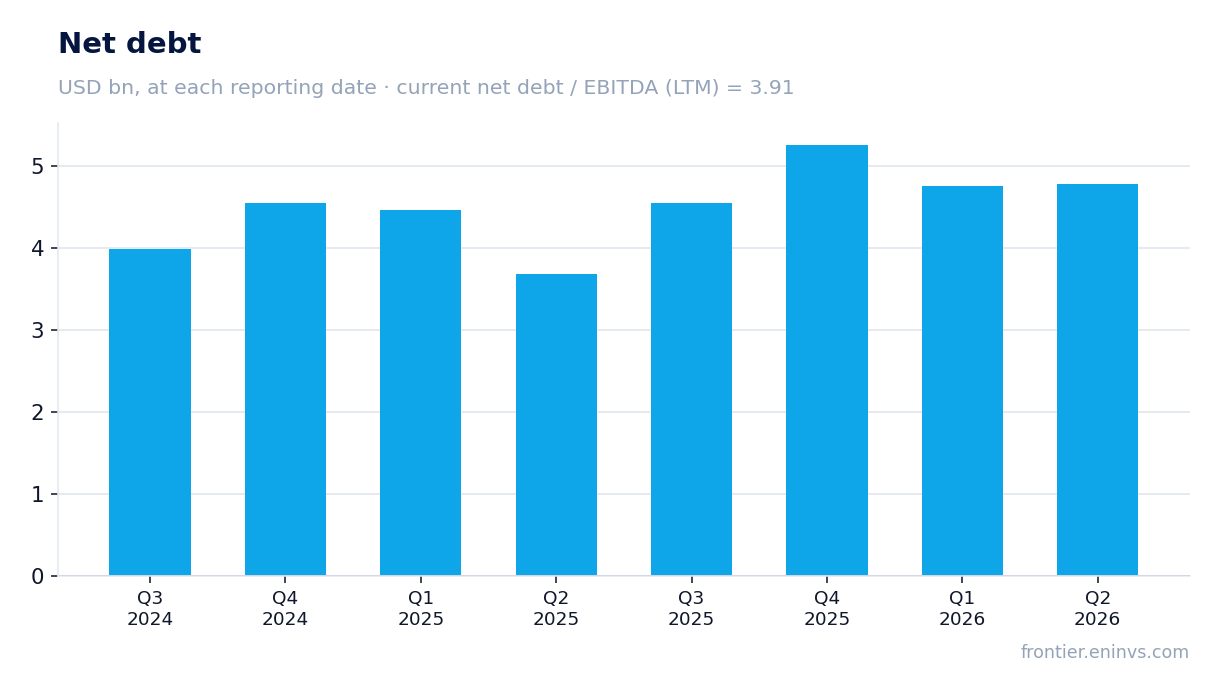
Leverage of 3.91x EBITDA consumes almost all of free cash flow
Net debt at the end of the second quarter of 2026 stood at $4,776 million, corresponding to a net debt to LTM EBITDA ratio of 3.91. That is a high level for a capital-intensive business with seasonal cash flow swings. For context, LTM EBITDA was $1,343.8 million.
Operating cash flow in the second quarter of 2026 was $399 million against $396 million a year earlier. However, for the first half of 2026 operating cash flow fell to $451 million from $466 million a year earlier. The main outflow came from a rise in receivables: they increased by $83 million in the half, versus $66 million a year earlier.
Capital expenditure in the second quarter of 2026 was $139 million, of which $63 million went to the Monticello engineered wood products facility. For the first half, capex reached $251 million against $200 million a year earlier. Free cash flow after capex and dividends remains under pressure.
Interest expense in the second quarter was $66 million, unchanged year on year. With operating cash flow of $399 million and capex of $139 million, free cash flow before dividends is about $260 million, while dividends require $152 million. The remaining $108 million is what is available for debt reduction, and at the current debt level that is clearly insufficient to bring leverage down quickly.
The $0.21 dividend at a 3.7% yield remains the main support for a holder
For the second quarter of 2026 Weyerhaeuser paid a dividend of $0.21 per share, unchanged from a year earlier. For the first half, the total paid was $0.42 per share. At the current share price, the trailing 12-month dividend yield is 3.7%. That is above the yield on ten-year US Treasuries, but only marginally.
Our estimate for the full-year 2026 dividend is $0.84 per share, assuming the quarterly payment stays at the current level. That corresponds to roughly 84% of LTM earnings per share, above the company's comfortable range. If one-off land sales are not repeated in the fourth quarter, dividend coverage from underlying earnings will be in question.
The company has already cut buybacks: in the second quarter of 2026 it spent $10 million on repurchases against $100 million a year earlier. For the first half, buybacks were $20 million against $125 million. This signals that free cash flow after dividends and capex cannot support both payouts and repurchases.
What could make the dividend smaller: a further fall in lumber and OSB prices, higher capex to complete the Monticello facility, and the need to direct more cash to debt reduction. With leverage at 3.91x EBITDA and interest expense of $66 million per quarter, the company may prefer to maintain the dividend but forgo any increase.
EV/EBITDA of 16.1 versus its own three-year average of 19.4 — a discount to history
The current LTM EV/EBITDA multiple is 16.1, while the company's own three-year average for this multiple is 19.4. The share trades below its historical valuation, which could indicate undervaluation if earnings are sustainable. However, the LTM P/E is 34.6, reflecting a low earnings base.
Market capitalisation at the time of the report was $16,336 million. With net debt of $4,776 million, enterprise value is about $21,112 million. If LTM EBITDA is $1,343.8 million, EV/EBITDA is indeed 16.1. For comparison, at the three-year average of 19.4 the market would value the company at roughly $26,000 million EV.
Our portal model values the share on current commodity prices and a target EV/EBITDA. On that model, the upside to fair value is -88%, meaning the share trades well above the valuation our model produces at current commodity prices. The gap reflects the model's assumption of lower lumber and OSB prices than current levels.
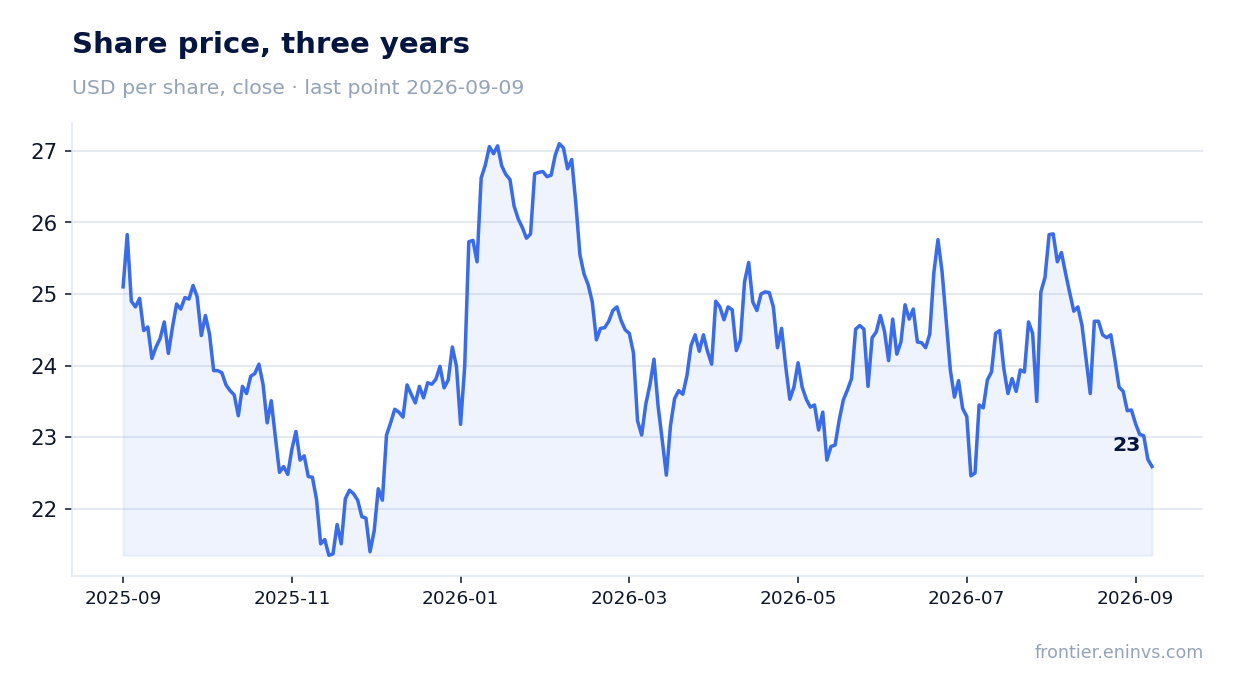
Since the report was published on 30 July, the share has fallen 7.6%, and on the day of the report it fell 3.9%. The market reacted to the quality of earnings: 86.2% net profit growth did not convince investors because it was driven by one-off land sales. With the price at $24.45 before the report and around $22.6 after, the discount to the three-year average EV/EBITDA persists.
Valuation on the latest reported figures
| Metric | Value |
|---|---|
| Market cap | 16.3 bn USD |
| P/E (LTM) | 34.6 |
| EV/EBITDA (LTM) | 16.1 |
| P/B | 1.73 |
| Net debt / EBITDA (LTM) | 3.91 |
| Operating cash flow (LTM) | 0.56 bn |
| ROE | 6.9% |
| Dividend yield (12m) | 3.7% |
| EV/EBITDA, 3-year average | 19.4 |
Bottom line
Bottom line: in the second quarter of 2026 Weyerhaeuser delivered 86.2% net profit growth, but almost all of it came from a $71 million timberland sale. The underlying timberland business, excluding one-offs, would have shown operating profit falling to $59 million from $88 million a year earlier. The strong point remains the Wood Products segment, where operating profit rose to $71 million from $46 million on lower cost of sales and G&A. The key question for a holder now is whether the company can sustain the $0.21 per share dividend with leverage at 3.91x EBITDA and falling revenue. The share trades at a discount to its own three-year average EV/EBITDA, but our portal model shows -88% upside, suggesting it is overvalued relative to current commodity prices.
Open the company's financial profile WY →
See also: market overview · valuation map · stock screeners