ID_BYAN: profit grows, but valuation is ahead — portal's model sees minus 22%

On August 25, ID_BYAN reported Q1 2026 results: revenue of $821.65 million, net profit of $190.791 million, and EBITDA of $244.794 million. At the current price, the shares look rather unattractive: multiples are above their own history, and the portal's model implies 22% downside.
Key takeaways
— Quarterly revenue of $821.65 million, backed by strong cash flow
— EBITDA margin of 30.3% – a result of operational efficiency, not one-offs
— Net profit of $190.791 million – almost entirely operational, without major one-off effects
— Operating cash flow of $215.842 million covers capex and dividends
— Dividend yield of 1.94% – modest but supported by cash flow
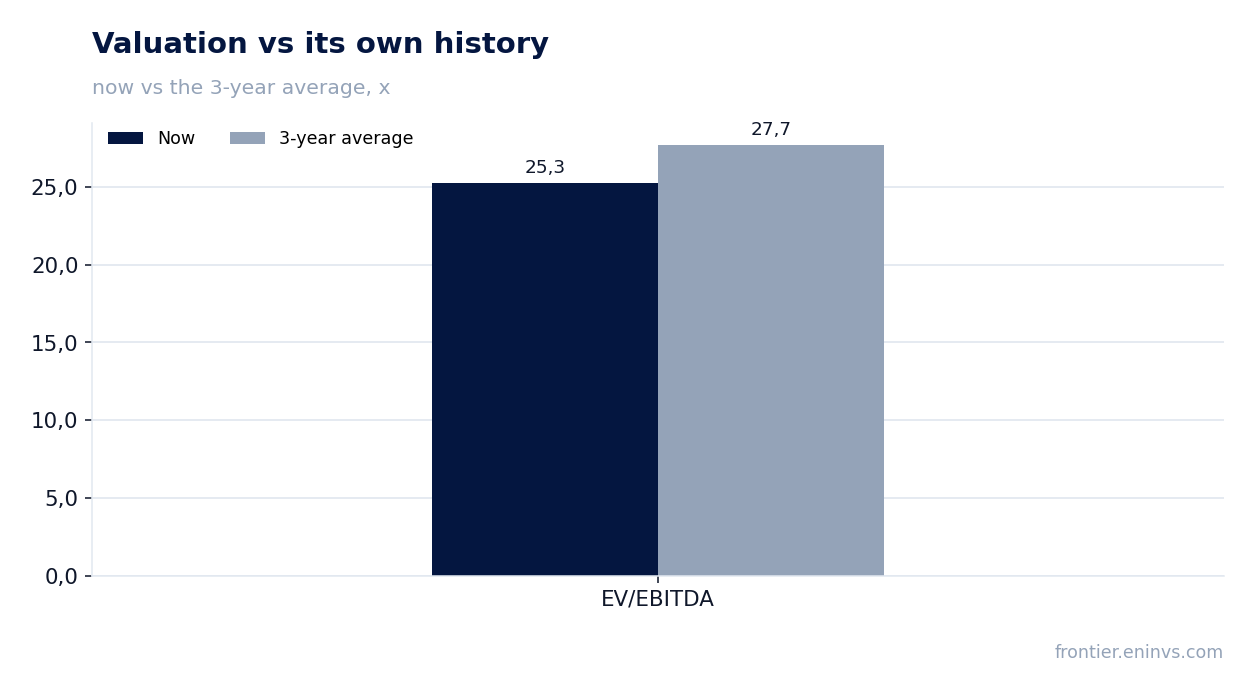
— Valuation: EV/EBITDA of 25.3 vs. 3-year average of 27.7 – expensive but not peak
— Portal's model implies fair value 22% below current price
Attractiveness
Key figures, USD bn
| Metric | — | Q1 2026 | Change |
|---|---|---|---|
| Revenue | — | 0.82 | — |
| EBITDA | — | 0.25 | — |
| Operating profit | — | 0.24 | — |
| Net profit | — | 0.19 | — |
| Operating cash flow | — | 0.22 | — |
| Capex | — | 0.05 | — |
| EBITDA margin | — | 30.3% | — |
| Net margin | — | 23.2% | — |
Quarterly revenue of $821.65 million, backed by strong cash flow
In Q1 2026, ID_BYAN's revenue reached $821.65 million. Over the trailing twelve months, revenue hit $3,400.0 million, confirming the business's resilience.
Operating cash flow for the quarter was $215.842 million, significantly above net profit, indicating high quality of earnings. This allows the company to fund investments and shareholder payouts without taking on debt.
EBITDA margin of 30.3% – a result of operational efficiency, not one-offs
Quarterly EBITDA was $244.794 million, implying a margin of 30.3%. Operating profit almost matches EBITDA at $244.292 million, meaning depreciation and impairment are minimal, with no major non-cash charges in costs.
Over the trailing twelve months, EBITDA reached $1,010.0 million, confirming stable high-level margins.
Net profit of $190.791 million – almost entirely operational, without major one-off effects
Net profit for the quarter was $190.791 million, implying a margin of 23.2%. The small gap between operating and net profit indicates no significant financial expenses or one-off items.
Over the trailing twelve months, net profit reached $768.0 million. Return on equity is 27.97%, indicating high capital efficiency.
Operating cash flow of $215.842 million covers capex and dividends
Operating cash flow for the quarter was $215.842 million, with capex of $50.576 million. Free cash flow after investments is about $165 million, comfortably covering dividend payments.
Net debt is negative: minus $727.564 million at quarter-end, meaning the company holds more cash than debt. Over the trailing twelve months, net debt decreased by $0.2 billion, but the net debt/EBITDA ratio stands at minus 0.57 – the company remains a net lender.
Dividend yield of 1.94% – modest but supported by cash flow
Over the trailing twelve months, the dividend yield was 1.94% based on the current market cap of $26,093.436 million. This is modest, but payments are backed by operating cash flow that significantly exceeds capex.
If the current policy and profit level are maintained, the company can pay dividends without harming investments. However, a yield below 2% is unlikely to attract income-focused investors.
Valuation: EV/EBITDA of 25.3 vs. 3-year average of 27.7 – expensive but not peak
The current EV/EBITDA multiple for the trailing twelve months is 25.3, below the three-year average of 27.7. This means the stock trades at a discount to its own history, but the absolute level remains high.
P/E for the trailing twelve months is 33.98, also indicating a premium valuation. At this price, the market prices in continued high growth, and any slowdown could trigger a correction.
Portal's model implies fair value 22% below current price
According to the portal's model, which re-prices EBITDA at current commodity prices and applies a target EV/EBITDA, the fair value of the share is 22% below the current market price. This implies the market has already priced in an optimistic scenario.
The portal's model is an internal estimate, not market consensus, but it serves as a guide for the margin of safety. With such downside potential, the shares do not look like an attractive buy.
Valuation on the latest reported figures
| Metric | Value |
|---|---|
| Market cap | 26.1 bn USD |
| P/E (LTM) | 34.0 |
| EV/EBITDA (LTM) | 25.3 |
| P/B | 11.28 |
| Net debt / EBITDA (LTM) | -0.57 |
| Operating cash flow (LTM) | 0.98 bn |
| ROE | 28.0% |
| Dividend yield (12m) | 1.9% |
| EV/EBITDA, 3-year average | 27.7 |
Bottom line
ID_BYAN delivered a strong quarter: high margins, solid cash flow, and negative net debt. However, the current price already reflects much of the good news: multiples are above historical averages, and the portal's model indicates 22% downside. The dividend yield is modest, and the stock's appeal lies in growth rather than income. Until valuation becomes more moderate, the shares look rather unattractive.
Open the company's financial profile BYAN →
See also: market overview · valuation map · stock screeners