ID_UNVR: profit up 26% on falling revenue – the margin is not coming from sales
UNVR →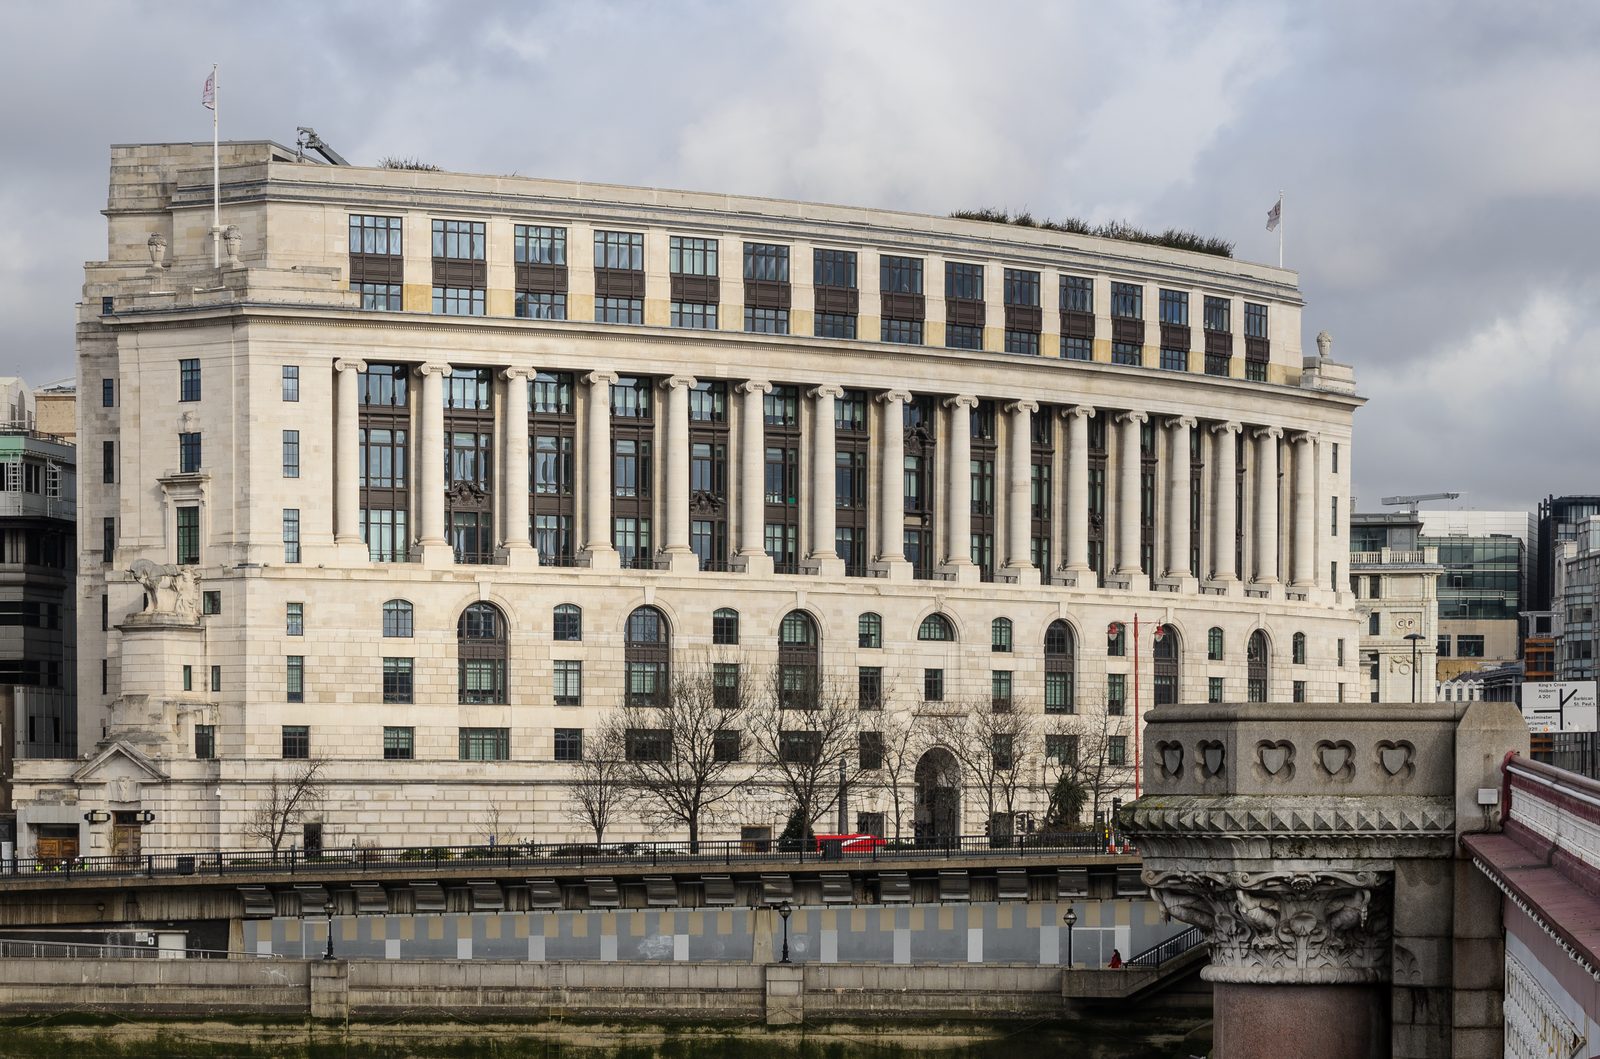
The report for the nine months to 30 September 2026 shows a split picture: revenue fell 6.7% year on year to IDR 25,751.5m, while net profit rose 26.0% to IDR 4,201.1m. The net margin climbed to 16.3% from 12.1% a year earlier, even as standalone first-quarter 2026 revenue dropped 10.8% year on year. With a trailing P/E of 6.3 and a dividend yield of 14.2% the stock looks attractive on income, but the portal's model implies only -1% to fair value, so the verdict is neutral.
Key takeaways
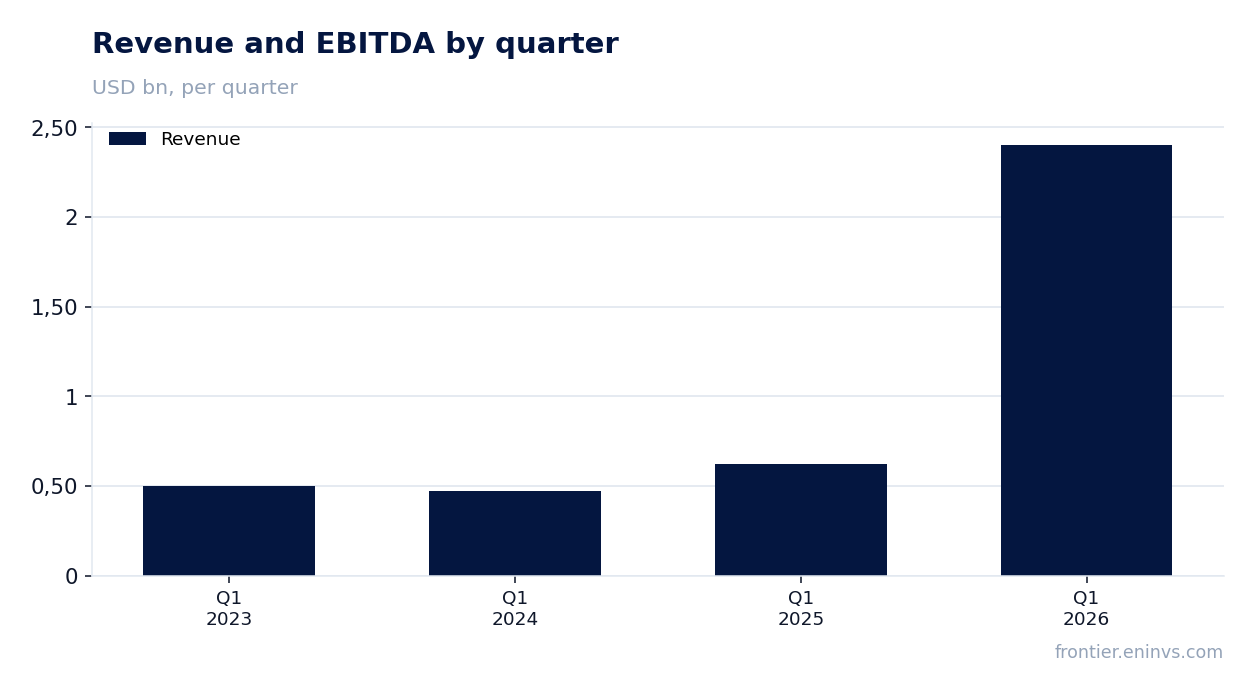
— Nine-month revenue fell 6.7%, and the first-quarter decline was deeper at 10.8%
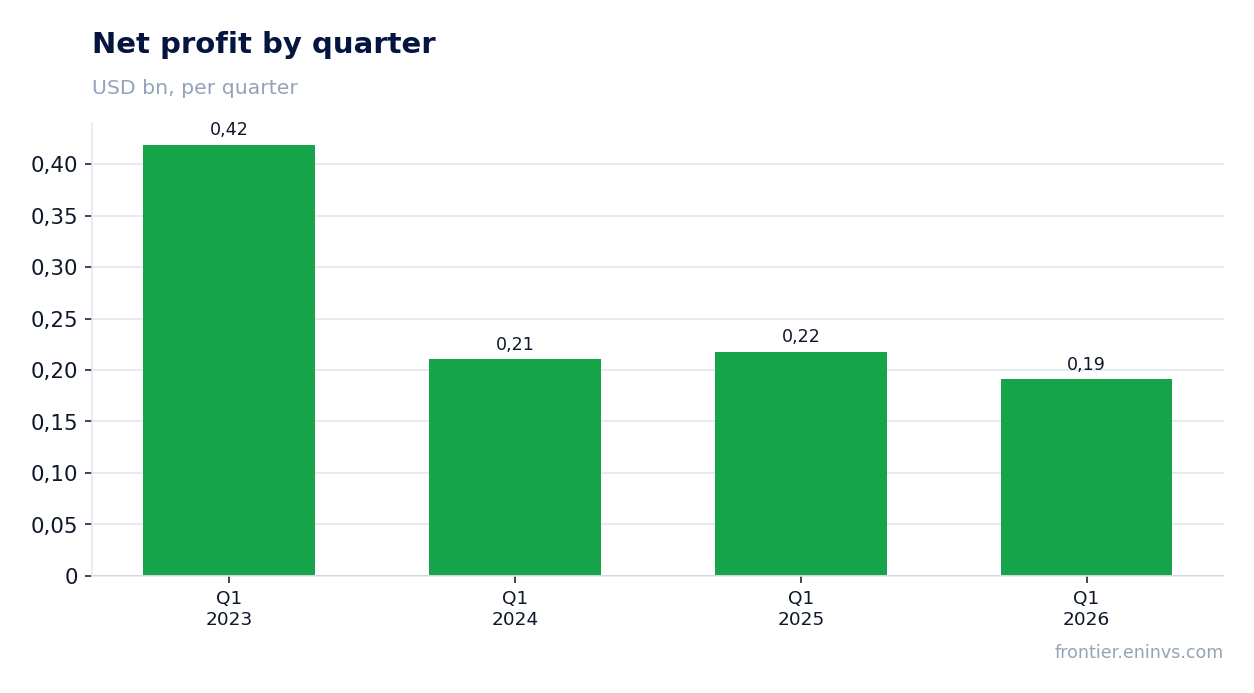
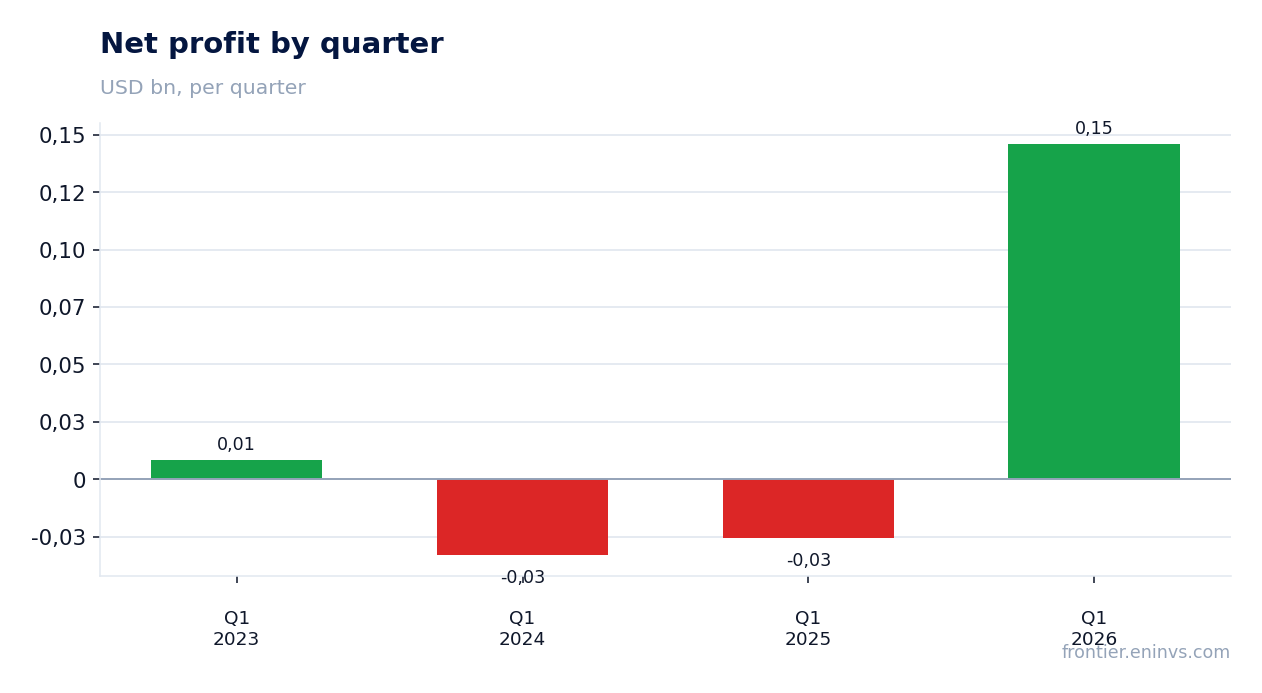
— Net profit rose 26.0% on falling revenue, lifting the margin to 16.3% from 12.1%
— Nine-month operating cash flow was IDR 1,863.1m, with first-quarter capex of IDR 263.6m
— Net debt at 30 September 2026 was negative at minus IDR 1,463.6m – the company holds more cash than debt
— The trailing twelve-month dividend yield is 14.2%, well above the yield we consider fair for this profile
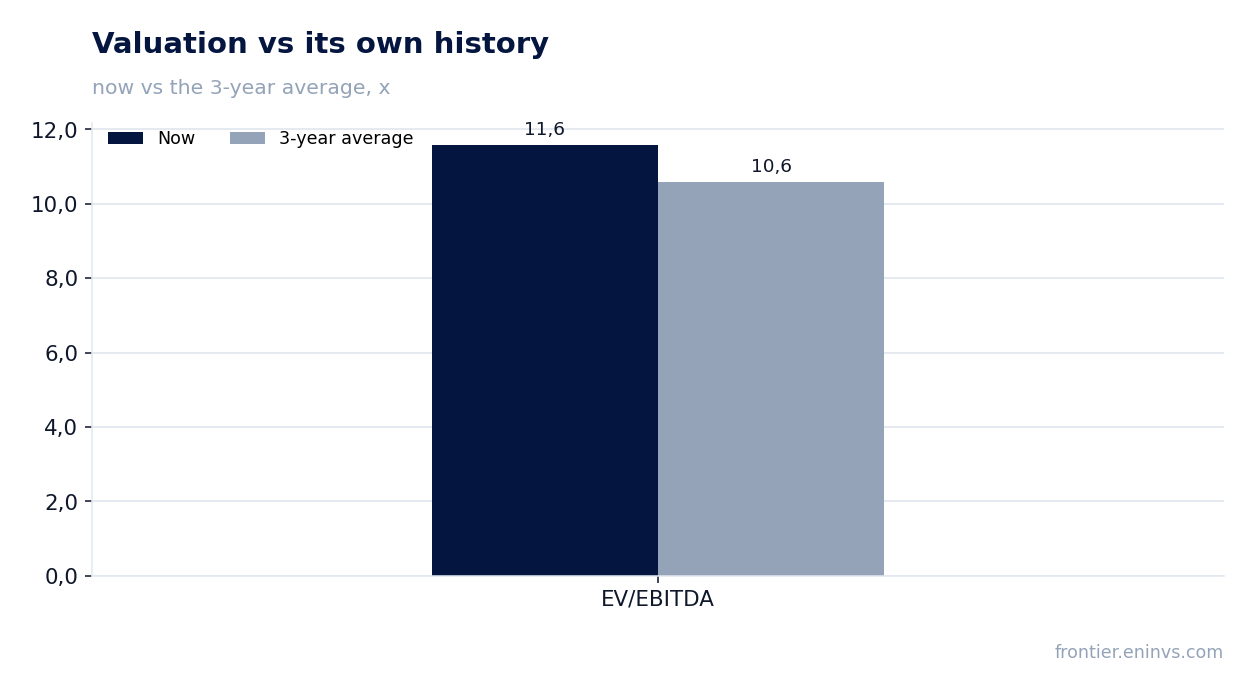
— Trailing P/E is 6.3 and EV/EBITDA is 11.1, while the portal's model implies -1% to fair value
Attractiveness
Key figures, IDR bn
| Metric | 9M 2025 | 9M 2026 | Change |
|---|---|---|---|
| Revenue | 27.6 | 25.8 | -6.7% |
| EBITDA | 5.13 | — | — |
| Operating profit | 4.45 | — | — |
| Net profit | 3.34 | 4.20 | +26.0% |
| Operating cash flow | 3.21 | 1.86 | -41.9% |
| Capex | 0.39 | — | — |
| EBITDA margin | 18.6% | — | — |
| Net margin | 12.1% | 16.3% | +4.2 pp |
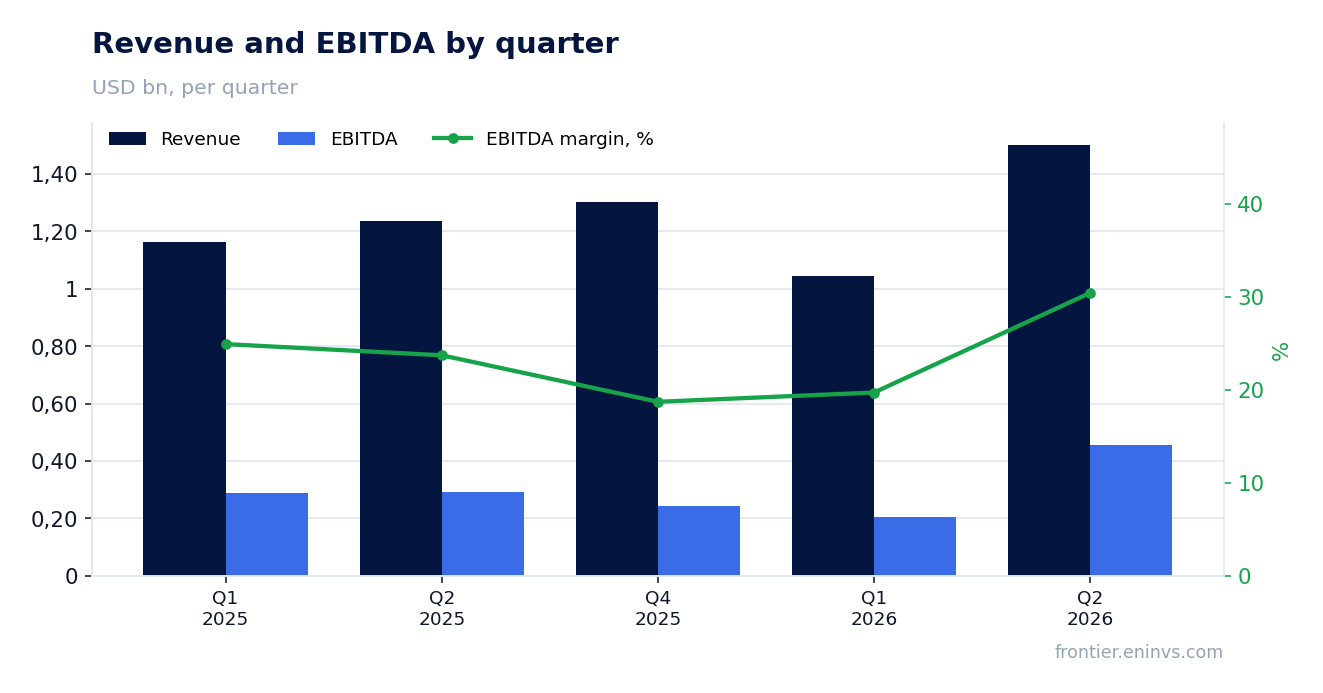
Nine-month revenue fell 6.7%, and the first-quarter decline was deeper at 10.8%
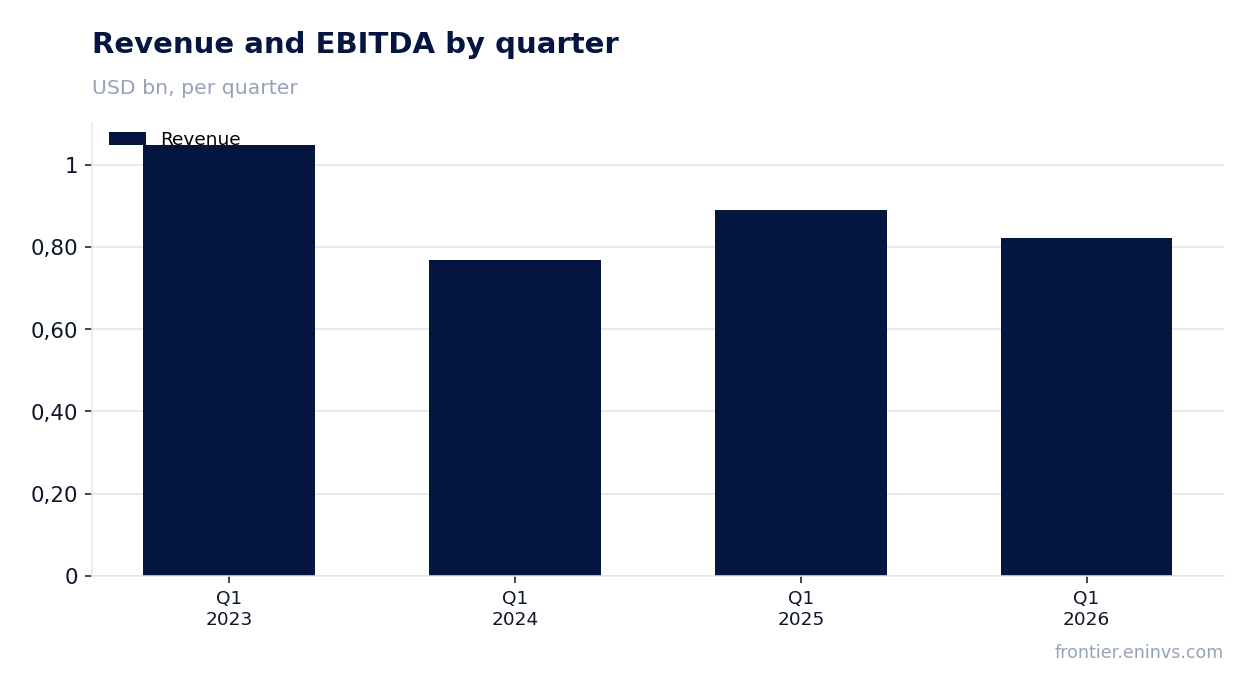
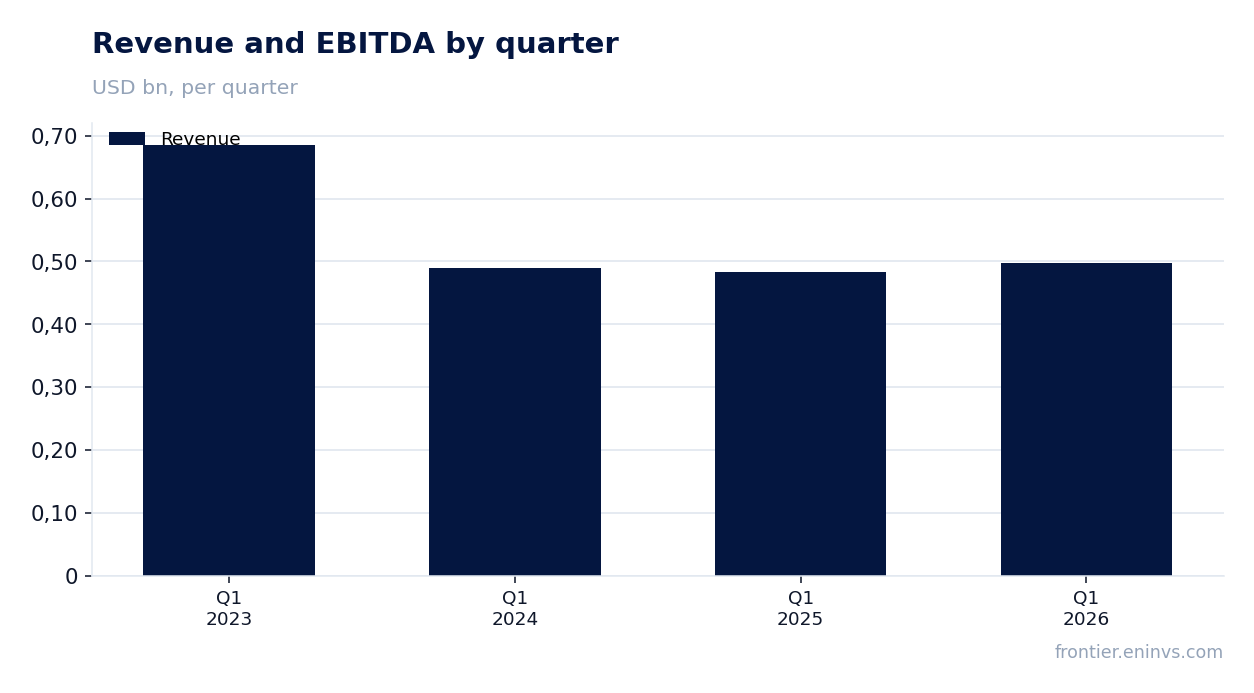
Nine-month 2026 revenue was IDR 25,751.5m against IDR 27,600.6m a year earlier, a decline of 6.7%. This is not a one-month dip: standalone first-quarter 2026 revenue fell 10.8% year on year to IDR 8,442.6m, setting the tone for the whole period.
The quarterly dynamic matters more than the cumulative figure: the first quarter saw a double-digit decline, and later months only partly smoothed it. The facts do not disclose the cause, so we record the fact itself: sales are shrinking, and that is the main constraint on the growth story.
For a holder this means next period's profit will have to be defended through costs and one-offs rather than through revenue. While revenue falls, any profit growth rests on the quality of expenses, not on the scale of the business.
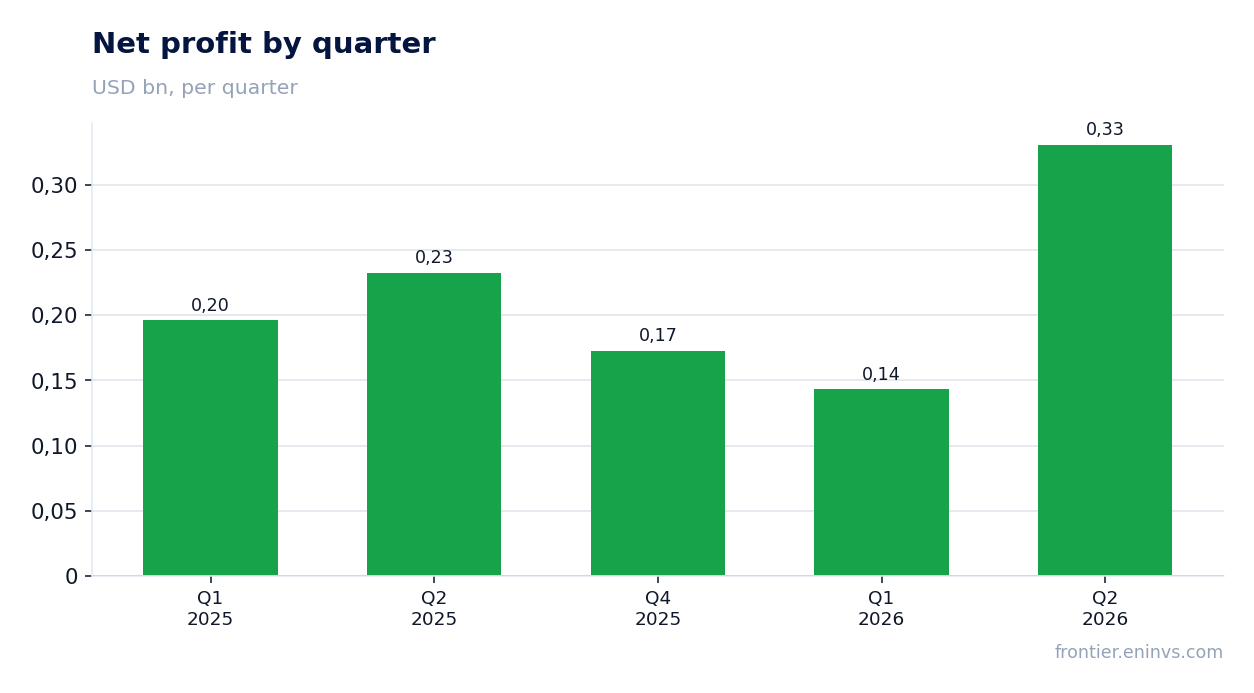
Net profit rose 26.0% on falling revenue, lifting the margin to 16.3% from 12.1%
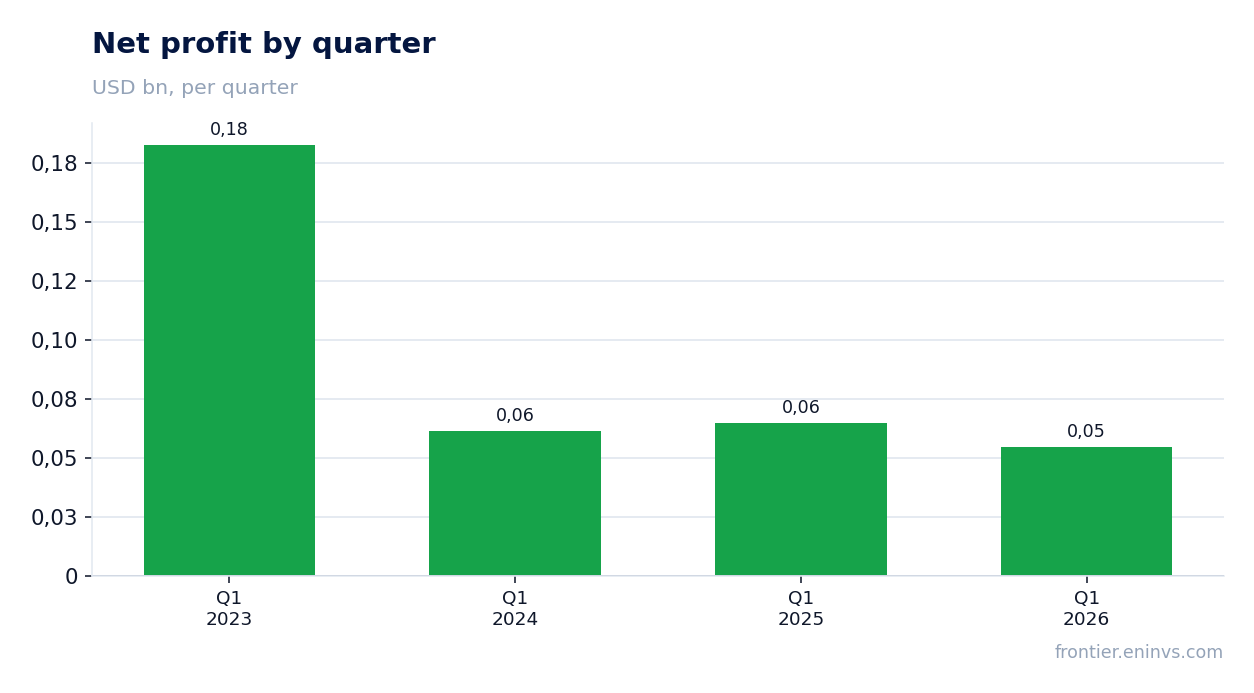
Nine-month 2026 net profit was IDR 4,201.1m, up 26.0% year on year. The net margin rose to 16.3% from 12.1%, meaning the company earns more per unit of sales even as sales shrink.
Such a gap between revenue and profit usually means either a non-operating item inside profit or that costs were cut faster than revenue. The facts give no line-by-line breakdown, so we do not name a specific cause – we record that profit growth is not supported by sales growth.
The next report matters for judging profit quality: if the 16.3% margin holds without one-offs, that is a strong argument for the stock. If the profit boost was one-off, a return of the margin to 12.1% would quickly erase the effect.
Nine-month operating cash flow was IDR 1,863.1m, with first-quarter capex of IDR 263.6m
Nine-month 2026 operating cash flow was IDR 1,863.1m – positive, but well below net profit of IDR 4,201.1m. The gap means part of the profit did not turn into cash during the period, limiting freedom on payouts and investment.
In standalone first-quarter 2026 the operating flow was negative at minus IDR 753.5m, while capex was IDR 263.6m. The company thus started the year with a cash outflow, and the positive nine-month result was earned in the second and third quarters.
This is the key point for the dividend story: payouts over the last twelve months were funded not only by current cash flow but also by accumulated cash. While net debt is negative there is a buffer, but the sustainability of payouts depends on quarterly cash flow returning to positive territory.
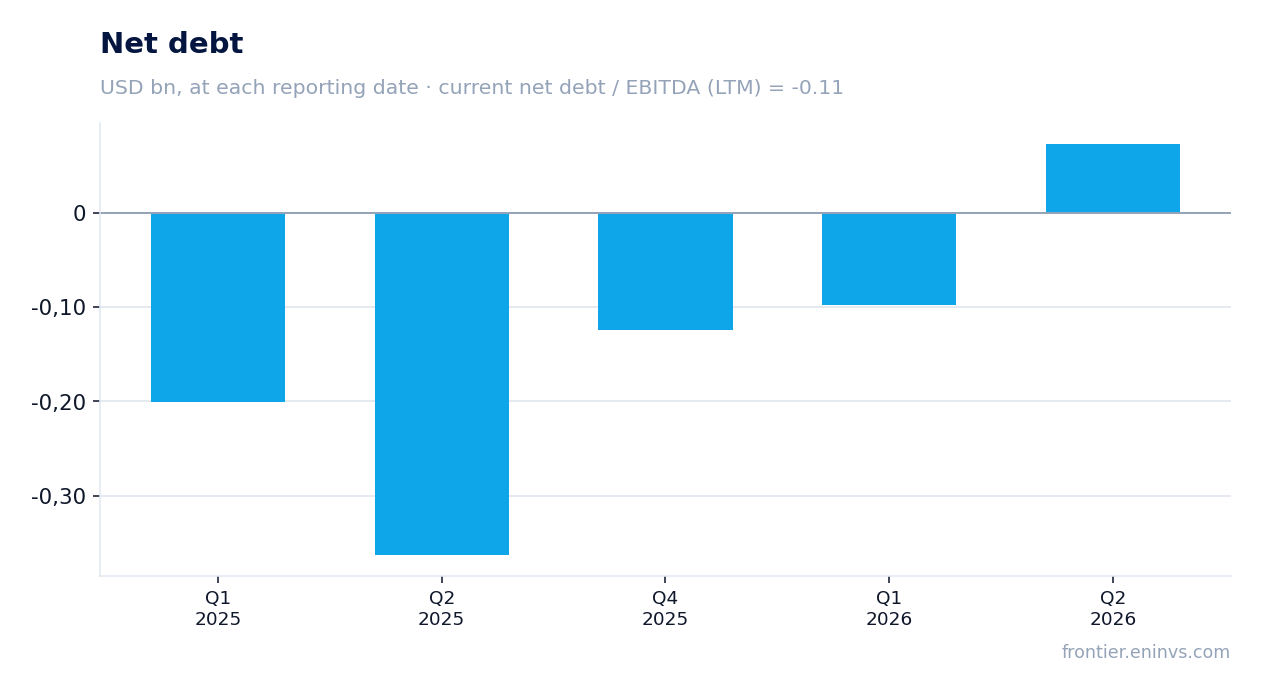
Net debt at 30 September 2026 was negative at minus IDR 1,463.6m – the company holds more cash than debt
At 30 September 2026 net debt was minus IDR 1,463.6m: cash on the balance sheet exceeds debt obligations. A year earlier, at 30 September 2025, net debt was positive at IDR 0.7m, so over twelve months the figure moved by minus IDR 2.2m.
The move within the year also favours the company: from minus IDR 1.2m at 30 June 2026 to minus IDR 1.5m at 30 September, a change of minus IDR 0.3m. The company keeps accumulating cash rather than spending it.
The net debt to EBITDA ratio over the last twelve months is negative and close to zero. Such a debt level creates no risk to payouts and provides a buffer for a weak quarter, but by itself it is not a profit driver.
The trailing twelve-month dividend yield is 14.2%, well above the yield we consider fair for this profile
The trailing twelve-month dividend yield is 14.2%, a high figure for a company with falling revenue. Last year's payouts relied on profit and accumulated cash, not only on current cash flow, so the yield reflects generosity of distribution rather than sustainable business growth.
Our estimate for the current year's dividend rests on nine-month profit of IDR 4,201.1m and on the payout ratio being maintained. If the company keeps payouts at last year's level, the yield stays in double digits, but its sustainability depends on the 16.3% margin holding without one-offs.
What could reduce the payout: a return of the margin to 12.1%, negative operating cash flow in a standalone quarter as in first-quarter 2026, or higher capex. With negative net debt there is a buffer, but the dividend is the first thing to suffer if cash flow deteriorates.
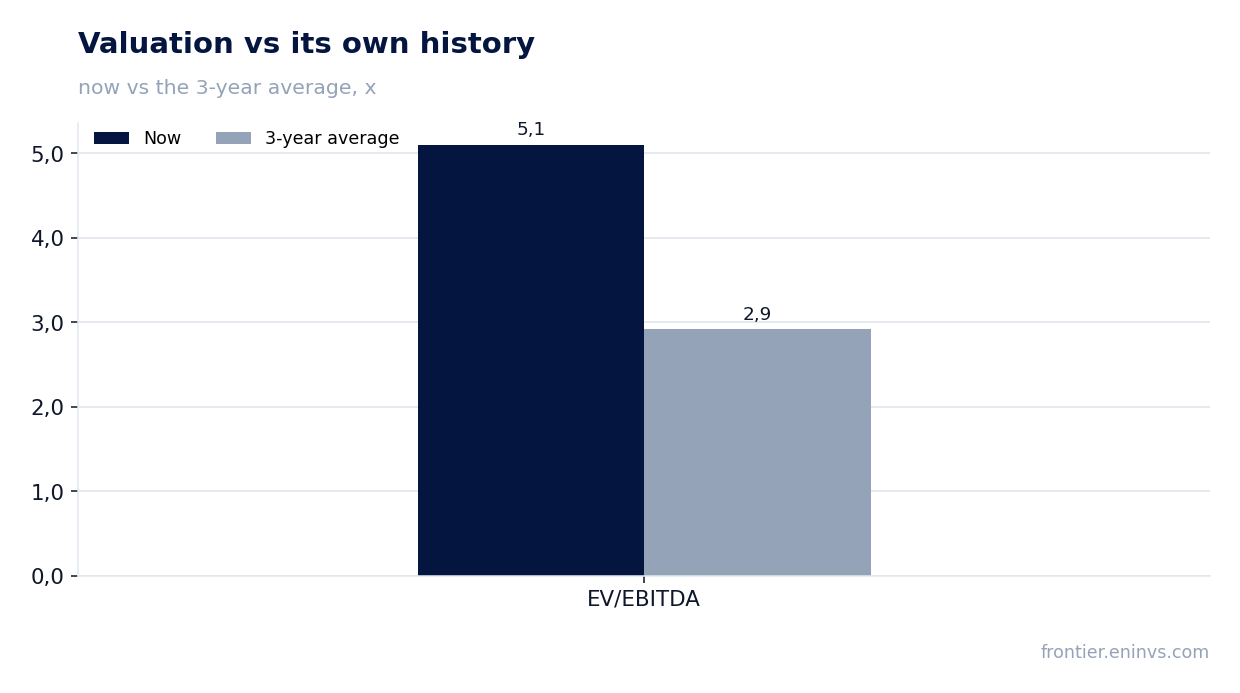
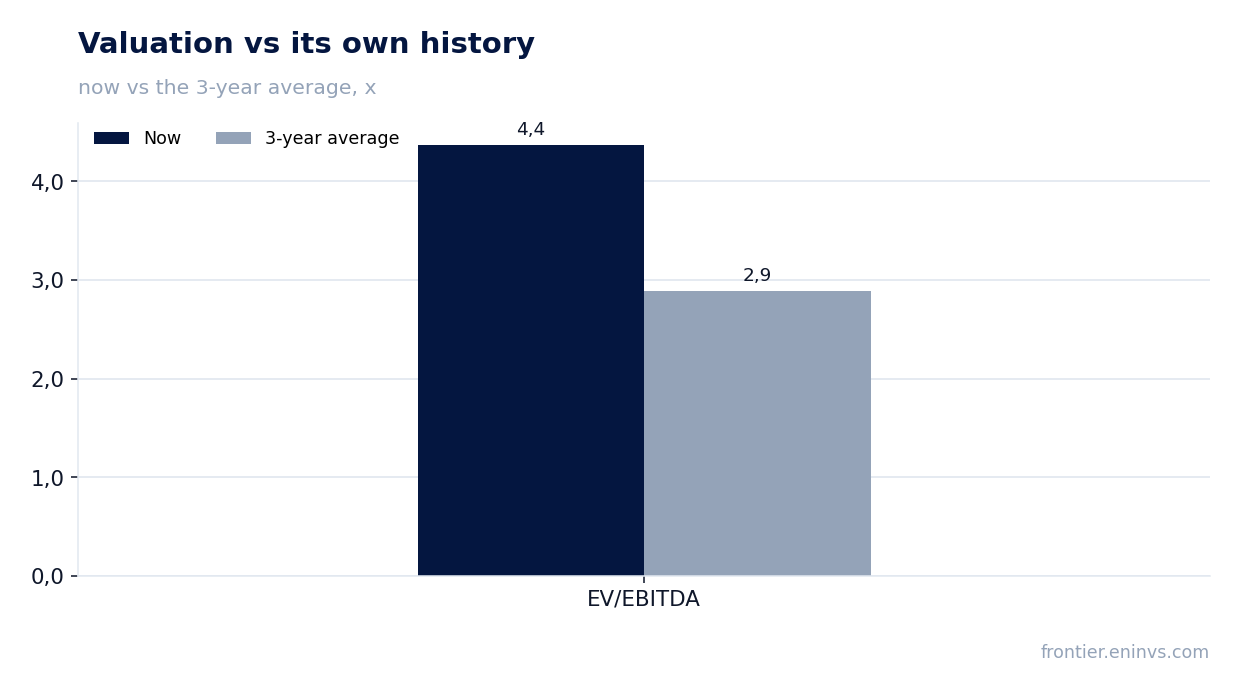
Trailing P/E is 6.3 and EV/EBITDA is 11.1, while the portal's model implies -1% to fair value
The multiples diverge: trailing P/E is 6.3, cheap for the market, while EV/EBITDA is 11.1, no longer low. The gap is explained by capital structure: with negative net debt and a large cash balance, EV is below market cap, so P/E and EV/EBITDA give different signals.
The portal's model, which compares EBITDA growth with the target multiple and market cap, implies -1% to fair value. This is our own estimate, not a market consensus, and it says the current price already reflects the available return.
For a holder this means upside in the price is limited, and the main return comes through the dividend. If profit holds at the nine-month level, P/E stays low, but if the margin returns to 12.1%, profit falls and the multiple rises without any change in price.
Valuation on the latest reported figures
| Metric | Value |
|---|---|
| Market cap | 53 743 bn IDR |
| P/E (LTM) | 6.3 |
| EV/EBITDA (LTM) | 11.1 |
| P/B | 12.01 |
| Net debt / EBITDA (LTM) | -0.00 |
| Operating cash flow (LTM) | 4.45 bn |
| ROE | 155.0% |
| Dividend yield (12m) | 14.2% |
Bottom line
The balance sheet remains the strong point: net debt is negative at minus IDR 1,463.6m and the company keeps accumulating cash. Profit rose 26.0%, but with revenue falling 6.7% over nine months that growth rests on the 16.3% margin rather than on sales, and its durability is unconfirmed. The 14.2% dividend yield remains the main argument for a holder, but it rests on profit that may prove one-off. The verdict is neutral: the yield is attractive, but the portal's model implies -1% to fair value, and falling revenue prevents calling the stock outright attractive.