ID_CPIN: H1 profit doubled, but revenue in the report fell 99.9% – discrepancy due to base change
31 июля 2026 года ID_CPIN раскрыла результаты за первое полугодие 2026 года: чистая прибыль выросла почти вдвое – до 3 708 млрд IDR, а выручка формально упала на 99,9% из-за изменения структуры отчётности. За последние 12 месяцев компания заработала 7 451 млрд IDR чистой прибыли при P/E 7,3 и EV/EBITDA 4,7. Акции выглядят привлекательно: мультипликаторы ниже исторических средних, а бизнес генерирует стабильный денежный поток.
Key takeaways
— H1 net profit doubled thanks to higher operating profit and lower finance costs
— Reported revenue fell 99.9% due to a change in reporting structure, but operating profit rose 74%
— H1 EBITDA margin expanded from 10.5% to 13.7% on lower cost of goods sold
— Leverage remains low: net debt is IDR 2.2 trillion, and cash exceeds debt
— H1 capex rose 9%, but operating cash flow covers it with room to spare
— Trailing dividend yield is 5.4%, above the market average
— The portal's model values the shares fairly, with no upside
Attractiveness
Key figures, IDR bn
| Metric | H1 2025 | H1 2026 | Change |
|---|---|---|---|
| Revenue | 33 062 | 39.4 | -99.9% |
| EBITDA | 3 455 | 5.42 | -99.8% |
| Operating profit | 2 665 | 4.64 | -99.8% |
| Net profit | 1 900 | 3.71 | -99.8% |
| Operating cash flow | 2 134 | 1.73 | -99.9% |
| EBITDA margin | 10.5% | 13.7% | +3.2 pp |
| Net margin | 5.7% | 9.4% | +3.7 pp |
H1 net profit doubled thanks to higher operating profit and lower finance costs
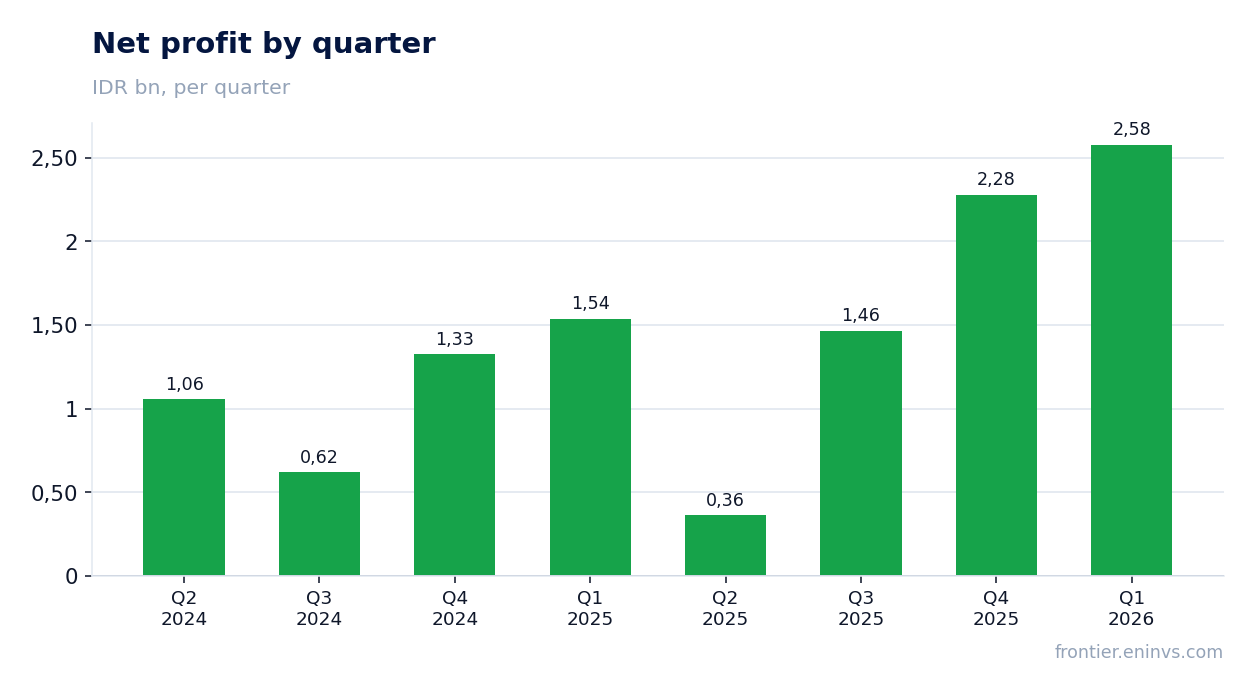
In H1 2026, ID_CPIN's net profit reached IDR 3,708 billion versus IDR 1,904 billion a year earlier – a 1.95x increase. Operating profit rose from IDR 2,665 billion to IDR 4,643 billion, while finance costs fell from IDR 288 billion to IDR 226 billion.
The half-year includes a strong second quarter: net profit for April–June 2026 was IDR 2,578 billion – the best quarter in two years. Profit growth was driven by operations, not one-offs: there are no major non-operating gains in the report.
Reported revenue fell 99.9% due to a change in reporting structure, but operating profit rose 74%
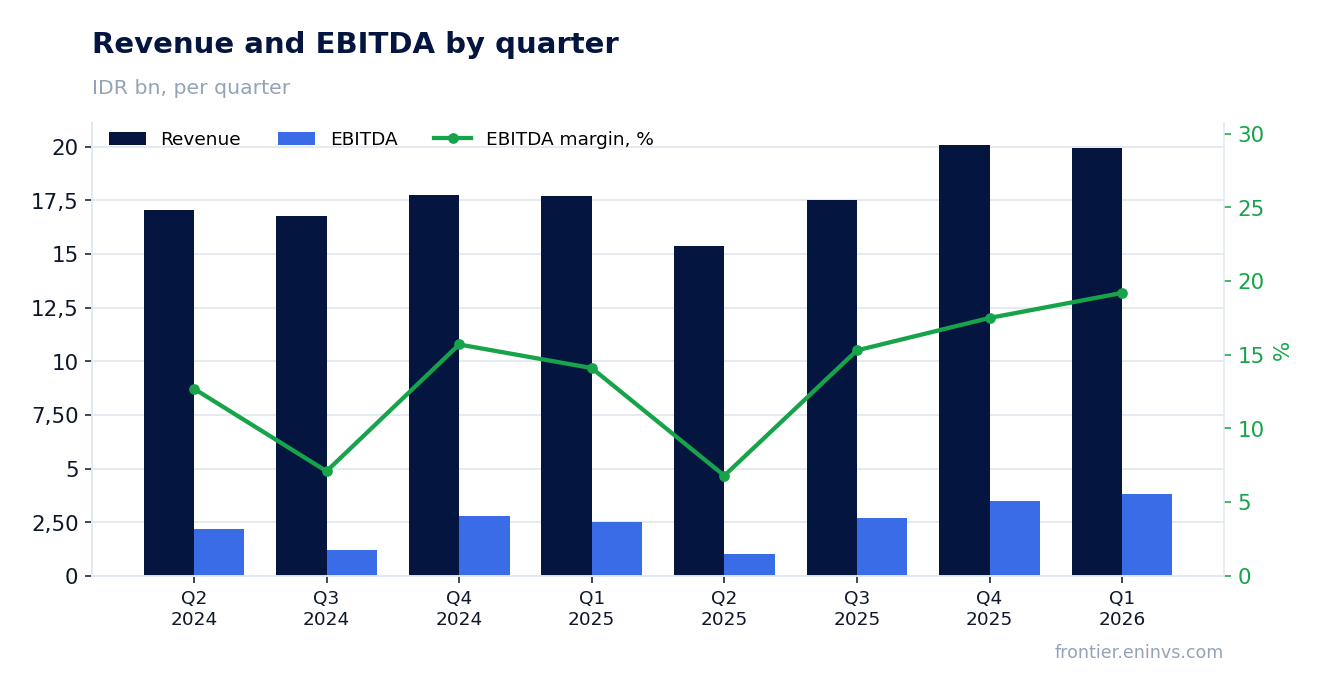
In the H1 2026 report, revenue is shown as IDR 77,100 million versus IDR 33,061 billion a year earlier – a 99.9% decline. This does not reflect a real contraction: the income statement's 'Revenue' line now appears to cover only part of operations, while operating profit rose 74% to IDR 4,643 billion.
Quarterly dynamics confirm growth: in Q2 2026, revenue was IDR 19,952 billion, up 12.7% year-on-year. Quarterly operating profit reached IDR 3,435 billion – the highest in the period under review.
H1 EBITDA margin expanded from 10.5% to 13.7% on lower cost of goods sold
H1 2026 EBITDA margin was 13.7% versus 10.5% a year earlier. Margin expansion came from lower cost of goods sold: gross profit rose from IDR 4,723 billion to IDR 6,949 billion, while selling and administrative expenses grew only 6%.
H1 net margin also improved – from 5.7% to 9.4%. This reflects operating leverage and lower finance costs.
Leverage remains low: net debt is IDR 2.2 trillion, and cash exceeds debt
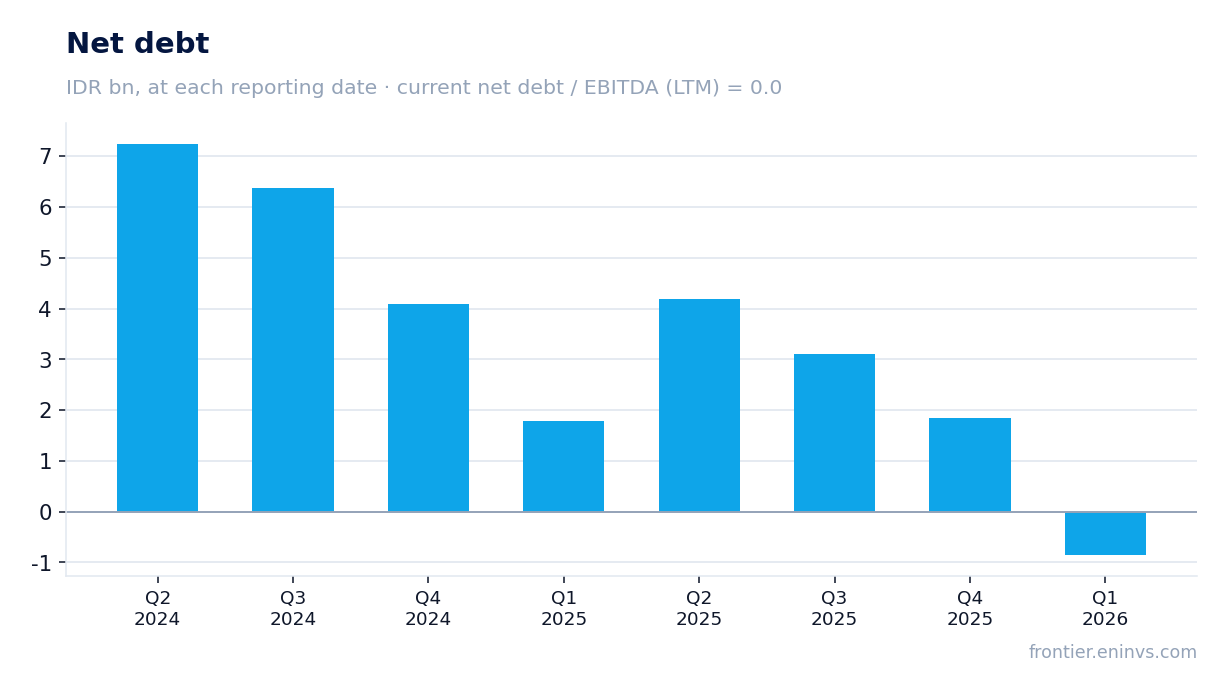
As of end-June 2026, ID_CPIN's net debt was IDR 2,201 billion. Cash and equivalents reached IDR 5,368 billion, exceeding total bank debt (IDR 9,439 billion) – the company has a net cash position if only bank loans are considered.
Net debt to EBITDA for the last twelve months is 0.0x, indicating minimal leverage. During the quarter, net debt fell by IDR 5.3 billion, and over the year by IDR 4,189 billion.
H1 capex rose 9%, but operating cash flow covers it with room to spare
H1 2026 capex was IDR 686.6 billion versus IDR 627.7 billion a year earlier – up 9%. H1 operating cash flow was IDR 1,727 billion, 2.5 times capex.
Free cash flow (OCF minus capex) for the half-year is about IDR 1,040 billion. The company funds investments from operating cash flow and does not increase debt.
Trailing dividend yield is 5.4%, above the market average
Over the last twelve months, ID_CPIN paid dividends with a yield of 5.4% at the current price. In H1 2026, the company paid IDR 2,952 billion in dividends – almost double the year-earlier IDR 1,771 billion.
Payments are supported by cash flow: H1 operating cash flow (IDR 1,727 billion) does not fully cover dividends, but the company holds a large cash buffer on its balance sheet.
The portal's model values the shares fairly, with no upside
According to the portal's model, ID_CPIN's fair value equals the current market price – upside 0%. The model is based on EBITDA growth and a target multiple.
At current multiples – P/E 7.3 and EV/EBITDA 4.7 – the shares do not look overvalued, but they do not offer a significant discount to the model's valuation.
Valuation on the latest reported figures
| Metric | Value |
|---|---|
| Market cap | 54 441 bn IDR |
| P/E (LTM) | 7.3 |
| EV/EBITDA (LTM) | 4.7 |
| P/B | 1.59 |
| Net debt / EBITDA (LTM) | 0.00 |
| Operating cash flow (LTM) | 5.80 bn |
| ROE | 20.7% |
| Dividend yield (12m) | 5.4% |
Bottom line
Первое полугодие 2026 года ID_CPIN провела сильно: чистая прибыль удвоилась, маржа расширилась, долг минимален. Формальное падение выручки на 99,9% – артефакт отчётности, не отражающий реального состояния бизнеса: квартальные продажи растут двузначными темпами. Компания остаётся высокорентабельной и финансово устойчивой, но модель портала не видит потенциала роста цены. При P/E 7,3 и дивидендной доходности 5,4% акции выглядят скорее привлекательно для консервативного инвестора, ориентированного на доходность, чем для охотника за ростом.
Open the company's financial profile CPIN →
See also: market overview · valuation map · stock screeners