ID_ITMG: Q1 2026 net profit up, but the focus is on free cash flow and dividends
Компания ID_ITMG раскрыла результаты за первый квартал 2026 года: выручка составила 497,6 млн долл., EBITDA – 82,9 млн, чистая прибыль – 54,7 млн. При текущей цене акции торгуются с P/E 8,7 и EV/EBITDA 3,3, что ниже собственных трехлетних средних, а дивидендная доходность за 12 месяцев – 6,5%. Вердикт: акции выглядят привлекательно – оценка умеренная, баланс крепкий, а денежный поток поддерживает дивиденды.
Key takeaways
— Q1 2026 revenue rose to $497.6 million, EBITDA margin at 18.0%
— Q1 2026 net profit of $54.7 million, net margin of 11.0%
— Operating cash flow for the quarter was $65.3 million, capex $12.2 million
— Net debt negative: minus $719.3 million, net debt/EBITDA LTM at minus 2.49
— Trailing 12-month dividend yield of 6.5%, above the three-year average yield
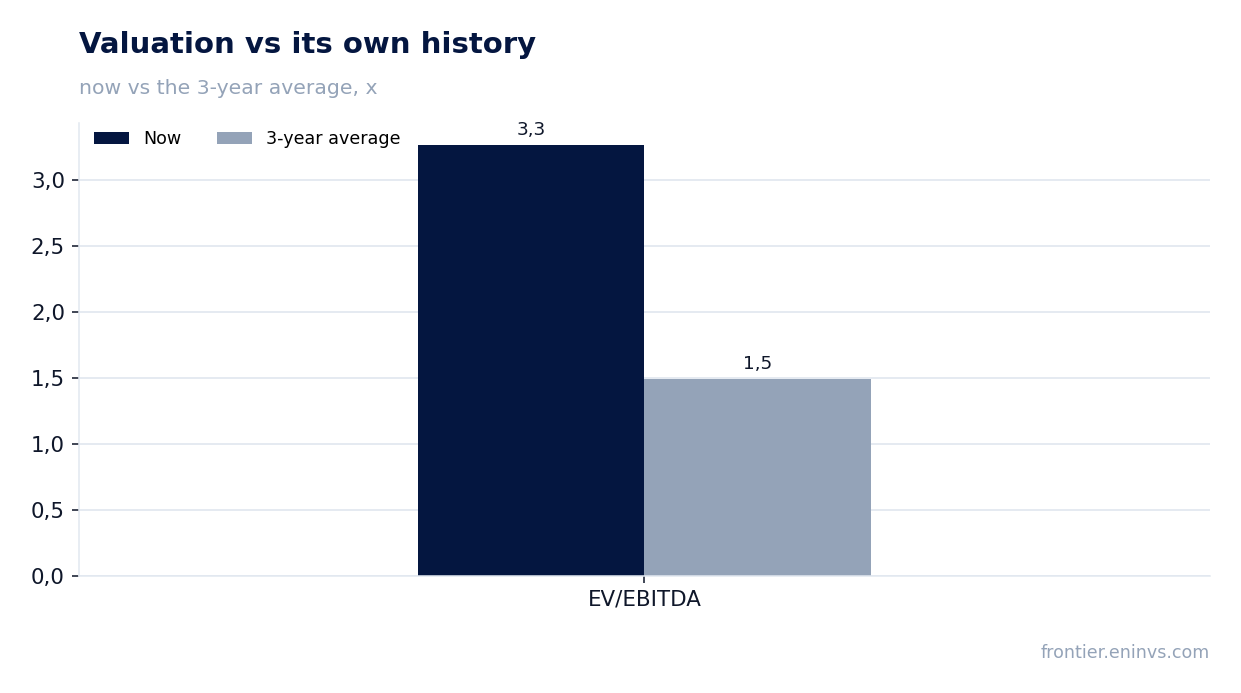
— Shares trade at P/E of 8.7 and EV/EBITDA of 3.3 versus the three-year average of 1.5 (for EV/EBITDA)
— On the portal's model, upside potential to share price is 15%
Attractiveness
Key figures, USD bn
| Metric | — | Q1 2026 | Change |
|---|---|---|---|
| Revenue | — | 0.50 | — |
| EBITDA | — | 0.09 | — |
| Operating profit | — | 0.08 | — |
| Net profit | — | 0.05 | — |
| Operating cash flow | — | 0.07 | — |
| Capex | — | 0.01 | — |
| EBITDA margin | — | 18.0% | — |
| Net margin | — | 11.0% | — |
Q1 2026 revenue rose to $497.6 million, EBITDA margin at 18.0%
In the first quarter of 2026, revenue reached $497.6 million, generating EBITDA of $82.9 million. The EBITDA margin stood at 18.0% – a level the company maintains amid the current market environment.
The revenue growth, judging by the dynamics, is linked to higher sales volumes and product prices. However, the exact drivers are not disclosed in the report, so we limit ourselves to stating the fact.
Q1 2026 net profit of $54.7 million, net margin of 11.0%
Net profit for the first quarter was $54.7 million, corresponding to a net margin of 11.0%. This figure reflects operational efficiency after all expenses, including taxes and interest.
The quarterly profit appears sustainable, with no obvious one-off factors that could distort the picture. However, a full assessment requires seeing the year-on-year dynamics.
Operating cash flow for the quarter was $65.3 million, capex $12.2 million
Operating cash flow in the first quarter was $65.3 million, exceeding net profit – a good sign of earnings quality. Capital expenditures were moderate at $12.2 million, leaving substantial free cash flow.
Free cash flow (OCF minus capex) is roughly $53.1 million for the quarter. This is the resource from which the company finances dividends and debt repayment, if any.
Net debt negative: minus $719.3 million, net debt/EBITDA LTM at minus 2.49
As of the latest balance sheet date, net debt is negative – minus $719.3 million, meaning cash exceeds debt. The net debt/EBITDA ratio for the trailing twelve months is minus 2.49 – a level indicating financial independence.
Importantly, over the last 12 months net debt changed slightly: an increase of 0.2 billion RUB (about $2 million in dollar terms), which does not alter the overall picture. The company maintains strong liquidity.
Trailing 12-month dividend yield of 6.5%, above the three-year average yield
Over the last 12 months, the company paid dividends providing a yield of 6.5% at the current price. This is above the three-year average dividend yield, making the stock attractive for income-oriented investors.
Our dividend forecast for the current year is based on cash flow and company policy. If operating performance and moderate capex persist, the dividend could be no lower than last year's. However, the final amount will depend on the board's decision and potential one-off expenses.
Shares trade at P/E of 8.7 and EV/EBITDA of 3.3 versus the three-year average of 1.5 (for EV/EBITDA)
Current market capitalization is $1,663.7 million, giving a trailing P/E of 8.7 and EV/EBITDA of 3.3. These multiples are notably lower than the three-year average for EV/EBITDA (1.5), indicating undervaluation relative to its own history.
However, it should be noted that the three-year average may have been skewed by higher profits in past periods. Nevertheless, current levels look conservative, especially given the negative net debt.
On the portal's model, upside potential to share price is 15%
According to our own model, which reprices EBITDA at current commodity prices and applies a target EV/EBITDA multiple, the fair value of the share is 15% above the current market price. This is our calculation, not market consensus.
The model assumes that if the current environment and business efficiency persist, the market will eventually reprice the stock upward. However, realizing this potential depends on stable product prices and the company's ability to maintain margins.
Valuation on the latest reported figures
| Metric | Value |
|---|---|
| Market cap | 1.66 bn USD |
| P/E (LTM) | 8.7 |
| EV/EBITDA (LTM) | 3.3 |
| P/B | 0.87 |
| Net debt / EBITDA (LTM) | -2.49 |
| Operating cash flow (LTM) | 0.29 bn |
| ROE | 11.4% |
| Dividend yield (12m) | 6.5% |
| EV/EBITDA, 3-year average | 1.5 |
Bottom line
In the reported quarter, the company demonstrated solid operational performance: revenue and profit are at healthy levels, and operating cash flow exceeds net profit. The financial position is strong – net debt is negative, reducing risks. Dividend yield is above the three-year average, and the stock valuation is below its own historical levels. According to the portal's model, upside potential is 15%. Overall, the shares look attractive for a long-term investor, but the key factor remains the dynamics of product prices and the company's ability to maintain margins.
Open the company's financial profile ITMG →
See also: market overview · valuation map · stock screeners