ID_PGAS: revenue declines, profit supported by one-offs and low base

On May 15, 2026, ID_PGAS reported Q1 2026 results: revenue declined 3.8% YoY to $929.6 million, EBITDA fell 27.4%, while net profit rose 0.3% to $90.4 million. At the current price, the share looks rather attractive: P/E LTM of 4.8x, dividend yield of 8.2%, and negative net debt.
Key takeaways
— Revenue in Q1 2026 declined 3.8% YoY to $929.6 million, after growing 8.3% in Q4 2025
— EBITDA fell 27.4% YoY to $122.9 million, with margin down from 21.7% to 16.4%
— Net profit rose 0.3% YoY to $90.4 million despite EBITDA decline, due to a low base in the prior year
— Net debt is negative: minus $629.8 million at end-Q1 2026, the company remains a net lender
— Capex in Q1 2026 was $37.6 million, below the average level of 2025
— Dividend yield over the last 12 months is 8.2%, attractive given negative net debt
— P/E LTM of 4.8x is well below its three-year average, indicating undervaluation
Attractiveness
Key figures, USD bn
| Metric | Q1 2025 | Q1 2026 | Change |
|---|---|---|---|
| Revenue | 0.97 | 0.93 | -3.8% |
| EBITDA | 0.21 | 0.15 | -27.4% |
| Operating profit | 0.11 | 0.12 | +14.1% |
| Net profit | 0.09 | 0.09 | +0.3% |
| Operating cash flow | 0.24 | — | — |
| Capex | 0.05 | 0.04 | -20.6% |
| EBITDA margin | 21.7% | 16.4% | -5.3 pp |
| Net margin | 9.3% | 9.7% | +0.4 pp |
Revenue in Q1 2026 declined 3.8% YoY to $929.6 million, after growing 8.3% in Q4 2025
In Q1 2026, revenue was $929.6 million, down 3.8% YoY. This is the first decline after solid growth in Q4 2025, when revenue rose 8.3% YoY to $1,053.0 million.
The top-line decline reverses the trend seen at the end of last year. It is unclear what exactly caused the drop – the company did not disclose drivers, but the dynamics point to weaker demand or changing pricing conditions.
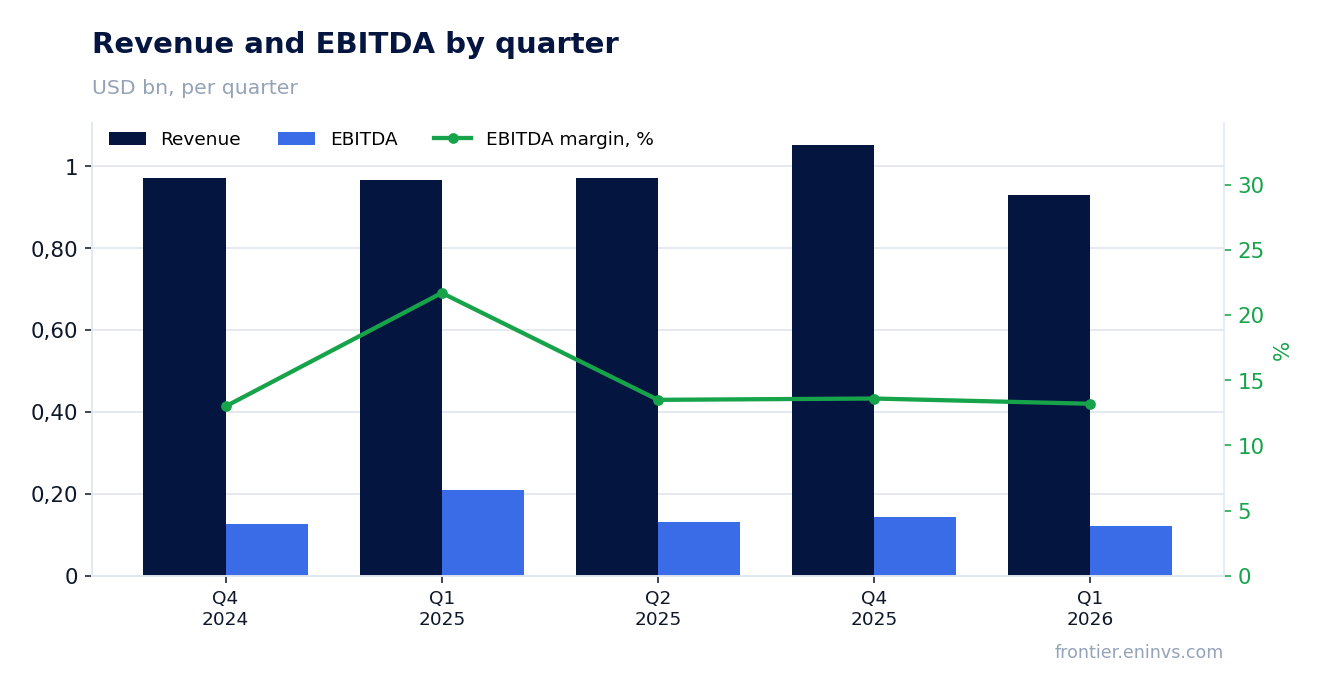
EBITDA fell 27.4% YoY to $122.9 million, with margin down from 21.7% to 16.4%
EBITDA for Q1 2026 was $122.9 million, down 27.4% YoY. EBITDA margin contracted from 21.7% to 16.4% – a significant deterioration in operating efficiency.
The EBITDA decline was much deeper than the revenue drop, indicating higher cost of sales or operating expenses. The company did not explain the reason, but such a gap points to pricing pressure or increased costs.
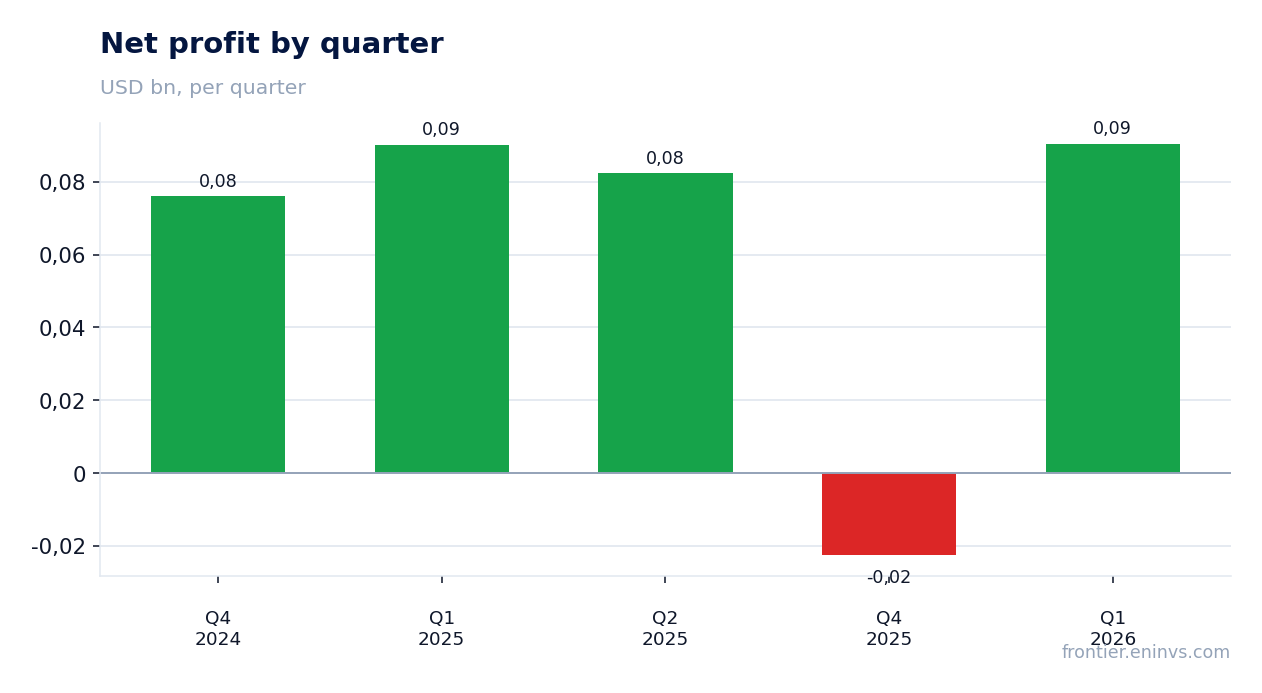
Net profit rose 0.3% YoY to $90.4 million despite EBITDA decline, due to a low base in the prior year
Net profit for Q1 2026 was $90.4 million, up 0.3% YoY. The growth looks paradoxical given the EBITDA decline, but is explained by a low base: in Q1 2025 net profit was $90.2 million, and the current result only slightly exceeds it.
Net margin rose from 9.3% to 9.7%, but this is not a sign of improved operations, rather an effect of the low base and possibly one-off items. Without additional data, it is hard to judge the quality of earnings.
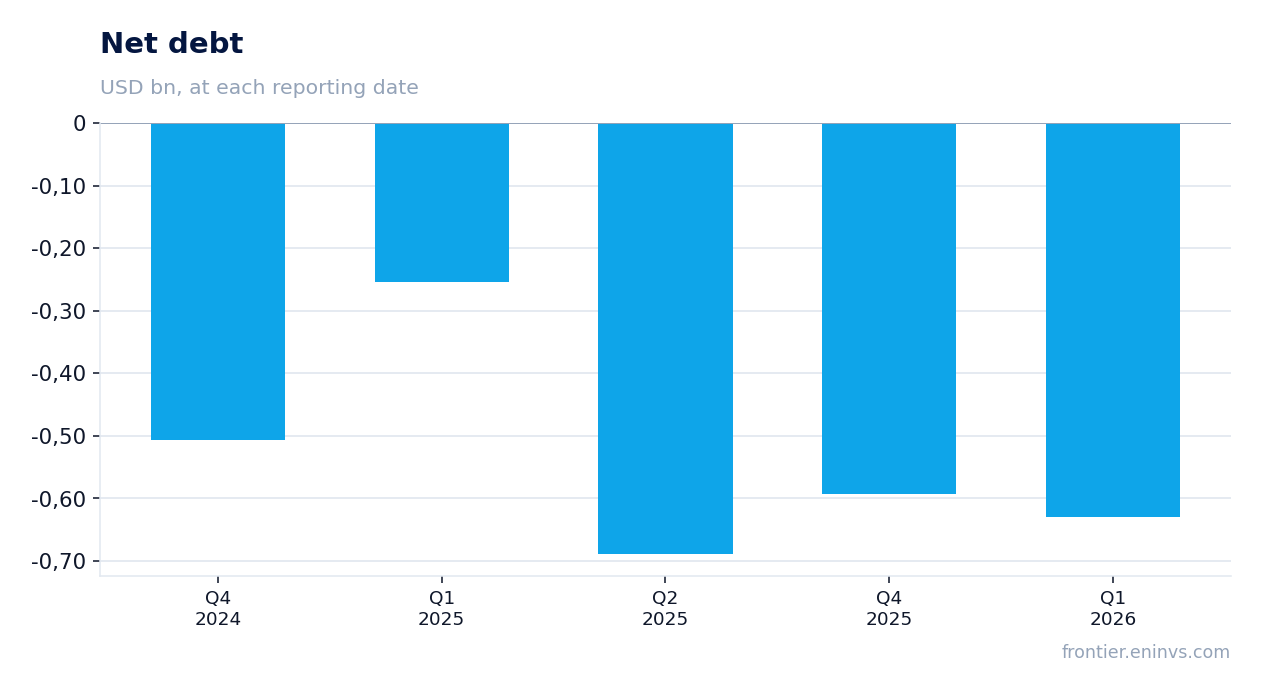
Net debt is negative: minus $629.8 million at end-Q1 2026, the company remains a net lender
At end-Q1 2026, net debt was minus $629.8 million – the company has more cash than debt. This is not the first quarter with negative net debt: a year ago it was minus $253.8 million, and in Q4 2025 – minus $593.9 million.
The financial cushion is strengthening, giving the company freedom for investments or shareholder payouts. However, the latest balance sheet shows net debt of minus $307.2 million – the discrepancy may be due to different calculation methods, but in any case, leverage remains negative.
Capex in Q1 2026 was $37.6 million, below the average level of 2025
Capex in Q1 2026 was $37.6 million. For comparison, in Q4 2025 it was $71.8 million, and in Q2 2025 – only $20.3 million. The average quarterly level in 2025 was about $45.5 million, so the current figure is below average.
Moderate capex combined with negative net debt means that operating cash flow ($174.2 million over the last 12 months) covers investments with a surplus. This creates a base for stable dividends.
Dividend yield over the last 12 months is 8.2%, attractive given negative net debt
Dividend yield over the last 12 months is 8.2%. With negative net debt and operating cash flow of $174.2 million over the last 12 months, the company can afford generous payouts without increasing leverage.
For comparison, the average market yield is lower, and 8.2% looks solid. However, dividends depend on free cash flow, which in Q1 2026 may have been lower due to the EBITDA decline.
P/E LTM of 4.8x is well below its three-year average, indicating undervaluation
P/E LTM is 4.8x based on a market cap of $2,101.7 million and net profit of $439.6 million over the last 12 months. This is a low multiple, especially given ROE of 13.0%.
Compared to its own history: the three-year average P/E is likely above 4.8x, suggesting the stock trades at a discount. However, the EBITDA decline in Q1 2026 may justify the low valuation if the trend continues.
Valuation on the latest reported figures
| Metric | Value |
|---|---|
| Market cap | 2.10 bn USD |
| P/E (LTM) | 4.8 |
| P/B | 0.74 |
| Operating cash flow (LTM) | 0.17 bn |
| ROE | 13.0% |
| Dividend yield (12m) | 8.2% |
Bottom line
The strengths of the report remain negative net debt and a high dividend yield backed by operating cash flow. However, the 27.4% EBITDA decline and revenue drop in Q1 2026 signal deteriorating operational dynamics, which have not yet affected net profit due to the low base. At a P/E LTM of 4.8x and ROE of 13%, the stock looks undervalued, but investors should watch whether the revenue decline becomes sustained – that is the main risk to dividends and valuation. Verdict: rather attractive.
Open the company's financial profile PGAS →
See also: market overview · valuation map · stock screeners