ID_TLKM: выручка ускорилась до +6,4%, но главное — долг сократился на 18,2 трлн IDR за квартал
31 июля 2026 года ID_TLKM раскрыла результаты за второй квартал 2026 года: выручка выросла на 6,4% год к году, чистая прибыль — на 21,6%, а чистый долг сократился на 18 193,5 млрд IDR за квартал. Акция выглядит привлекательно: при P/E 14,96 и EV/EBITDA 3,64, дивидендной доходности 8,4% и нулевом чистом долге к EBITDA, модель портала оценивает апсайд в 0%.
Главные тезисы
— Выручка во втором квартале 2026 года выросла на 6,4% год к году — лучший темп за последние пять кварталов
— EBITDA-маржа почти не изменилась, но чистая прибыль подскочила на 21,6% благодаря контролю над расходами
— Чистый долг сократился на 18,2 трлн IDR за квартал, до 26,3 трлн IDR
— Операционный денежный поток вырос до 17,6 трлн IDR, но капзатраты остаются высокими
— Дивидендная доходность 8,4% — выше средней по рынку, что поддерживает акцию
Оценка привлекательности
Ключевые показатели, млрд IDR
| Показатель | Q2 2025 | Q2 2026 | Изм. |
|---|---|---|---|
| Выручка | 36 365 | 38 689 | +6,4% |
| EBITDA | 17 734 | 18 808 | +6,1% |
| Операционная прибыль | 9 944 | 11 041 | +11,0% |
| Чистая прибыль | 5 165 | 6 279 | +21,6% |
| Операционный денежный поток | 15 797 | 17 572 | +11,2% |
| Капзатраты | 4 814 | 5 488 | +14,0% |
| Рентабельность по EBITDA | 48,8% | 48,6% | -0,2 п.п. |
| Чистая маржа | 14,2% | 16,2% | +2,0 п.п. |
Выручка во втором квартале 2026 года выросла на 6,4% год к году — лучший темп за последние пять кварталов
Во втором квартале 2026 года выручка ID_TLKM составила 38 689 млрд IDR, что на 6,4% больше, чем годом ранее. Это ускорение после четырёх кварталов снижения: в Q1 2025 падение было 2,1%, во Q2 2025 — 4,0%, в Q3 2025 — 0,9%, в Q4 2025 — 1,7%. В первом квартале 2026 года рост возобновился (+1,5%), а во втором квартале темп удвоился.
За первое полугодие 2026 года выручка составила 75 878 млрд IDR против 73 004 млрд IDR годом ранее. Источники роста в отчёте не детализированы, но ускорение совпадает с оживлением в телеком-сегменте и ростом спроса на цифровые услуги.
EBITDA-маржа почти не изменилась, но чистая прибыль подскочила на 21,6% благодаря контролю над расходами
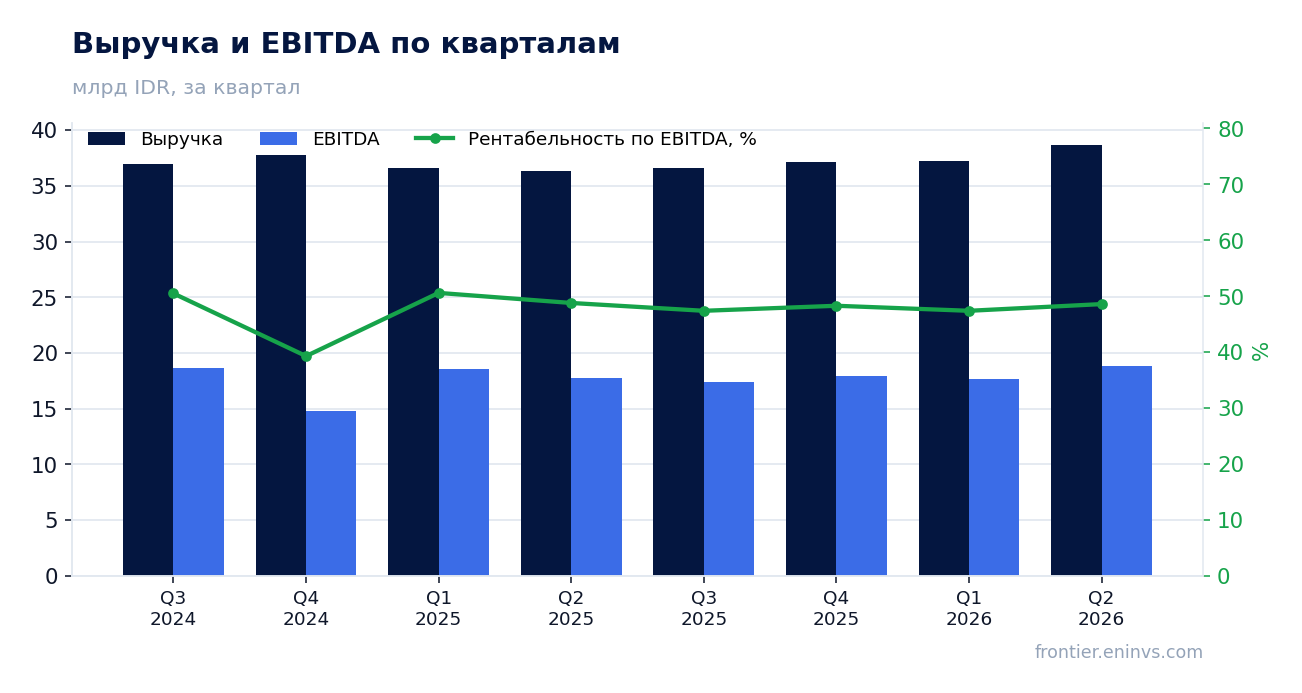
EBITDA во втором квартале 2026 года выросла на 6,1% год к году, до 18 808 млрд IDR, а маржа составила 48,6% против 48,8% годом ранее. Почти стабильная маржа при ускорении выручки говорит о том, что операционные расходы росли сопоставимо с доходами.
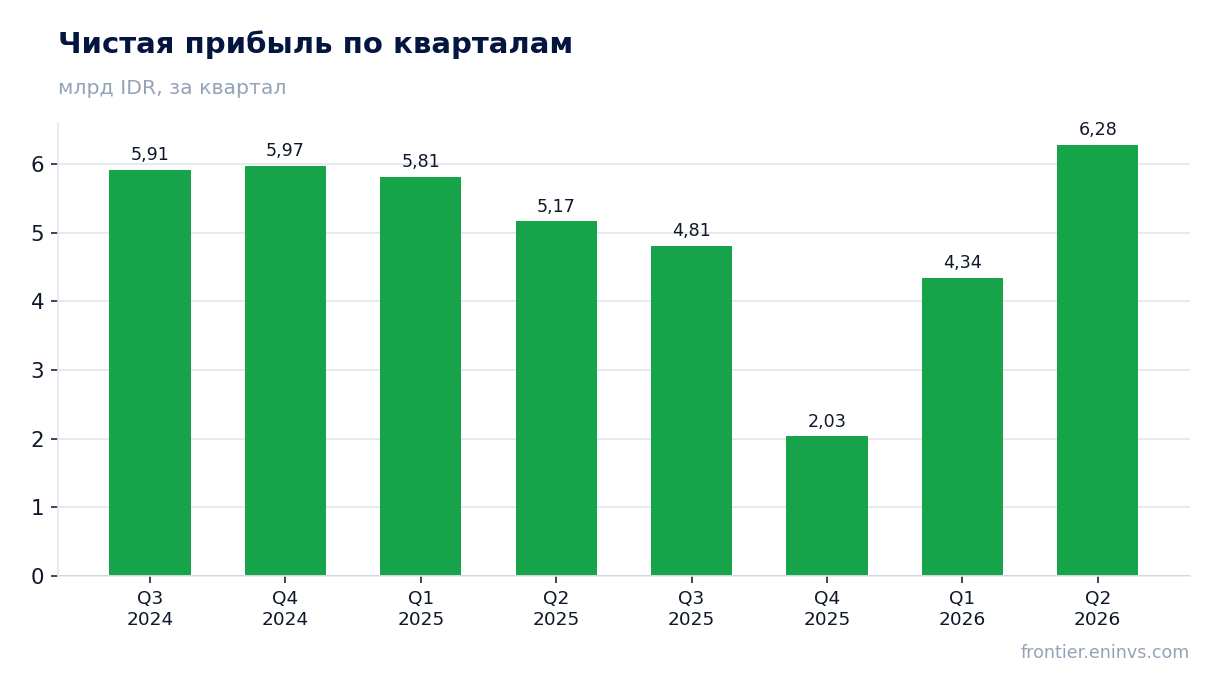
Чистая прибыль за квартал поднялась на 21,6%, до 6 279 млрд IDR, а чистая маржа расширилась с 14,2% до 16,2%. Разрыв между ростом EBITDA и прибыли объясняется снижением расходов на персонал и межсоединения: за полугодие они сократились на 4,4% и 9,7% соответственно, что поддержало нижнюю строку.
Чистый долг сократился на 18,2 трлн IDR за квартал, до 26,3 трлн IDR
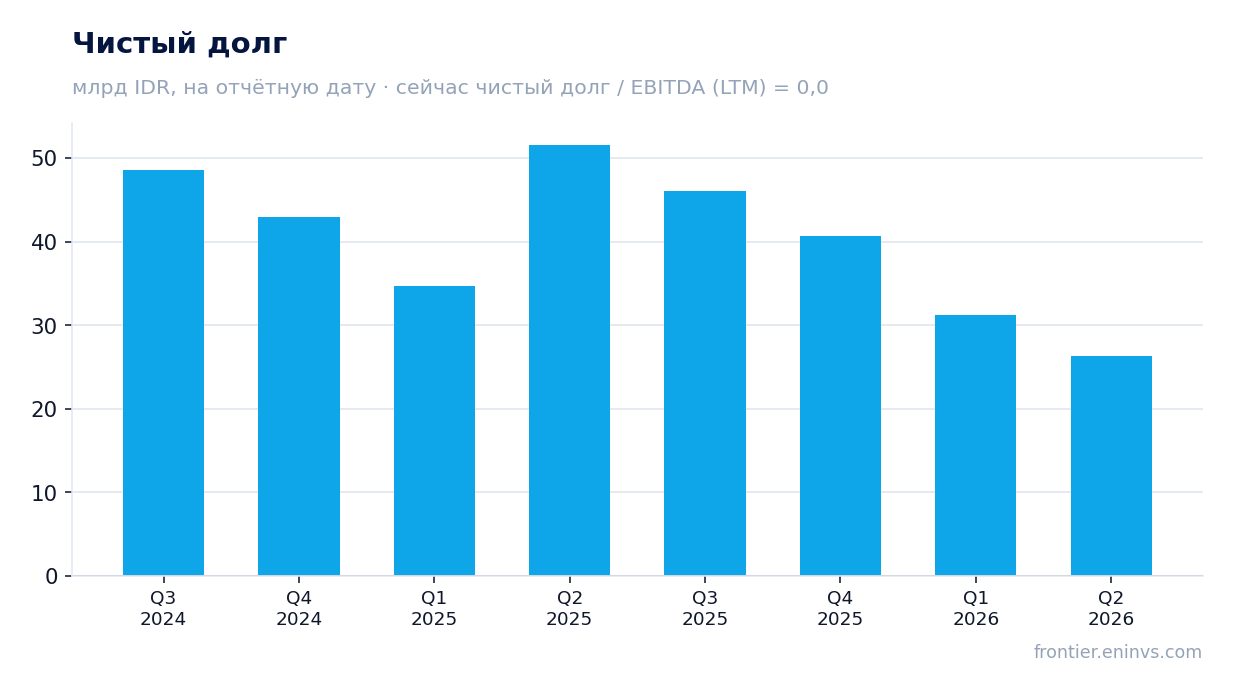
На конец июня 2026 года чистый долг ID_TLKM составил 26 306 млрд IDR, что на 18 193,5 млрд IDR меньше, чем на конец марта (44 499,5 млрд IDR, расчётно). За последние 12 месяцев долг сократился на 23 478 млрд IDR. Отношение чистого долга к EBITDA за последние 12 месяцев — 0,0.
Снижение долга произошло на фоне сильного операционного денежного потока и, вероятно, поступлений от продажи дочерней компании (в отчёте за полугодие отражены поступления в размере 855 млрд IDR от выбытия). Компания также продолжала программу обратного выкупа акций, потратив 1 480 млрд IDR за полугодие.
Операционный денежный поток вырос до 17,6 трлн IDR, но капзатраты остаются высокими
Во втором квартале 2026 года операционный денежный поток составил 17 572 млрд IDR против 15 797 млрд IDR годом ранее. За полугодие показатель вырос до 34 862 млрд IDR с 32 573 млрд IDR. Капзатраты за квартал — 5 488 млрд IDR, что ниже, чем в среднем за предыдущие четыре квартала (6 415 млрд IDR).
Свободный денежный поток (OCF минус capex) за квартал — примерно 12 084 млрд IDR, что покрывает дивидендные выплаты и обратный выкуп. Однако компания продолжает инвестировать в сеть и дата-центры, что видно по капзатратам за полугодие в 11 368 млрд IDR.
Дивидендная доходность 8,4% — выше средней по рынку, что поддерживает акцию
За последние 12 месяцев ID_TLKM выплатила дивиденды, обеспечивающие доходность 8,4% при текущей капитализации 261 239 млрд IDR. Это существенно выше средней доходности по индексу и делает акцию привлекательной для инвесторов, ориентированных на доход.
Выплаты подтверждаются отчётом о движении денежных средств: за полугодие компания направила на дивиденды акционерам материнской компании 21 999 млрд IDR (в 2025 году за аналогичный период — 21 047 млрд IDR). При сохранении операционного денежного потока на текущем уровне дивиденды выглядят устойчивыми.
Оценка по последним отчётным данным
| Метрика | Значение |
|---|---|
| Капитализация | 261 239 млрд IDR |
| P/E (LTM) | 15,0 |
| EV/EBITDA (LTM) | 3,6 |
| P/B | 2,00 |
| Чистый долг / EBITDA | 0,00 |
| Операционный денежный поток (LTM) | 61,6 млрд |
| ROE | 19,8% |
| Дивидендная доходность (12 мес) | 8,4% |
Итог
Отчёт за второй квартал 2026 года показывает ускорение выручки до +6,4% — лучший результат за пять кварталов, при стабильной EBITDA-марже и значительном росте чистой прибыли (+21,6%). Компания продолжает сокращать долг: чистый долг снизился до 26,3 трлн IDR, а отношение к EBITDA — нулевое. Операционный денежный поток остаётся сильным, но капзатраты съедают значительную часть FCF. При P/E 14,96, EV/EBITDA 3,64 и дивидендной доходности 8,4% акция выглядит привлекательно, особенно с учётом нулевого долга. Модель портала оценивает апсайд в 0%, что говорит о справедливой оценке. Главный вопрос — сможет ли компания удержать темпы роста выручки и маржу, а также насколько устойчивым будет денежный поток для поддержания дивидендов.
Перейти к финансовой карточке компании TLKM →
Смотрите также: обзор рынка · карта оценки рынков · скринеры акций