POSCO Holdings: Q2 2026 revenue up 9.7%, net profit up 4.3x, but debt keeps rising
25 августа POSCO Holdings раскрыла результаты за второй квартал 2026 года: выручка выросла на 9,7% год к году, до 19 258,7 млрд вон, EBITDA – на 17,5%, а чистая прибыль – на 328,3%, до 684,8 млрд вон. Рост ускорился после пяти кварталов снижения, но компания по-прежнему генерирует слабый денежный поток, а долг за год увеличился на 3 591,2 млрд вон. При текущей цене акции выглядят скорее привлекательно: мультипликатор EV/EBITDA на уровне 7,7x лишь немного выше собственного трёхлетнего среднего, а дивидендная доходность 2,7% остаётся умеренной.
Key takeaways
— Q2 2026 revenue grew 9.7% – the first solid growth after five quarters of decline
— Net profit rose 4.3x thanks to operating leverage and likely one-off items
— EBITDA margin widened to 9.9% from 9.3% a year earlier, but remains below 2024 levels
— Operating cash flow for the quarter was KRW 1,067.9 bn, but capex exceeded it
— Net debt rose to KRW 24,057.0 bn, net debt/EBITDA at 3.52
— Dividend yield of 2.7% – below historical average, but payments are backed by profit
— EV/EBITDA multiple of 7.7x – 8% above its own three-year average
Attractiveness
Key figures, KRW bn
| Metric | Q2 2025 | Q2 2026 | Change |
|---|---|---|---|
| Revenue | 17 556 | 19 259 | +9.7% |
| EBITDA | 1 624 | 1 908 | +17.5% |
| Operating profit | 607 | 819 | +34.9% |
| Net profit | 160 | 685 | +328.3% |
| Operating cash flow | 1 764 | 1 068 | -39.5% |
| Capex | 1 651 | 1 256 | -23.9% |
| EBITDA margin | 9.3% | 9.9% | +0.6 pp |
| Net margin | 0.9% | 3.6% | +2.7 pp |
Q2 2026 revenue grew 9.7% – the first solid growth after five quarters of decline
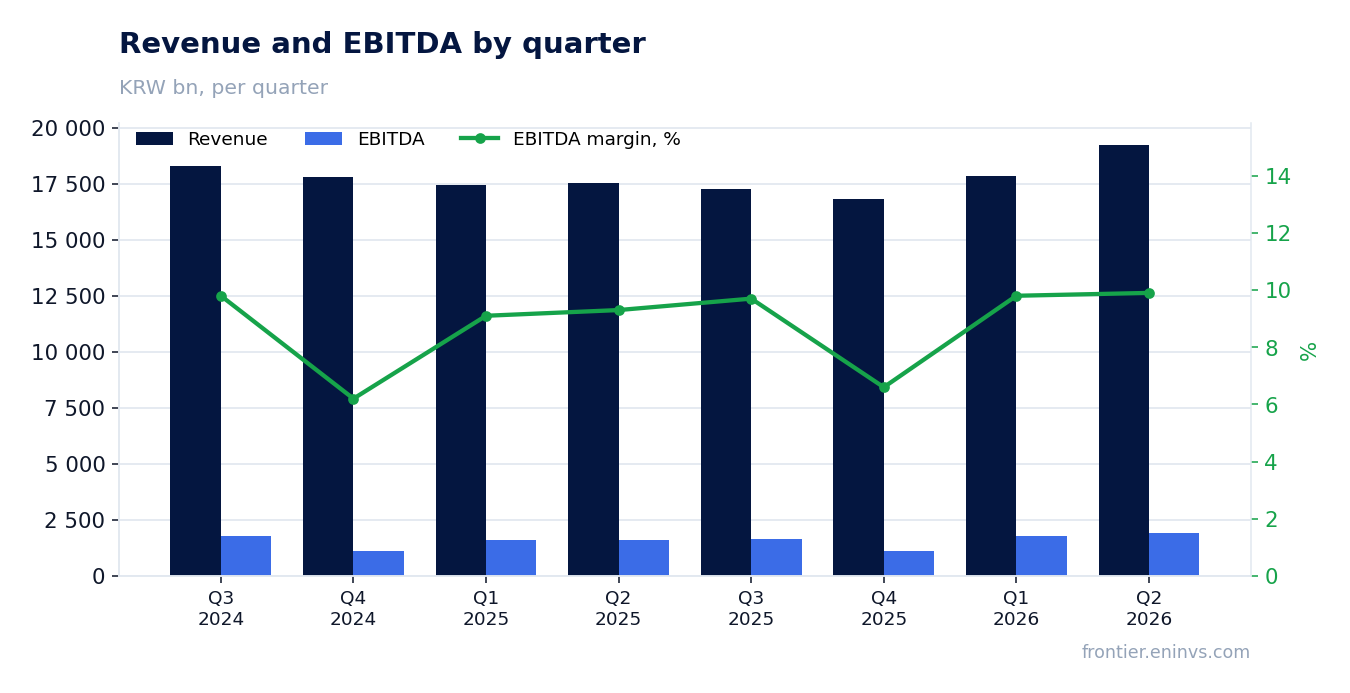
In Q2 2026, POSCO Holdings' revenue reached KRW 19,258.7 bn, up 9.7% year-on-year. This is the first solid growth after five consecutive quarters of decline: Q1 2025 -3.4%, Q2 2025 -5.2%, Q3 2025 -5.8%, Q4 2025 -5.4%, and Q1 2026 only +2.5%.
Sequential dynamics show acceleration: revenue grew 7.7% quarter-on-quarter (from KRW 17,876.1 bn in Q1 2026). This may reflect recovering steel demand and better pricing, although the company does not disclose revenue breakdown in the report.
Net profit rose 4.3x thanks to operating leverage and likely one-off items
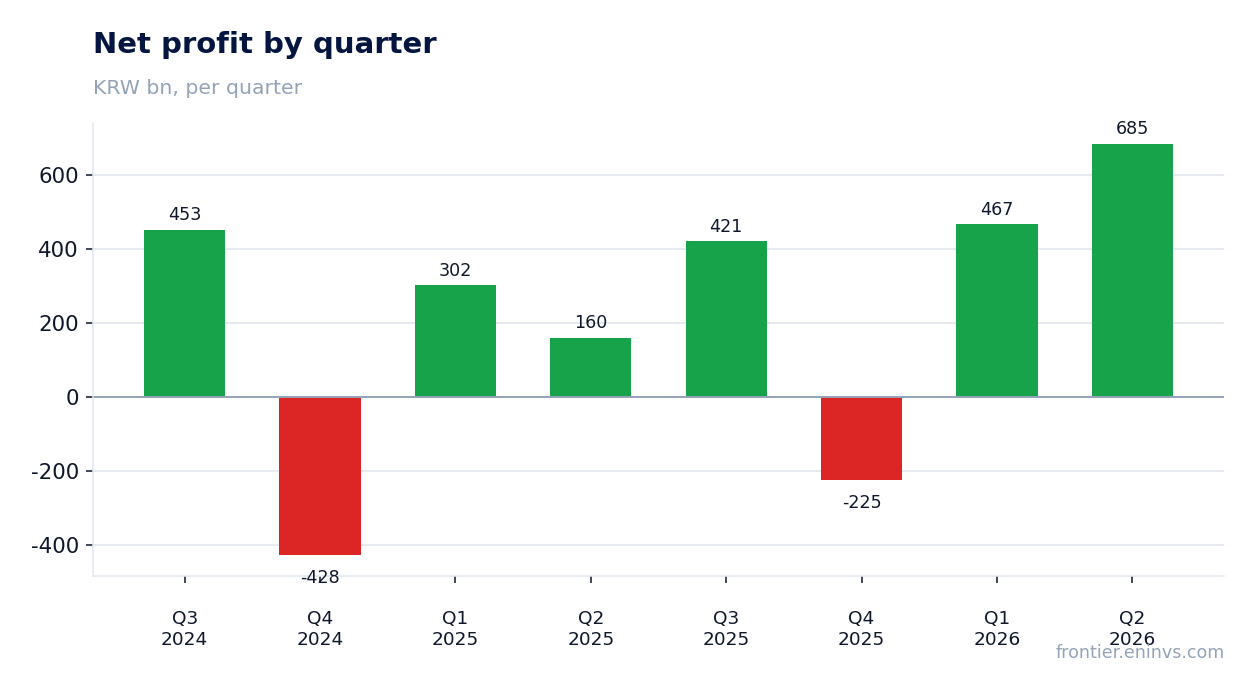
Net profit for Q2 2026 reached KRW 684.8 bn versus KRW 159.9 bn a year earlier – a 4.3x increase. Operating profit grew faster than revenue: from KRW 607.2 bn to KRW 819.0 bn, indicating operating leverage.
However, the gap between operating profit growth (+34.9%) and net profit growth (+328.3%) is too wide to be explained by operations alone. Likely, there were one-off items in other income, such as gains from asset sales or investment revaluation. Without such items, growth would have been more modest.
EBITDA margin widened to 9.9% from 9.3% a year earlier, but remains below 2024 levels
EBITDA for the quarter grew 17.5% year-on-year to KRW 1,907.9 bn, and EBITDA margin expanded from 9.3% to 9.9%. This is a positive signal: the company managed to improve profitability amid revenue growth.
However, the margin is still below mid-2024 levels: in Q3 2024 it was 9.8%, and in Q4 2024 only 6.2%. Recovery is underway, but still far from the peaks of 2024 (10.5% in Q1 2024, judging by data).
Operating cash flow for the quarter was KRW 1,067.9 bn, but capex exceeded it
In Q2 2026, operating cash flow (OCF) reached KRW 1,067.9 bn – a notable improvement after a negative figure in Q1 2026 (-KRW 359.3 bn). However, capex for the quarter was KRW 1,256.0 bn, meaning the company spent KRW 188.1 bn more than it generated from operations.
Over the trailing twelve months, OCF was KRW 4,571.9 bn, while capex totaled about KRW 6,800 bn (sum of quarterly values), resulting in negative free cash flow. This explains why the company is increasing debt despite positive profit.
Net debt rose to KRW 24,057.0 bn, net debt/EBITDA at 3.52
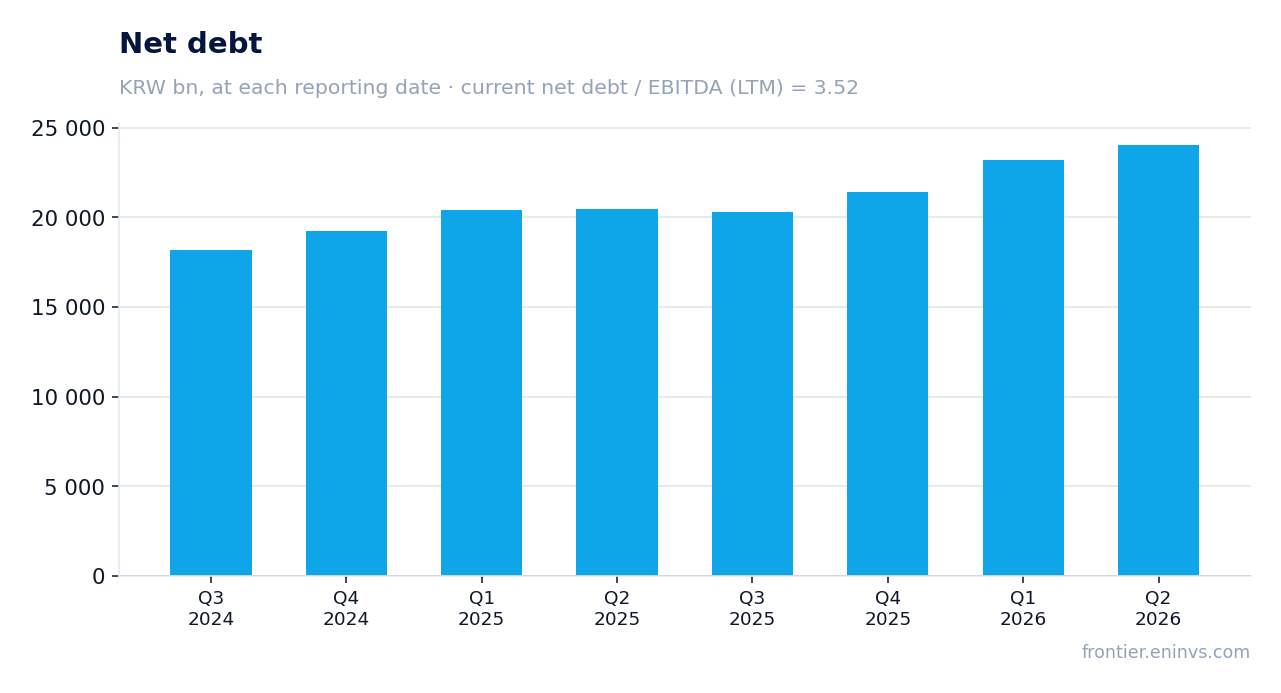
At the end of Q2 2026, POSCO Holdings' net debt stood at KRW 24,057.0 bn. It increased by KRW 866.3 bn during the quarter and by KRW 3,591.2 bn over the trailing twelve months. Debt growth accelerated: in Q1 2026, the increase was KRW 1,746.5 bn (from KRW 21,442.2 bn to KRW 23,190.7 bn).
Net debt to EBITDA for the trailing twelve months is 3.52. This is a high level for a steel company, especially given the volatility of steel prices. The company spends more than it generates and covers the gap with borrowings.
Dividend yield of 2.7% – below historical average, but payments are backed by profit
Over the trailing twelve months, POSCO Holdings paid dividends equivalent to 2.7% of the current share price. This is lower than many steel companies, but payments are backed by profit: trailing twelve-month net profit was KRW 1,347.5 bn, covering dividends with a margin.
Our estimate for the current year: if the company maintains a payout ratio of around 30% of net profit, the dividend could be approximately KRW 400 bn, implying a yield of about 1.6% at the current market cap of KRW 25,484.2 bn. However, the payment depends on whether one-off items are excluded from profit calculation and on funding needs for capex.
The key risk to dividends is negative free cash flow: if the company continues to spend more than it earns, it will have to choose between cutting investments and reducing payouts.
EV/EBITDA multiple of 7.7x – 8% above its own three-year average
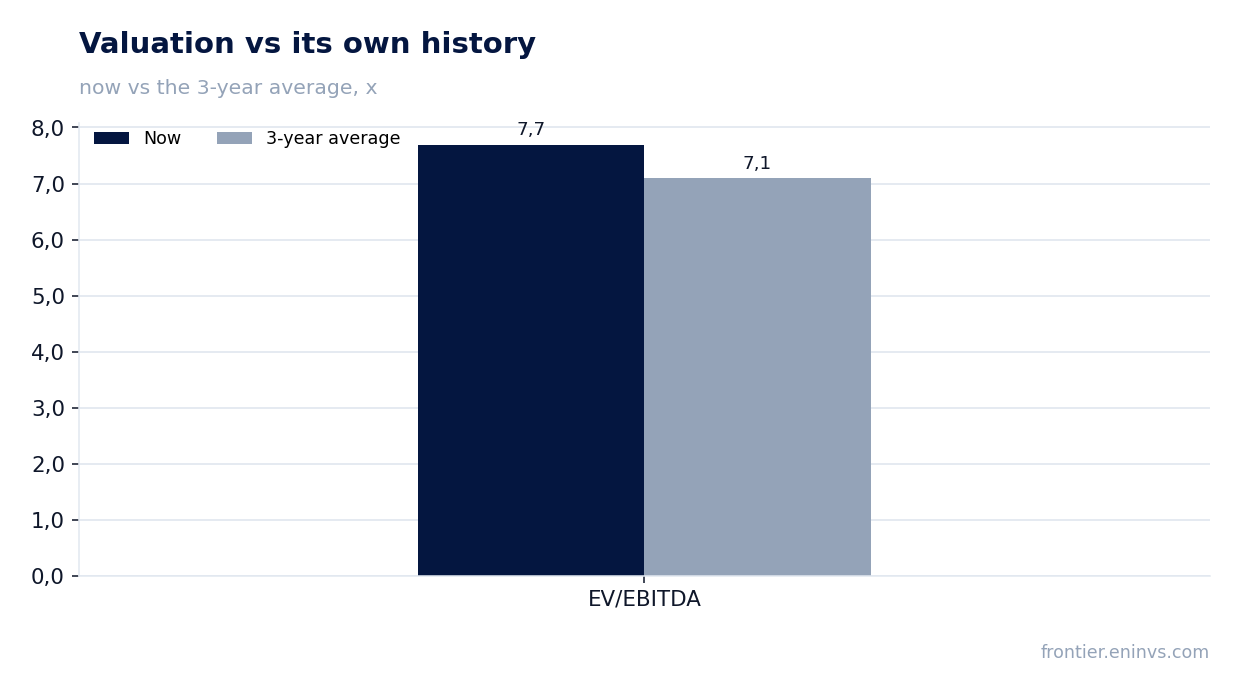
The current EV/EBITDA multiple is 7.7x, 8% above the three-year average of 7.1x. This means the market values the company somewhat higher than the average over the past three years, but not extremely.
P/E for the trailing twelve months is 18.9x, reflecting a low net margin (3.6% for the quarter). ROE is 4.3% – below the cost of capital, typical for the steel sector in a weak cycle phase.
If revenue growth and margins continue, the multiple may prove justified. But if debt keeps growing at the same pace and free cash flow remains negative, the current valuation will come under pressure.
Valuation on the latest reported figures
| Metric | Value |
|---|---|
| Market cap | 25 484 bn KRW |
| P/E (LTM) | 18.9 |
| EV/EBITDA (LTM) | 7.7 |
| P/B | 0.41 |
| Net debt / EBITDA (LTM) | 3.52 |
| Operating cash flow (LTM) | 4 572 bn |
| ROE | 4.3% |
| Dividend yield (12m) | 2.7% |
| EV/EBITDA, 3-year average | 7.1 |
Bottom line
In Q2 2026, POSCO Holdings showed strong revenue and profit growth, the first solid sign of a turnaround after five quarters of decline. However, this growth is driven not only by operational improvements but also likely by one-off items in profit, as well as accelerating debt growth. Free cash flow remains negative, and the company is financing capex with borrowings. At the current valuation – EV/EBITDA of 7.7x versus the average of 7.1x – the shares look rather attractive, but only if margin growth continues and debt stops rising at such a pace. The key question for holders is whether the company can convert profit growth into cash flow and halt the debt increase.
Open the company's financial profile 005490 →
See also: market overview · valuation map · stock screeners