Samsung SDI in Q2 2026: EBITDA up sixfold, but leverage remains high
On August 25, Samsung SDI released its results for the second quarter of 2026. Revenue grew 18.5% year on year, EBITDA surged 525.5% to KRW 802.8 billion, and net profit reached KRW 342.2 billion versus a loss a year earlier. At the current price, the share looks rather attractive: the EV/EBITDA multiple of 39.1 is well above its own three-year average of 11.2, but the portal's model implies 49% upside.
Key takeaways
— Revenue in Q2 2026 grew 18.5% year on year to KRW 3,768.8 billion
— EBITDA increased 6.3 times year on year to KRW 802.8 billion, with margin at 18.4%
— Net profit of KRW 342.2 billion versus a loss a year earlier, helped by operating profit recovery
— Leverage: net debt of KRW 9,079.9 billion, net debt/EBITDA of 6.54 over 12 months
— Capex is declining: KRW 543.7 billion in Q2 versus KRW 1,001.9 billion a year earlier
— The portal's model implies 49% upside from the current price
— EV/EBITDA of 39.1 is well above its own three-year average of 11.2
Attractiveness
Key figures, KRW bn
| Metric | Q2 2025 | Q2 2026 | Change |
|---|---|---|---|
| Revenue | 3 179 | 3 769 | +18.5% |
| EBITDA | 111 | 695 | +525.5% |
| Operating profit | -398 | 204 | to profit |
| Net profit | -161 | 342 | to profit |
| Operating cash flow | 529 | 24.2 | -95.4% |
| Capex | 1 002 | 544 | -45.7% |
| EBITDA margin | 3.5% | 18.4% | +14.9 pp |
| Net margin | -5.1% | 9.1% | +14.2 pp |
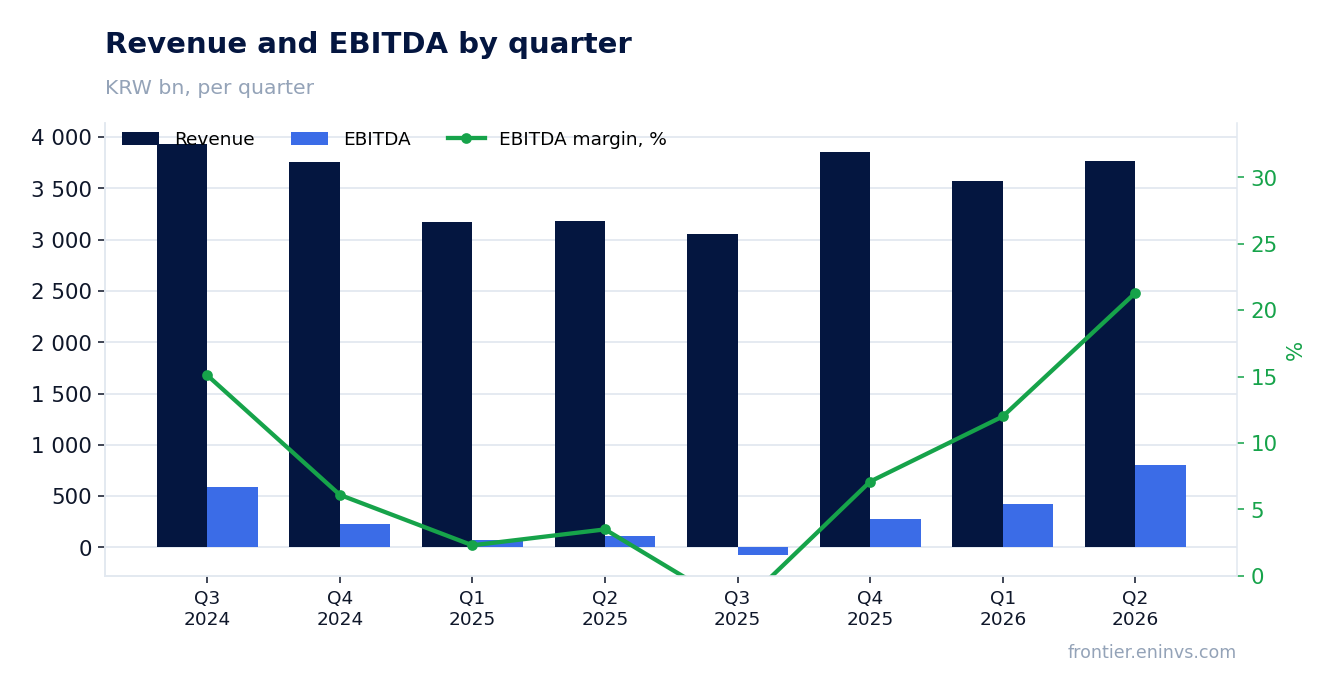
Revenue in Q2 2026 grew 18.5% year on year to KRW 3,768.8 billion
In Q2 2026, Samsung SDI reported revenue of KRW 3,768.8 billion, up 18.5% year on year. This continues an acceleration: Q1 2026 saw 12.6% growth, while Q4 2025 was only 2.8%.
Sequential dynamics show a demand recovery after a weak 2025, when revenue fell 22–34% for three consecutive quarters. In Q2 2026, the company returned to solid growth, supporting optimism for coming quarters.
EBITDA increased 6.3 times year on year to KRW 802.8 billion, with margin at 18.4%
EBITDA in Q2 2026 reached KRW 802.8 billion versus KRW 111.1 billion a year earlier — a 6.3-fold increase. EBITDA margin expanded from 3.5% to 18.4%, indicating a significant improvement in operating efficiency.
Sequential dynamics are also positive: EBITDA was KRW 428.0 billion in Q1 2026 and nearly doubled in Q2. This suggests that margin recovery is gaining momentum.
Net profit of KRW 342.2 billion versus a loss a year earlier, helped by operating profit recovery
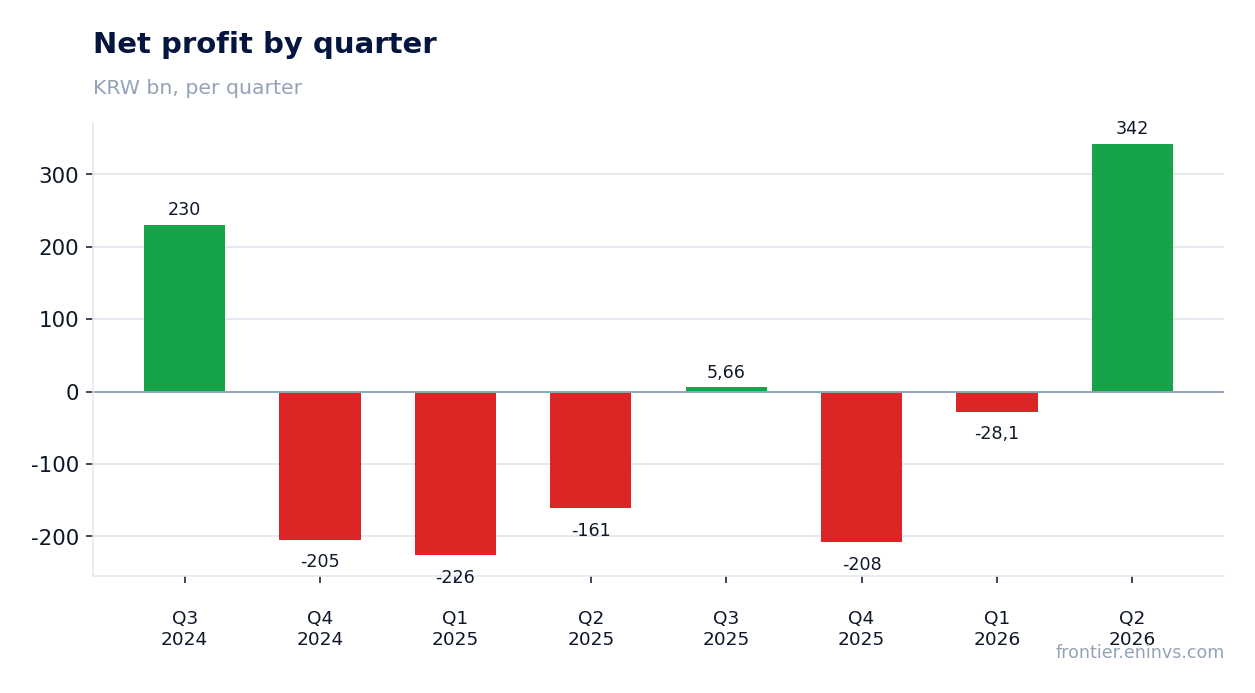
In Q2 2026, the company posted net profit of KRW 342.2 billion versus a loss of KRW 161.3 billion in Q2 2025. Operating profit turned positive: KRW 203.8 billion versus a loss of KRW 397.8 billion a year earlier.
Net margin was 9.1% versus a negative figure a year earlier. The operating profit recovery is the main driver, though one-off factors not disclosed in the report may have also contributed.
Leverage: net debt of KRW 9,079.9 billion, net debt/EBITDA of 6.54 over 12 months
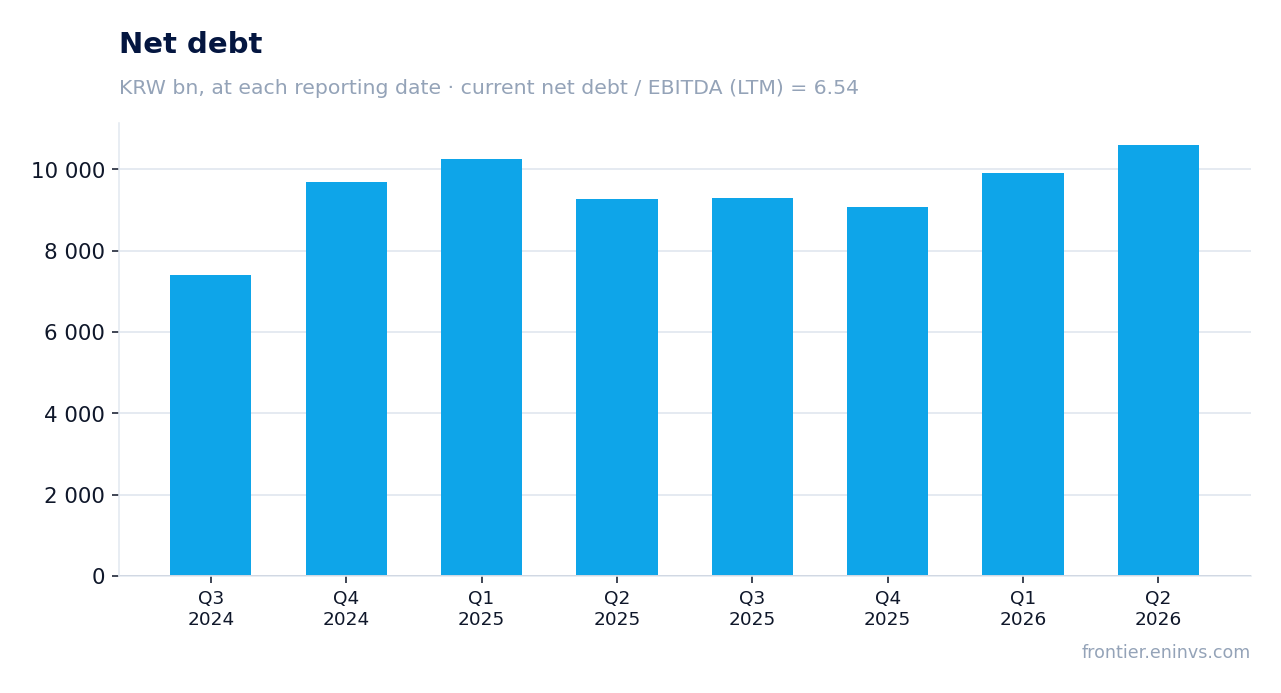
At the end of Q2 2026, Samsung SDI's net debt stood at KRW 9,079.9 billion. Net debt to EBITDA for the last 12 months is 6.54, a high level, although EBITDA for that period (KRW 1,388.6 billion) already includes a strong quarter.
Net debt increased by KRW 689.4 billion over the quarter and by KRW 1,341.6 billion over the year. Debt growth follows massive capex in previous periods, which is now starting to decline.
Capex is declining: KRW 543.7 billion in Q2 versus KRW 1,001.9 billion a year earlier
Capex in Q2 2026 was KRW 543.7 billion, almost half of the KRW 1,001.9 billion a year earlier. The decline in capex has continued for four consecutive quarters, which should support free cash flow.
Operating cash flow in Q2 was modest at KRW 24.2 billion, but over the last 12 months it reached KRW 792.4 billion. With lower capex, the company is approaching positive free cash flow.
The portal's model implies 49% upside from the current price
According to the portal's model, which multiplies EBITDA growth by a target multiple, the fair value of the share is 49% above the current market price. Market capitalization stands at KRW 45,174.3 billion.
The model implies that the market has not yet fully priced in the EBITDA recovery and further growth potential. However, realizing this potential depends on maintaining current margin dynamics and reducing leverage.
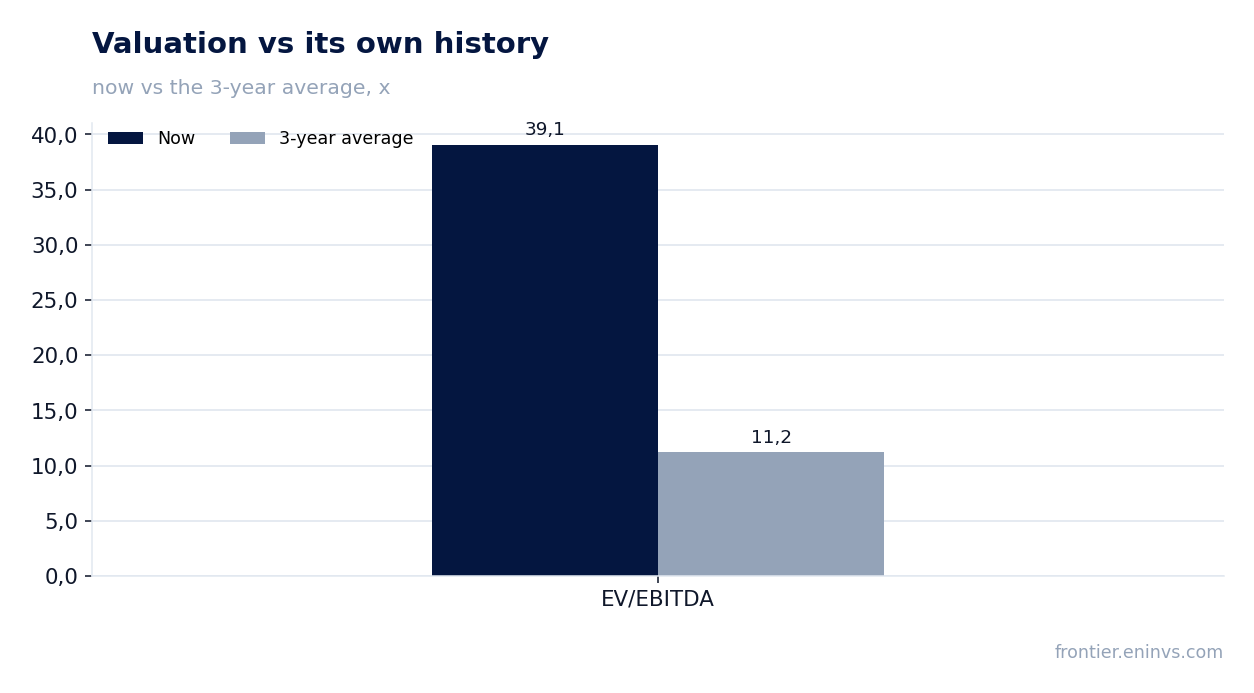
EV/EBITDA of 39.1 is well above its own three-year average of 11.2
The current EV/EBITDA multiple is 39.1, more than three times its own three-year average of 11.2. This indicates that the market is valuing the company at a premium to its historical valuation.
The high multiple is explained by low EBITDA over the last 12 months (KRW 1,388.6 billion) relative to market capitalization. If EBITDA continues to grow, the multiple will normalize quickly, but the current level leaves little margin of safety.
Valuation on the latest reported figures
| Metric | Value |
|---|---|
| Market cap | 45 174 bn KRW |
| EV/EBITDA (LTM) | 39.1 |
| P/B | 2.11 |
| Net debt / EBITDA (LTM) | 6.54 |
| Operating cash flow (LTM) | 792 bn |
| ROE | 5.3% |
| EV/EBITDA, 3-year average | 11.2 |
Bottom line
Bottom line: Samsung SDI showed a strong recovery in Q2 2026 — revenue grew 18.5%, EBITDA increased 6.3 times, and net profit turned positive. However, this reflects both operational improvements and the low base of 2025. Leverage remains high, and the EV/EBITDA multiple of 39.1 is well above its own three-year average. Nevertheless, the portal's model implies 49% upside, making the share rather attractive provided current dynamics persist.
Open the company's financial profile 006400 →
See also: market overview · valuation map · stock screeners