Samsung Heavy Industries: double-digit revenue and EBITDA growth, but net profit barely moves on one-offs
On August 25, Samsung Heavy Industries reported Q2 2026 results: revenue grew 20.4% YoY, EBITDA 21.0%, but net profit only 4.8%. At the current price, the share looks attractive: the EV/EBITDA multiple is well below its own three-year average, and the portal's model implies about 30% upside.
Key takeaways
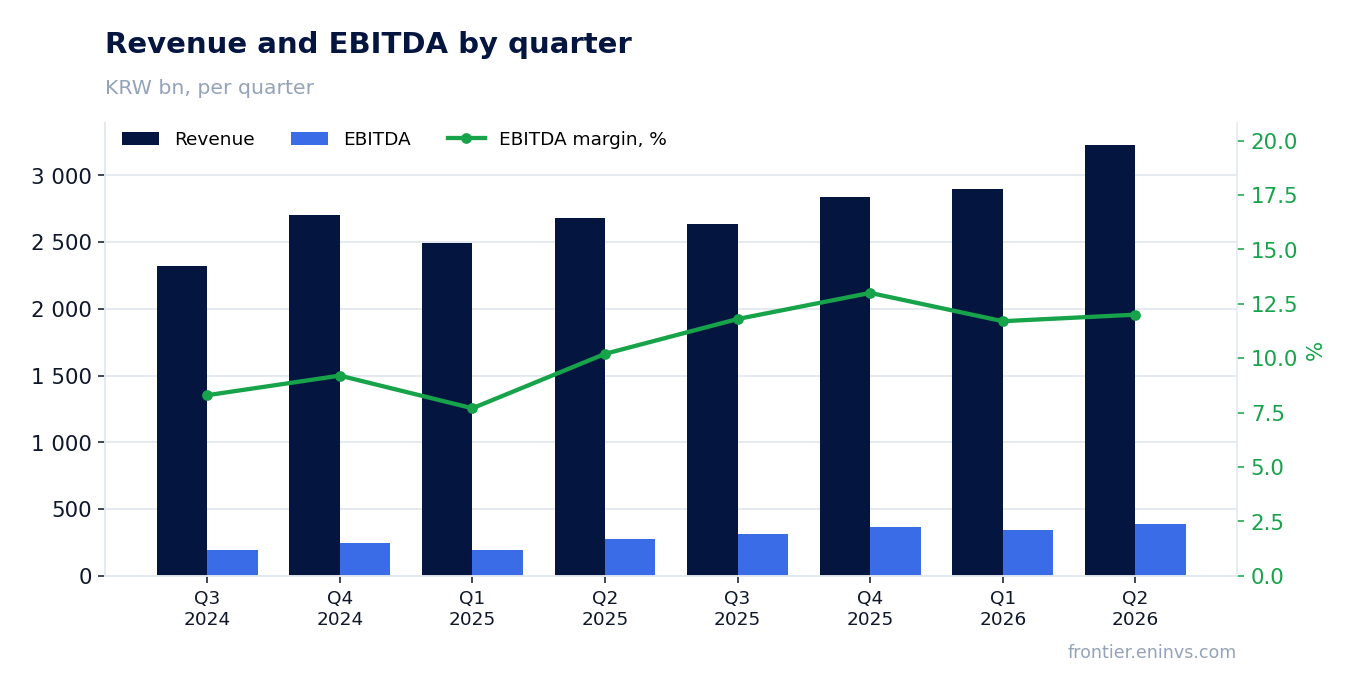
— Q2 2026 revenue grew 20.4% YoY to KRW 3,230.7 billion on a solid order book
— Q2 2026 EBITDA margin was 12.0%, up 0.1 pp YoY, driven by operating leverage
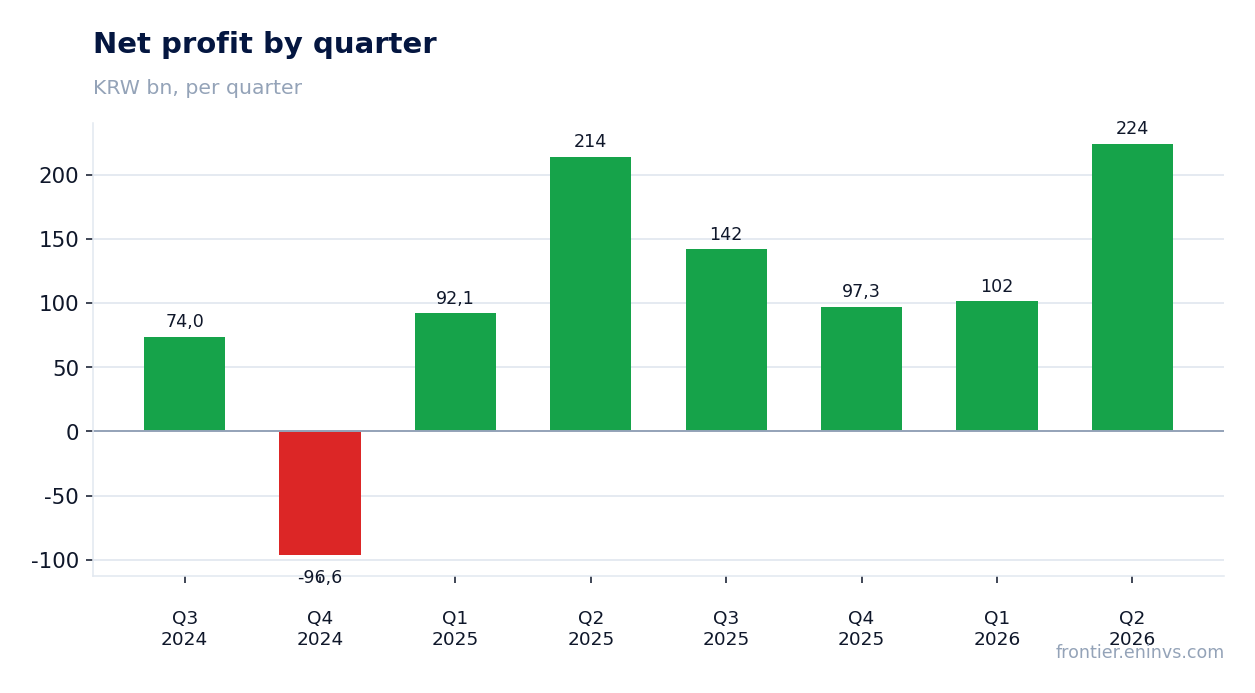
— Q2 2026 net profit rose only 4.8% YoY due to a one-off tax benefit in the prior year
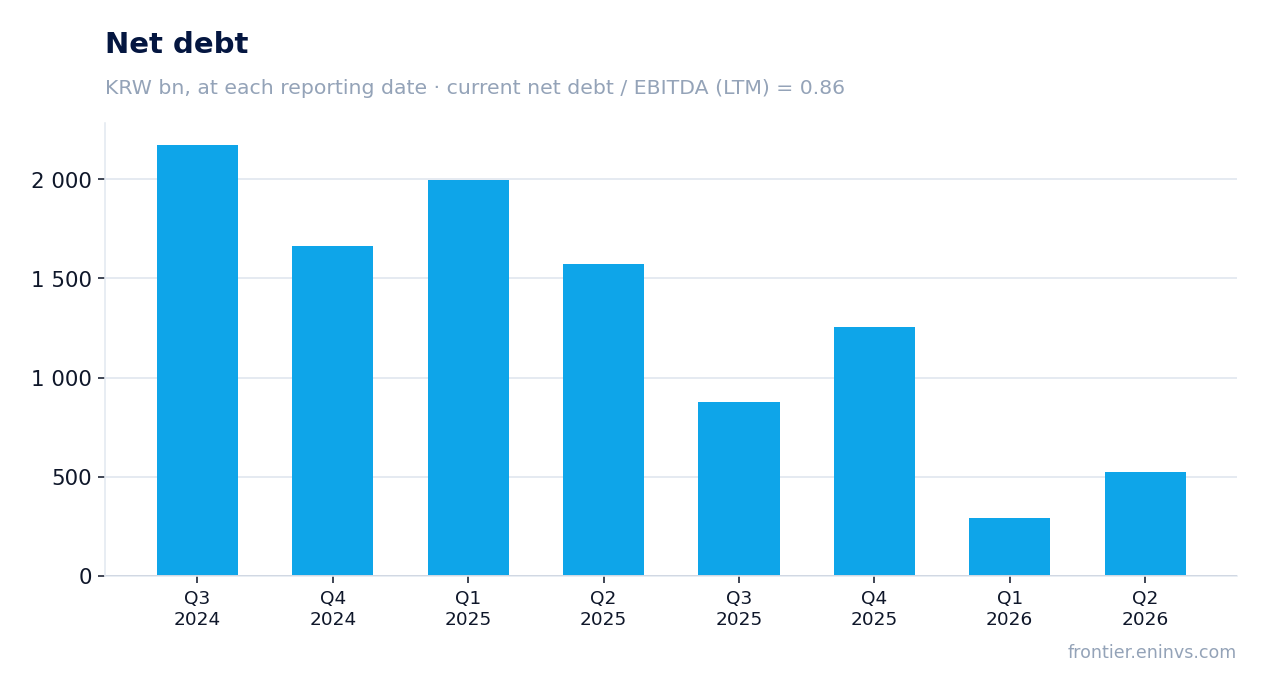
— Operating cash flow over the last twelve months was KRW 1,562.8 billion, cutting net debt by KRW 1,048.1 billion over the year
— Net debt at end-Q2 2026 stood at KRW 522.7 billion, or 0.86x EBITDA for the last twelve months
— Capex remains moderate, supporting free cash flow and dividend capacity
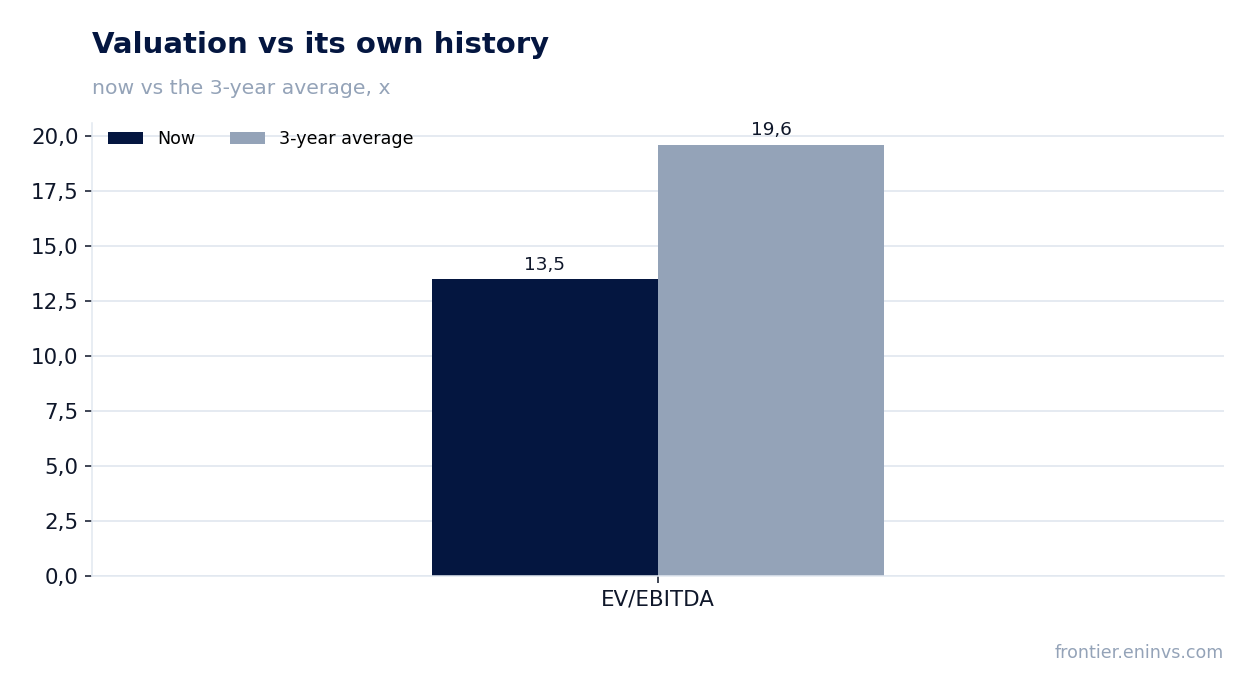
— The stock trades at 13.5x EV/EBITDA versus its three-year average of 19.6x, implying about 30% upside on the portal's model
Attractiveness
Key figures, KRW bn
| Metric | Q2 2025 | Q2 2026 | Change |
|---|---|---|---|
| Revenue | 2 683 | 3 231 | +20.4% |
| EBITDA | 321 | 388 | +21.0% |
| Operating profit | 205 | 325 | +58.7% |
| Net profit | 214 | 224 | +4.8% |
| Operating cash flow | 401 | 818 | +103.8% |
| Capex | 66.8 | 61.2 | -8.5% |
| EBITDA margin | 11.9% | 12.0% | +0.1 pp |
| Net margin | 8.0% | 6.9% | -1.1 pp |
Q2 2026 revenue grew 20.4% YoY to KRW 3,230.7 billion on a solid order book
In Q2 2026, Samsung Heavy Industries' revenue reached KRW 3,230.7 billion, up 20.4% YoY. This marks an acceleration from prior quarters: Q1 2026 grew 16.4%, while Q2 2025 grew only 6.0%. The company continues to ramp up on the back of its order book built in previous periods.
Over the last twelve months, revenue reached KRW 11,605.7 billion, confirming business resilience. Revenue growth is accompanied by improved operational efficiency, as seen in EBITDA and operating profit dynamics.
Q2 2026 EBITDA margin was 12.0%, up 0.1 pp YoY, driven by operating leverage
EBITDA in Q2 2026 grew 21.0% YoY to KRW 387.9 billion, with margin at 12.0% versus 11.9% a year earlier. Margin expansion is modest but comes alongside accelerating revenue, indicating positive operating leverage: volumes are growing without proportional cost increases.
Operating profit in Q2 2026 reached KRW 325.0 billion, up 20.4% YoY. This confirms that the main driver is operational activity, not one-offs.
Q2 2026 net profit rose only 4.8% YoY due to a one-off tax benefit in the prior year
Net profit in Q2 2026 was KRW 224.3 billion, up only 4.8% YoY. Operating profit grew 20.4%, indicating significant non-operating items. In Q2 2025, net profit was boosted by a one-off tax benefit, making the comparison less meaningful.
Net margin in Q2 2026 was 6.9% versus 8.0% a year earlier. The decline stems from the absence of the one-off factor, not from deterioration in the core business.
Operating cash flow over the last twelve months was KRW 1,562.8 billion, cutting net debt by KRW 1,048.1 billion over the year
Over the last twelve months, Samsung Heavy Industries' operating cash flow reached KRW 1,562.8 billion. This strong result allowed the company to cut net debt by KRW 1,048.1 billion over the year. In Q2 2026, operating cash flow was KRW 818.1 billion, confirming sustainable cash generation.
The high operating cash flow stems from improved working capital management and higher profitability. The company uses free funds to reduce debt, strengthening its balance sheet.
Net debt at end-Q2 2026 stood at KRW 522.7 billion, or 0.86x EBITDA for the last twelve months
At end-Q2 2026, net debt stood at KRW 522.7 billion, or 0.86x EBITDA for the last twelve months. This is a low leverage level, providing financial flexibility. Net debt rose by KRW 228.8 billion over the quarter, but that does not change the overall picture of moderate indebtedness.
The KRW 1,048.1 billion reduction in debt over the year was driven by strong operating cash flow and moderate capex. Low leverage supports the credit rating and reduces interest expenses.
Capex remains moderate, supporting free cash flow and dividend capacity
In Q2 2026, capex was KRW 61.2 billion, modest compared to operating cash flow of KRW 818.1 billion. Over the last twelve months, capex remained moderate, allowing the company to allocate significant funds to debt reduction and, likely, dividends.
Moderate capex is typical for the shipbuilding industry at this stage of the cycle, as major capacities are already in place. Free cash flow remains positive, providing a base for dividend payments. However, specific dividend payments are not disclosed in the report, so we cannot assess their size.
The stock trades at 13.5x EV/EBITDA versus its three-year average of 19.6x, implying about 30% upside on the portal's model
The current EV/EBITDA multiple is 13.5x versus the three-year average of 19.6x. This means the stock trades at a significant discount to its own history. P/E over the last twelve months is 32.6x, reflecting a relatively high earnings multiple, but the EBITDA multiple looks more attractive.
On the portal's model, which assesses EBITDA growth and target multiple, the stock's upside potential is about 30%. This is our own calculation, not a market consensus. If the company continues to deliver double-digit EBITDA growth, the stock has good chances for re-rating.
Valuation on the latest reported figures
| Metric | Value |
|---|---|
| Market cap | 18 447 bn KRW |
| P/E (LTM) | 32.6 |
| EV/EBITDA (LTM) | 13.5 |
| P/B | 4.50 |
| Net debt / EBITDA (LTM) | 0.86 |
| Operating cash flow (LTM) | 1 563 bn |
| ROE | 19.6% |
| EV/EBITDA, 3-year average | 19.6 |
Bottom line
Samsung Heavy Industries delivered a strong quarter: revenue and EBITDA are growing at double-digit rates, operating cash flow remains high, and leverage is low. Net profit grew modestly due to a one-off tax effect last year, but that does not reflect business deterioration. The stock trades at a discount to its own history, and the portal's model implies about 30% upside. Verdict – attractive, provided order growth and margins are sustained.
Open the company's financial profile 010140 →
See also: market overview · valuation map · stock screeners