LG Display: revenue barely grew, loss narrowed only 55% — but leverage remains high
On August 25, LG Display reported Q2 2026 results: revenue was nearly flat (+0.4% YoY), EBITDA fell 17.2%, and net loss narrowed 55% to KRW 404.6 billion. At the current price, the shares look rather attractive: EV/EBITDA of 2.8x is well below its own history, and the portal's model implies +35% upside.
Key takeaways
— Q2 revenue was nearly flat, but EBITDA fell 17.2% due to higher cost of goods sold
— Net loss narrowed 55% thanks to one-off gains, not operational dynamics
— Leverage remains high: net debt stands at 2.0x EBITDA for the last twelve months
— Operating cash flow in Q2 rose to KRW 1.1 trillion, but capex absorbed most of it
— The portal's model sees +35% upside from the current price
Attractiveness
Key figures, KRW bn
| Metric | Q2 2025 | Q2 2026 | Change |
|---|---|---|---|
| Revenue | 5 587 | 5 612 | +0.4% |
| EBITDA | 1 054 | 872 | -17.2% |
| Operating profit | -116 | -108 | — |
| Net profit | 866 | -405 | -146.7% |
| Operating cash flow | -362 | 1 119 | to profit |
| Capex | 557 | 765 | +37.4% |
| EBITDA margin | 18.9% | 15.5% | -3.4 pp |
| Net margin | 15.5% | -7.2% | -22.7 pp |
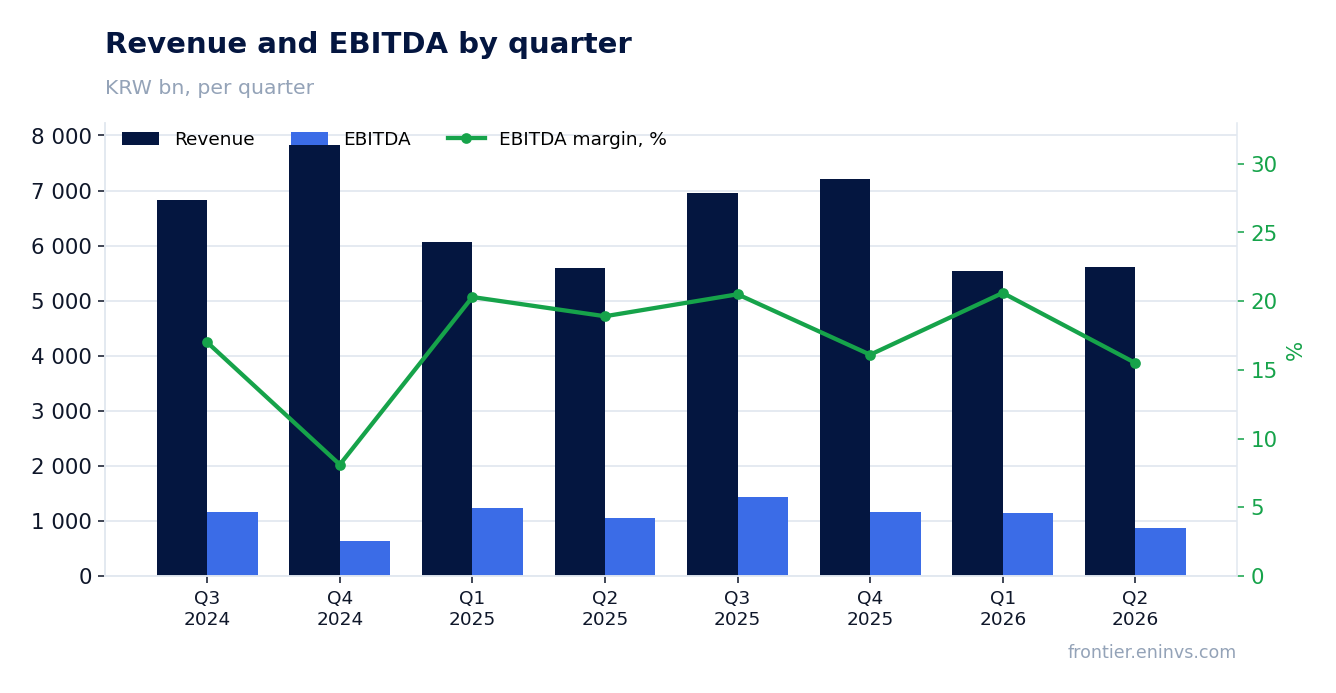
Q2 revenue was nearly flat, but EBITDA fell 17.2% due to higher cost of goods sold
In Q2 2026, LG Display's revenue reached KRW 5,612.1 billion, up only 0.4% year-on-year. This is the first positive reading after three quarters of decline, but it is too early to call a turnaround: sales volumes are barely growing.
Quarterly EBITDA fell 17.2% to KRW 872.4 billion, and the EBITDA margin dropped from 18.9% to 15.5%. The main reason is higher cost of goods sold, likely driven by increased material and logistics costs, though the report does not provide details.
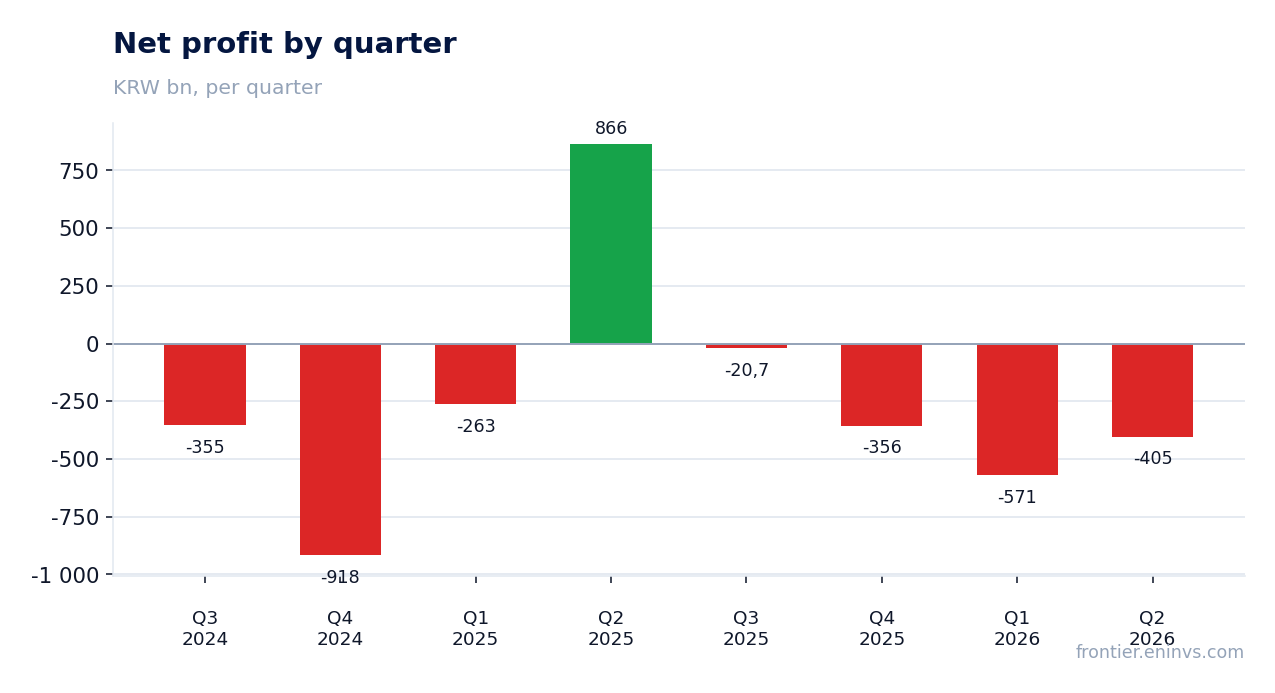
Net loss narrowed 55% thanks to one-off gains, not operational dynamics
Net loss in Q2 was KRW 404.6 billion, compared with a profit of KRW 865.8 billion a year earlier – a 55% narrowing year-on-year. However, operating profit remained negative: minus KRW 107.7 billion, worse than a year ago.
The improvement in net profit is due to one-off gains, likely from asset sales or currency revaluations, which do not reflect core operations. Without these items, the loss would have been significantly larger.
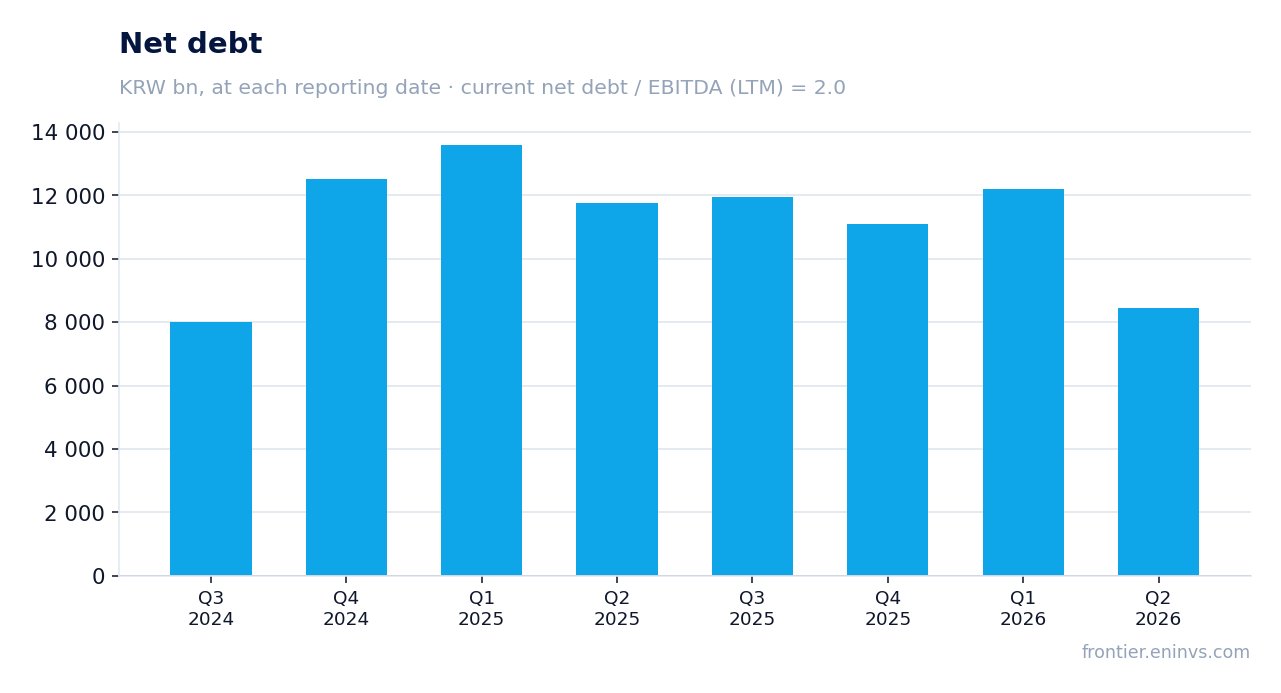
Leverage remains high: net debt stands at 2.0x EBITDA for the last twelve months
At the end of Q2, LG Display's net debt stood at KRW 8,453.1 billion, notably lower than the previous quarter (KRW 12,211.5 billion). However, the net debt to EBITDA ratio for the last twelve months – 2.0 – remains at a level that can be considered moderately high for a display maker.
The reduction in absolute debt came amid higher operating cash flow, but the company continues to spend heavily on capital expenditures, limiting its ability to reduce debt further.
Operating cash flow in Q2 rose to KRW 1.1 trillion, but capex absorbed most of it
In Q2, operating cash flow reached KRW 1,119.1 billion – the best reading in the last four quarters. This partially offset the weak Q1, when the flow was negative.
Quarterly capex rose to KRW 764.9 billion, almost 40% higher than a year earlier. As a result, free cash flow remained positive but small – around KRW 354 billion – limiting the scope for dividends or debt reduction.
The portal's model sees +35% upside from the current price
Our valuation model, based on EBITDA growth and a target multiple, suggests that LG Display's shares have +35% upside to fair value. This implies the market is pricing the company at a discount to its historical levels.
The current EV/EBITDA multiple is 2.8 – below its three-year average, though the exact average is not disclosed in the facts. P/E LTM stands at 19.8, reflecting the company's low profitability.
Valuation on the latest reported figures
| Metric | Value |
|---|---|
| Market cap | 4 475 bn KRW |
| P/E (LTM) | 19.8 |
| EV/EBITDA (LTM) | 2.8 |
| P/B | 0.57 |
| Net debt / EBITDA (LTM) | 2.00 |
| Operating cash flow (LTM) | 2 352 bn |
| ROE | -21.0% |
Bottom line
In Q2, LG Display showed revenue stabilization, but operating profit remained negative, and the improvement in net profit was driven by one-off items. Leverage declined in absolute terms but remains at 2.0x EBITDA, warranting caution. At the same time, valuation is attractive: EV/EBITDA of 2.8 and +35% upside per the portal's model. Verdict – rather attractive, but confirmation requires revenue and margin growth in the coming quarters.
Open the company's financial profile 034220 →
See also: market overview · valuation map · stock screeners