LG Electronics: revenue accelerates to +14.9%, net debt at two-year low
25 августа LG Electronics раскрыла результаты за второй квартал 2026 года: выручка выросла на 14,9% год к году, до 23 826 млрд вон, EBITDA – на 35,9%, до 2 450 млрд, чистая прибыль – на 10,5%, до 668 млрд. Акции торгуются по EV/EBITDA 5,0 против среднего за три года 3,2, но долговая нагрузка минимальна, а денежный поток бьёт рекорды. Вердикт – «скорее привлекательно»: рост ускоряется, баланс крепкий, но оценка уже не дешёвая.
Key takeaways
— Q2 2026 revenue grew 14.9% YoY – the fastest in five quarters
— EBITDA margin jumped to 10.3% from 8.7% a year ago, driven by operating leverage
— Net profit rose only 10.5% – higher taxes and financial expenses weighed
— Operating cash flow hit KRW 2,452bn, capex fell – free cash flow turned positive
— Net debt dropped to KRW 4,129bn – a two-year low, Net Debt/EBITDA at 0.68
— Dividend yield of 0.66% is below historical levels, but payouts are backed by cash flow
— EV/EBITDA of 5.0x versus 3.2x three-year average – valuation above its own history
Attractiveness
Key figures, KRW bn
| Metric | Q2 2025 | Q2 2026 | Change |
|---|---|---|---|
| Revenue | 20 735 | 23 826 | +14.9% |
| EBITDA | 1 802 | 2 450 | +35.9% |
| Operating profit | 639 | 1 579 | +147.0% |
| Net profit | 605 | 668 | +10.5% |
| Operating cash flow | 1 548 | 2 452 | +58.4% |
| Capex | 821 | 840 | +2.3% |
| EBITDA margin | 8.7% | 10.3% | +1.6 pp |
| Net margin | 2.9% | 2.8% | -0.1 pp |
Q2 2026 revenue grew 14.9% YoY – the fastest in five quarters
In Q2 2026, LG Electronics' revenue reached KRW 23,826bn, up 14.9% YoY. This is the strongest growth in five quarters, compared to a range of -1.4% to +4.8% in the previous three quarters.
The acceleration came amid recovering demand for home appliances and TVs, as well as a favorable sales mix. The company has now grown revenue for four consecutive quarters, indicating a sustainable trend.
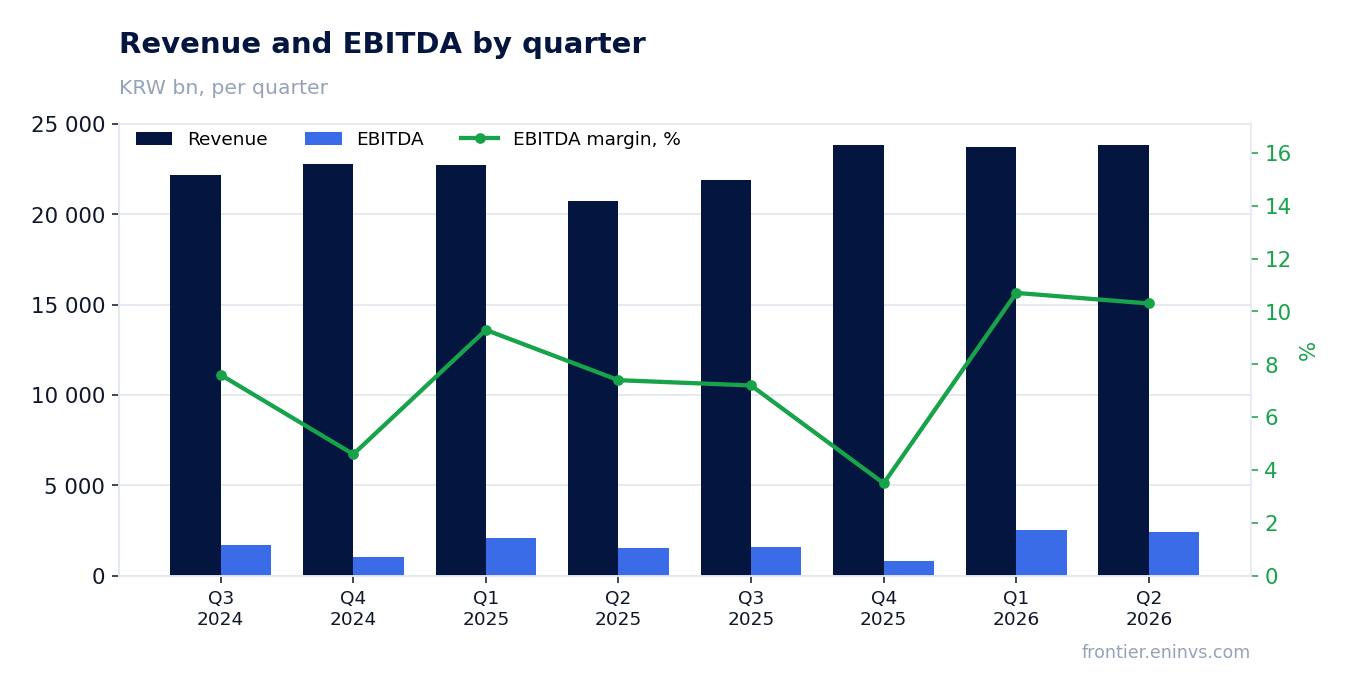
EBITDA margin jumped to 10.3% from 8.7% a year ago, driven by operating leverage
EBITDA in Q2 2026 grew 35.9% YoY to KRW 2,450bn, with EBITDA margin expanding to 10.3% from 8.7% a year ago. The margin improvement is driven by operating leverage: revenue is growing faster than operating expenses.
Sequential dynamics are also impressive: EBITDA rose 3.6% QoQ (from KRW 2,542bn in Q1 2026). This confirms the company is on a sustainable profitability growth path.
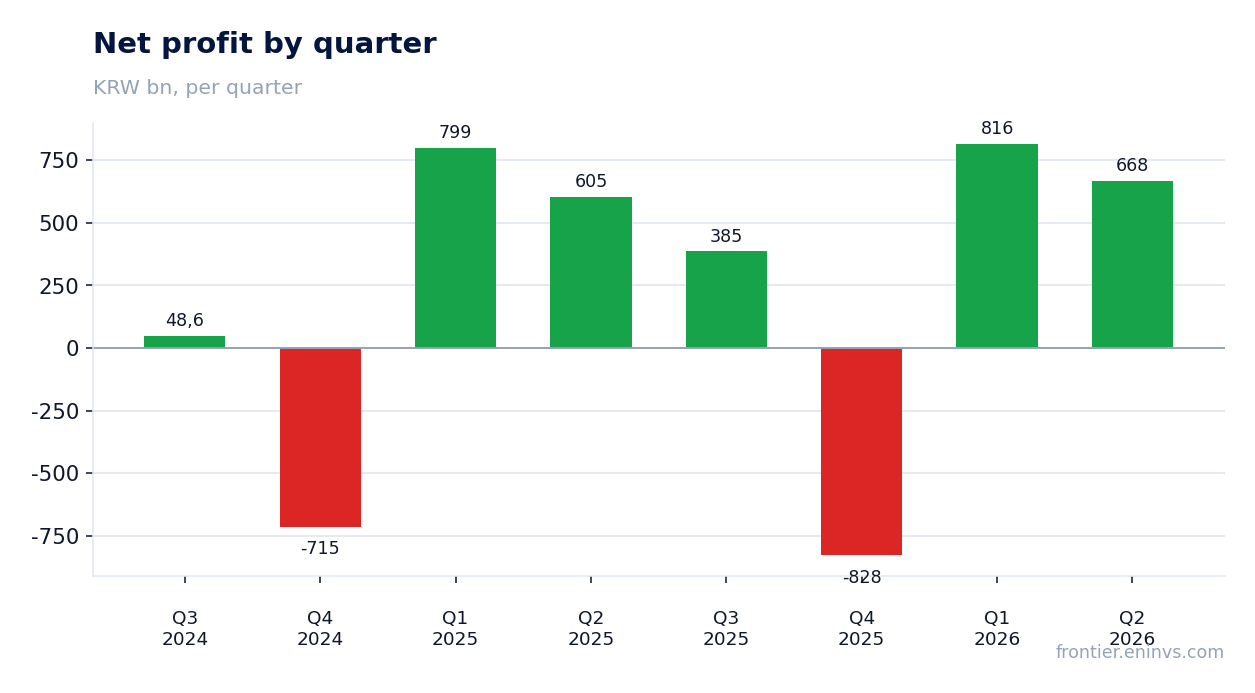
Net profit rose only 10.5% – higher taxes and financial expenses weighed
Net profit in Q2 2026 was KRW 668bn, up 10.5% YoY. Profit growth lags EBITDA dynamics significantly due to higher financial expenses and tax burden.
Net margin remained almost flat at 2.8% versus 2.9% a year ago. This indicates that operational efficiency is not yet fully translating into net profit.
Operating cash flow hit KRW 2,452bn, capex fell – free cash flow turned positive
Operating cash flow in Q2 2026 reached KRW 2,452bn – the best quarterly figure in two years. Capital expenditures declined to KRW 840bn from 821bn a year earlier.
As a result, free cash flow turned strongly positive – about KRW 1,612bn for the quarter. This allows the company to fund dividends and reduce debt without compromising investments.
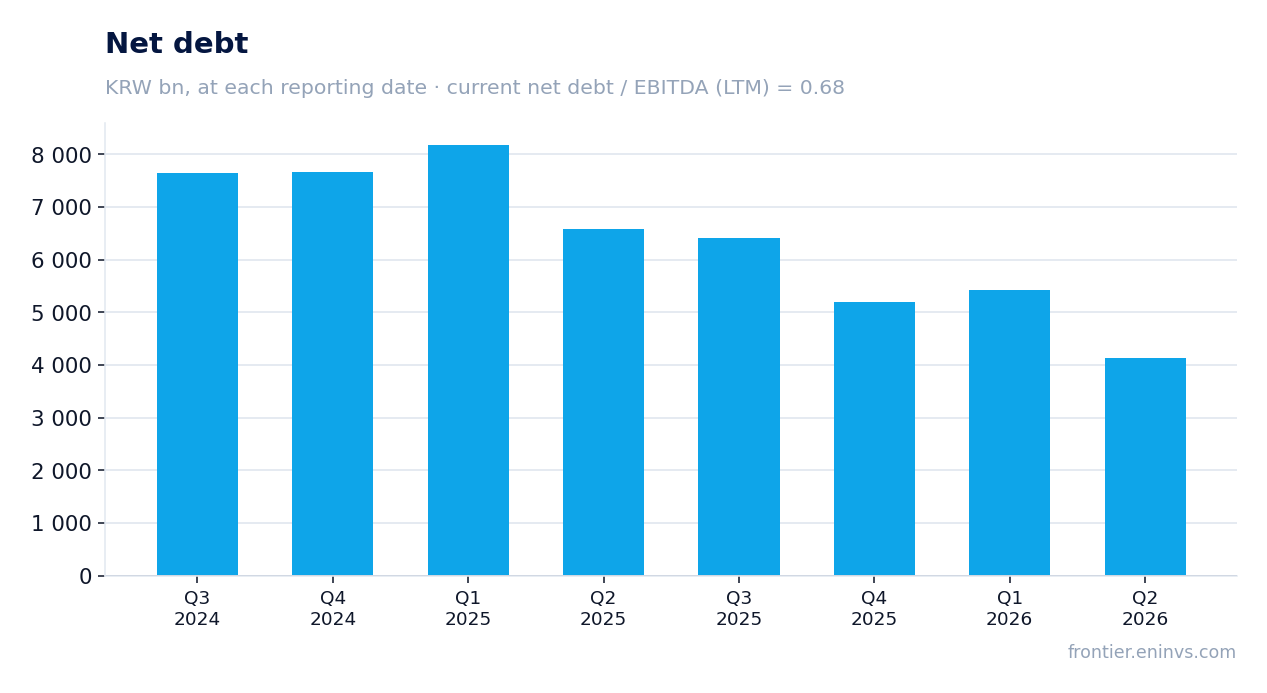
Net debt dropped to KRW 4,129bn – a two-year low, Net Debt/EBITDA at 0.68
At the end of Q2 2026, LG Electronics' net debt stood at KRW 4,129bn – the lowest level in two years. Debt fell by KRW 1,297bn during the quarter and by KRW 2,456bn over the last 12 months.
Net debt to EBITDA for the trailing twelve months is 0.68 – a very conservative level that gives the company significant financial flexibility. The debt reduction was driven by strong operating cash flow.
Dividend yield of 0.66% is below historical levels, but payouts are backed by cash flow
Over the last 12 months, LG Electronics paid dividends yielding 0.66% at the current price. This is below historical averages, reflecting both rising share price and a moderate dividend policy.
Nevertheless, payouts are fully covered by operating cash flow: trailing twelve-month OCF was KRW 4,280bn, many times the dividend amount. If current profit dynamics persist, the company can maintain or increase payments.
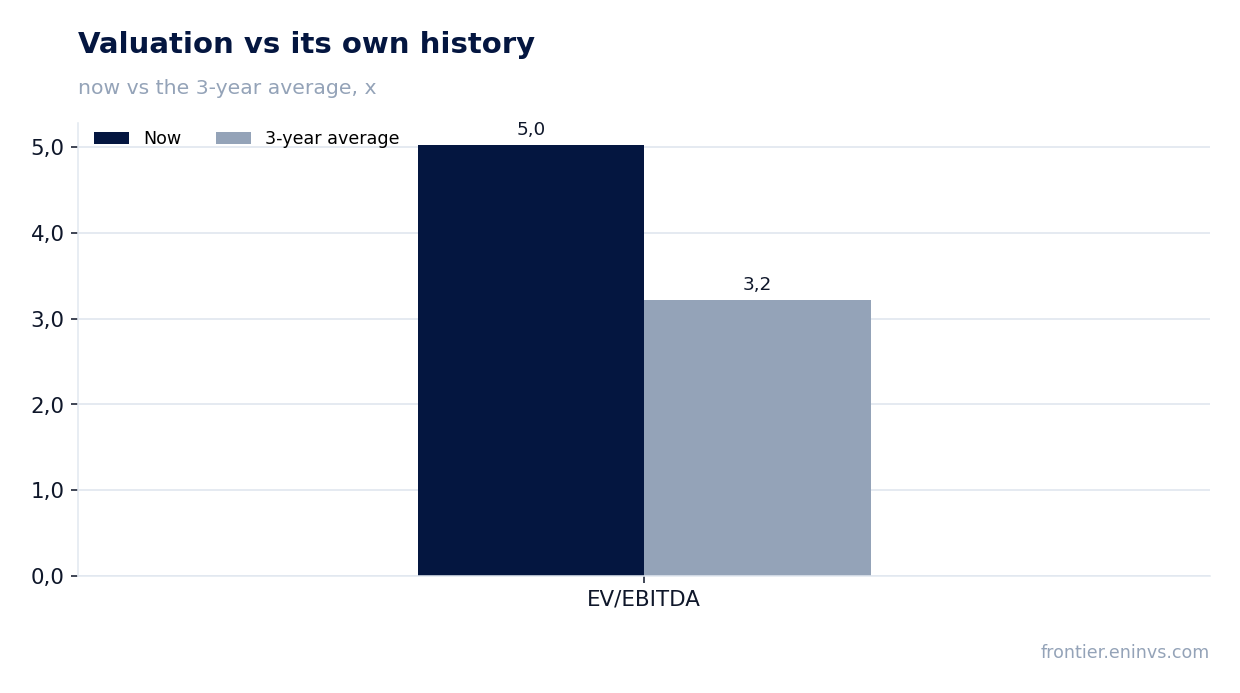
EV/EBITDA of 5.0x versus 3.2x three-year average – valuation above its own history
Current EV/EBITDA multiple is 5.0x – notably above the three-year average of 3.2x. The market is pricing in the acceleration of growth and margin improvement visible in the report.
Trailing P/E is 31.9x, also suggesting investor optimism about future earnings. According to the portal's model, the upside potential is +55% to fair value, indicating undervaluation given expected EBITDA growth.
Valuation on the latest reported figures
| Metric | Value |
|---|---|
| Market cap | 33 190 bn KRW |
| P/E (LTM) | 31.9 |
| EV/EBITDA (LTM) | 5.0 |
| P/B | 1.16 |
| Net debt / EBITDA (LTM) | 0.68 |
| Operating cash flow (LTM) | 4 280 bn |
| ROE | 8.6% |
| Dividend yield (12m) | 0.7% |
| EV/EBITDA, 3-year average | 3.2 |
Bottom line
The Q2 2026 report showed strong revenue acceleration (+14.9%) and significant EBITDA margin expansion to 10.3%. Operating cash flow hit a record KRW 2,452bn, allowing net debt to fall to a two-year low of KRW 4,129bn. However, net profit is growing slower due to taxes and financial expenses, and dividend yield remains modest at 0.66%. With EV/EBITDA of 5.0x versus 3.2x average, the shares no longer look cheap, but the portal's model indicates +55% upside. Verdict – 'rather attractive': the balance sheet is strong, growth is sustainable, but investors may want to wait for a more attractive entry point or confirmation of further margin improvement.
Open the company's financial profile 066570 →
See also: market overview · valuation map · stock screeners