KazMunayGas: profit up 90%, but operating cash flow nearly vanished
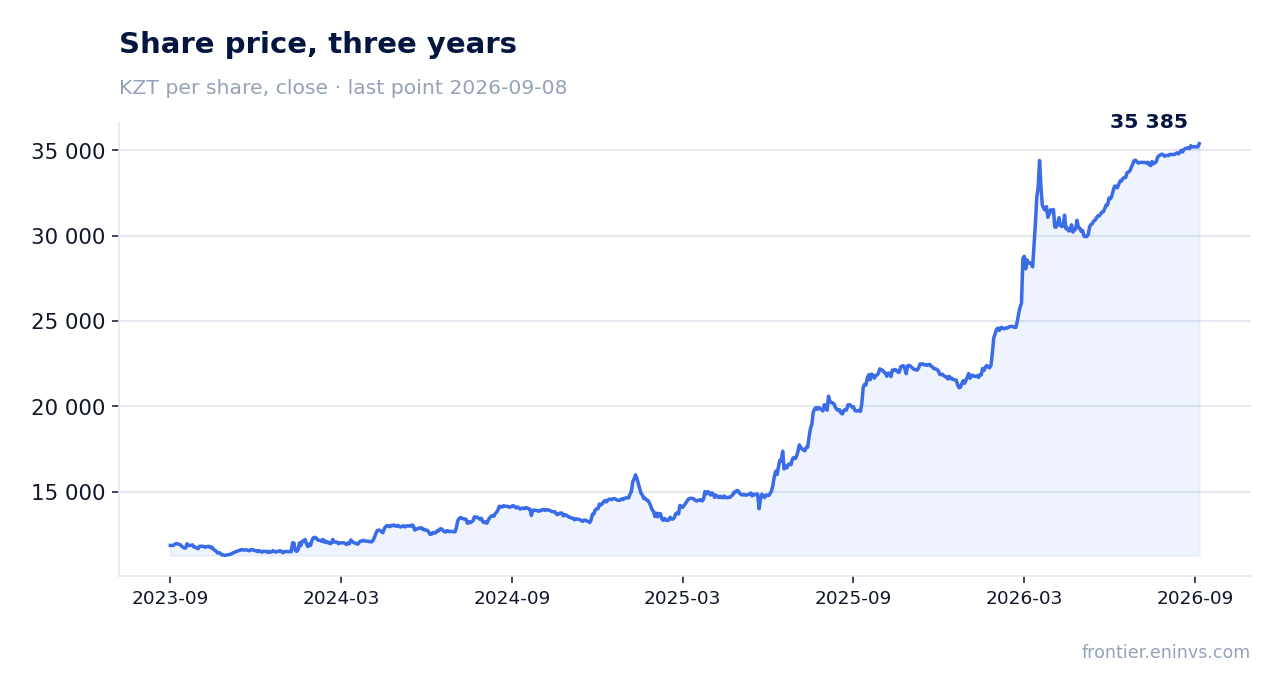
On May 29, 2026, KazMunayGas reported first-quarter 2026 results: revenue rose 10.7% to KZT 2,481 billion, net profit jumped 89.8% to KZT 373 billion. However, operating cash flow was just KZT 283 million versus KZT 427 billion a year earlier, and free cash flow turned negative at KZT 78 billion. At the current price, the share looks rather attractive: multiples are below their own history, and the portal's model implies +61% upside.
Key takeaways
— Net profit rose 89.8% to KZT 373 billion, but almost half – KZT 196 billion – is share in profits of joint ventures, not cash result
— Operating cash flow collapsed to KZT 283 million due to receivables growth and timing of TCO dividends shifted to April
— EBITDA grew 33% to KZT 775 billion, but adjusted EBITDA rose only 6.8% to KZT 591 billion
— Free cash flow turned negative: minus KZT 78 billion versus plus KZT 283 billion a year earlier
— Net debt rose 52.7% in the quarter to KZT 573 billion, but the ratio to EBITDA – 1.52 – remains moderate
— Dividend yield over 12 months is 1.63%, below the key rate, and payouts depend on cash flows from JVs
— On the portal's model, the share has +61% upside to fair value
Attractiveness
Key figures, KZT bn
| Metric | Q1 2025 | Q1 2026 | Change |
|---|---|---|---|
| Revenue | 2 241 | 2 481 | +10.7% |
| EBITDA | 318 | — | — |
| Operating profit | 137 | — | — |
| Net profit | 197 | 373 | +89.8% |
| Operating cash flow | 427 | 0.28 | -99.9% |
| EBITDA margin | 14.2% | — | — |
| Net margin | 8.8% | 15.0% | +6.2 pp |
Net profit rose 89.8% to KZT 373 billion, but almost half – KZT 196 billion – is share in profits of joint ventures, not cash result
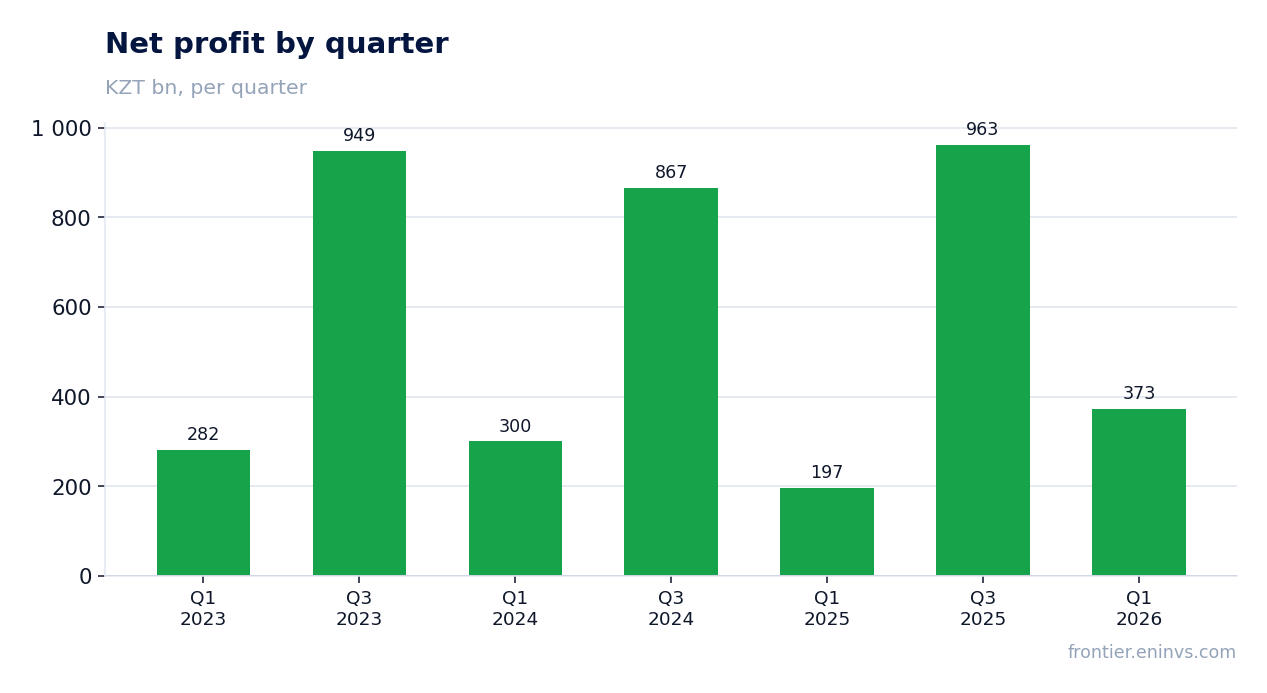
In Q1 2026, KazMunayGas's net profit reached KZT 373 billion versus KZT 193 billion a year earlier. The 89.8% growth was driven by higher revenue, higher share in profits of JVs and associates, lower impairment and finance costs.
However, KZT 196 billion of that is share in profits of joint ventures, mainly Tengizchevroil and Mangistaumunaigas. This is not cash flow but an accounting share. Excluding it, net profit would be KZT 190 billion, only 15.9% above last year's level.
Operating cash flow collapsed to KZT 283 million due to receivables growth and timing of TCO dividends shifted to April
Operating cash flow for Q1 2026 was just KZT 283 million versus KZT 427.5 billion a year earlier. The company attributes this to working capital changes, including higher receivables, and timing of dividend receipts from Tengizchevroil.
Dividends from TCO of KZT 140 billion were received after the reporting date, on April 29, 2026. In Q1 last year, KMG received KZT 156 billion from JVs. This is a one-off shift, but it heavily distorts the quarterly cash flow.
EBITDA grew 33% to KZT 775 billion, but adjusted EBITDA rose only 6.8% to KZT 591 billion
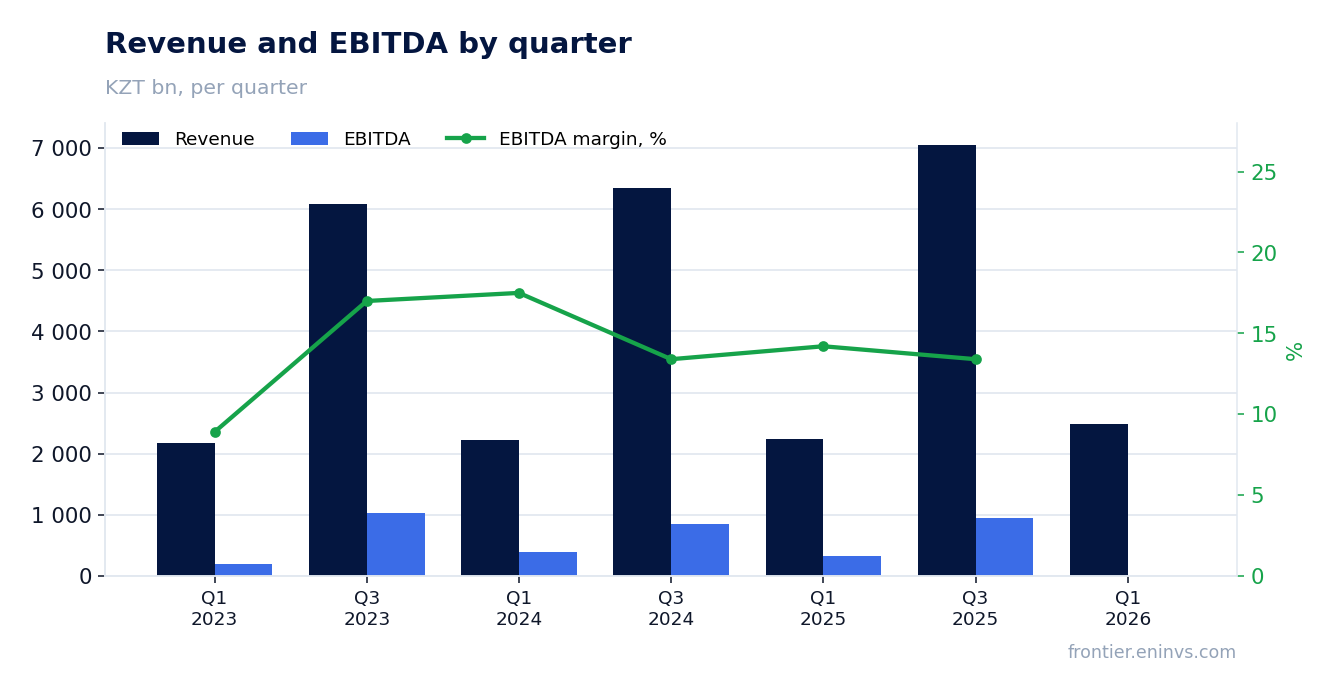
EBITDA for Q1 2026 was KZT 775 billion, 33% above last year. Growth was driven by higher revenue in all segments and higher share in profits of JVs.
However, adjusted EBITDA, which reflects dividends from JVs instead of share in their profits, rose only 6.8% to KZT 591 billion. The gap shows how much the result depends on the accounting share in JVs rather than actual cash received.
Free cash flow turned negative: minus KZT 78 billion versus plus KZT 283 billion a year earlier
Free cash flow in Q1 2026 was minus KZT 78 billion versus plus KZT 283 billion a year earlier. The reason is a sharp drop in operating cash flow and higher cash-basis capex of KZT 237 billion (+64.3%).
Accrual-basis capex, in contrast, fell 10% to KZT 116 billion. The gap is due to equipment purchases for subsidiaries, including KMG PetroChem and Kazakh Gas Processing Plant.
Net debt rose 52.7% in the quarter to KZT 573 billion, but the ratio to EBITDA – 1.52 – remains moderate
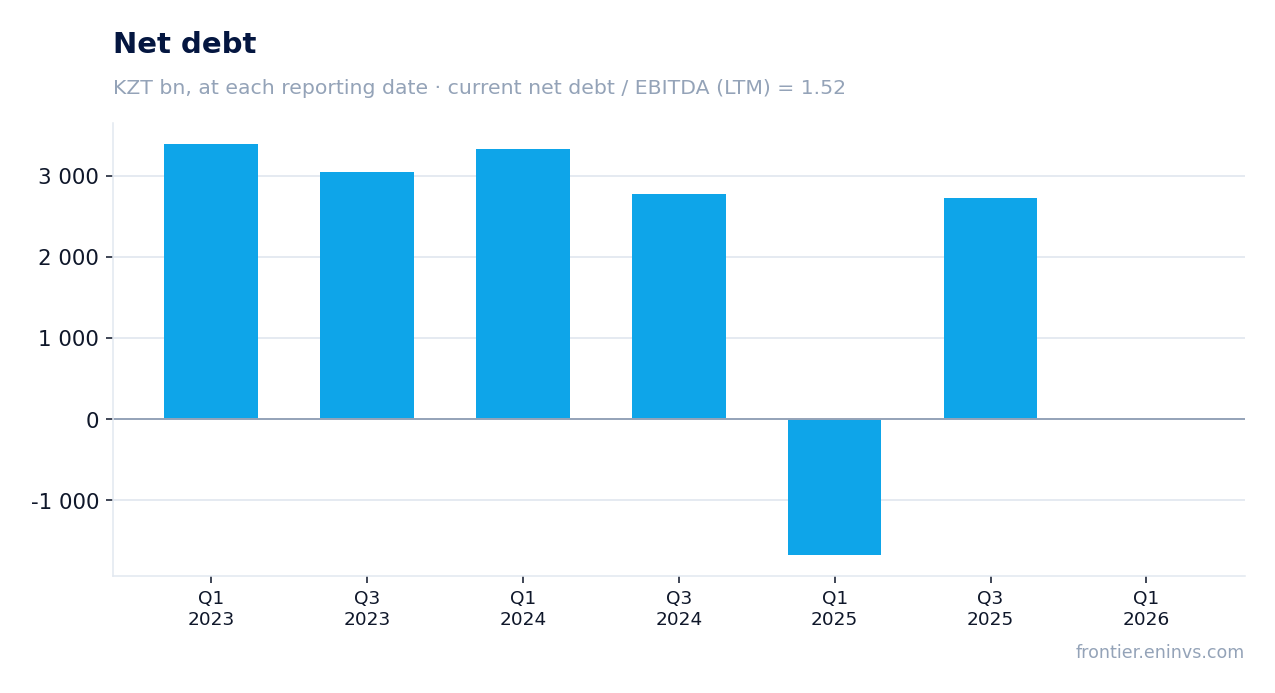
As of end-March 2026, KMG's net debt was KZT 573 billion versus KZT 375 billion at end-2025. The 52.7% increase is explained by lower cash and deposits, which were used to finance investment projects of subsidiaries, and by currency revaluation.
Net debt to EBITDA for the last twelve months is 1.52. This is a moderate level, though the direction of change is unknown – the earlier value was not provided. Gross debt was almost flat: KZT 3,504 billion versus KZT 3,522 billion.
Dividend yield over 12 months is 1.63%, below the key rate, and payouts depend on cash flows from JVs
Over the last 12 months, KMG's dividend yield was 1.63% – well below the key rate. This is typical for state-controlled companies but limits the share's appeal for income-oriented investors.
Payouts depend on cash flows, including dividends from JVs. In Q1 2026, KMG received only KZT 12 billion from JVs versus KZT 156 billion a year earlier – the main TCO payment came in April. If such shifts recur, free cash flow will be volatile, posing a risk to dividends.
On the portal's model, the share has +61% upside to fair value
Our model re-prices EBITDA at current oil prices and compares with a target EV/EBITDA multiple. On the portal's model, the share's upside to fair value is +61%.
Current multiples: P/E for the last twelve months is 18.7, EV/EBITDA is 15.5. These are moderate for a state-controlled oil company, especially with Brent averaging USD 81.1 per barrel in Q1 2026.
Valuation on the latest reported figures
| Metric | Value |
|---|---|
| Market cap | 23 312 bn KZT |
| P/E (LTM) | 18.7 |
| EV/EBITDA (LTM) | 15.5 |
| P/B | 1.87 |
| Net debt / EBITDA (LTM) | 1.52 |
| Operating cash flow (LTM) | 1 900 bn |
| ROE | 8.5% |
| Dividend yield (12m) | 1.6% |
Bottom line
The quarter is strong on accounting metrics: revenue and net profit grew double-digit, EBITDA rose a third. But operating cash flow nearly vanished, free cash flow turned negative, and half of the profit growth came from the share in JVs, which brought no cash this quarter. Debt is moderate, dividend yield is low. The key question for a holder is when JV cash flows will arrive evenly and whether the investment program will have to be debt-financed. At the current price and with +61% upside on the portal's model, the share looks rather attractive.
Open the company's financial profile KMGZ →
See also: market overview · valuation map · stock screeners