Arca Continental: выручка удвоилась во втором квартале 2026 года, но маржа сжалась на фоне разовых факторов

23 апреля 2026 года Arca Continental раскрыла результаты за первый квартал 2026 года, однако наш обзор охватывает и последний квартальный отчёт за второй квартал 2026 года, опубликованный позднее. Выручка во втором квартале выросла на 90,2% год к году, до 120 616 млн мексиканских песо, EBITDA – на 57,8%, до 20 216 млн, а чистая прибыль – на 59,9%, до 8 744 млн. При этом маржа EBITDA сократилась с 20,8% до 17,3%, что отражает разовые эффекты и давление на рентабельность. Акции торгуются с мультипликатором EV/EBITDA 6,4 против среднего за три года 7,3, что выглядит привлекательно, особенно с учётом дивидендной доходности 4,1% и потенциала роста по модели портала на 42%.
Главные тезисы
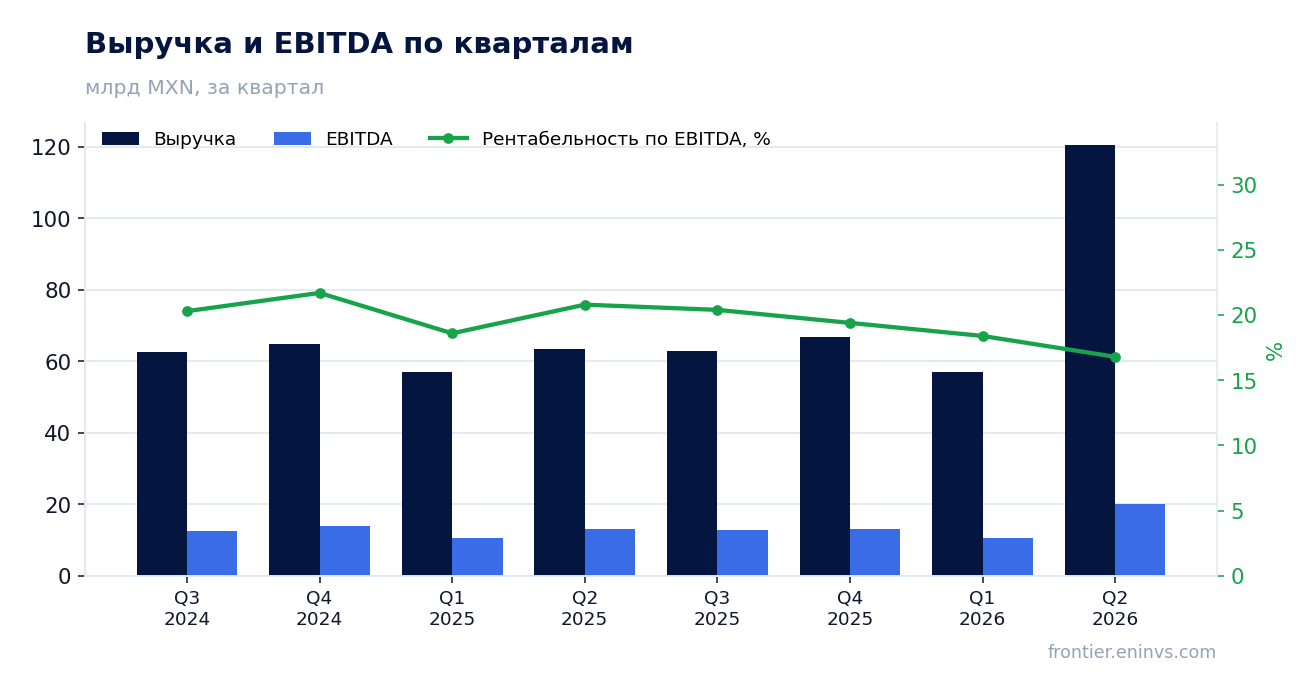
— Выручка во втором квартале 2026 года выросла на 90,2% год к году, что стало результатом консолидации новых активов и органического роста
— Маржа EBITDA снизилась с 20,8% до 17,3% из-за разовых факторов и роста затрат
— Чистая прибыль выросла на 59,9%, но темпы отстают от выручки из-за операционного рычага и финансовых расходов
— Долговая нагрузка составляет 0,6 EBITDA, что оставляет пространство для финансирования роста и дивидендов
— Капитальные затраты во втором квартале составили 2 854 млн песо, что ниже уровней прошлого года, поддерживая свободный денежный поток
— Дивидендная доходность за последние 12 месяцев – 4,1%, что выше средней по рынку и подкреплено денежным потоком
— По модели портала потенциал роста акции составляет 42%, что делает её привлекательной на текущих уровнях
Оценка привлекательности
Ключевые показатели, млрд MXN
| Показатель | Q2 2025 | Q2 2026 | Изм. |
|---|---|---|---|
| Выручка | 63,4 | 121 | +90,2% |
| EBITDA | 13,2 | 20,8 | +57,8% |
| Операционная прибыль | 10,7 | 17,5 | +63,6% |
| Чистая прибыль | 5,47 | 8,74 | +59,9% |
| Операционный денежный поток | 9,73 | 9,02 | -7,3% |
| Капзатраты | 4,63 | 2,85 | -38,3% |
| Рентабельность по EBITDA | 20,8% | 17,3% | -3,5 п.п. |
| Чистая маржа | 8,6% | 7,2% | -1,4 п.п. |
Выручка во втором квартале 2026 года выросла на 90,2% год к году, что стало результатом консолидации новых активов и органического роста
Во втором квартале 2026 года выручка Arca Continental составила 120 616 млн песо, что на 90,2% больше, чем за тот же квартал годом ранее. Такой скачок связан с включением в периметр новых активов, а также с органическим ростом объёмов и цен. Для сравнения, в первом квартале 2026 года рост был всего 0,2%, что подчёркивает разовый характер ускорения.
Поквартальная динамика также показывает, что во втором квартале 2026 года выручка почти вдвое превысила уровень предыдущего квартала (57 128 млн песо в первом квартале). Это указывает на значительные изменения в консолидации или сезонные факторы, которые требуют дальнейшего анализа.
Маржа EBITDA снизилась с 20,8% до 17,3% из-за разовых факторов и роста затрат
Во втором квартале 2026 года маржа EBITDA составила 17,3%, что заметно ниже 20,8% годом ранее. Это снижение отражает давление на рентабельность, несмотря на значительный рост выручки. Причины включают разовые статьи, рост себестоимости и операционных расходов, а также возможные эффекты консолидации новых активов с более низкой маржой.
В первом квартале 2026 года маржа EBITDA была 18,6%, что также ниже 18,7% в первом квартале 2025 года. Таким образом, тренд на сжатие маржи прослеживается и в последних кварталах, что может быть связано с конкурентным давлением и инфляцией затрат.
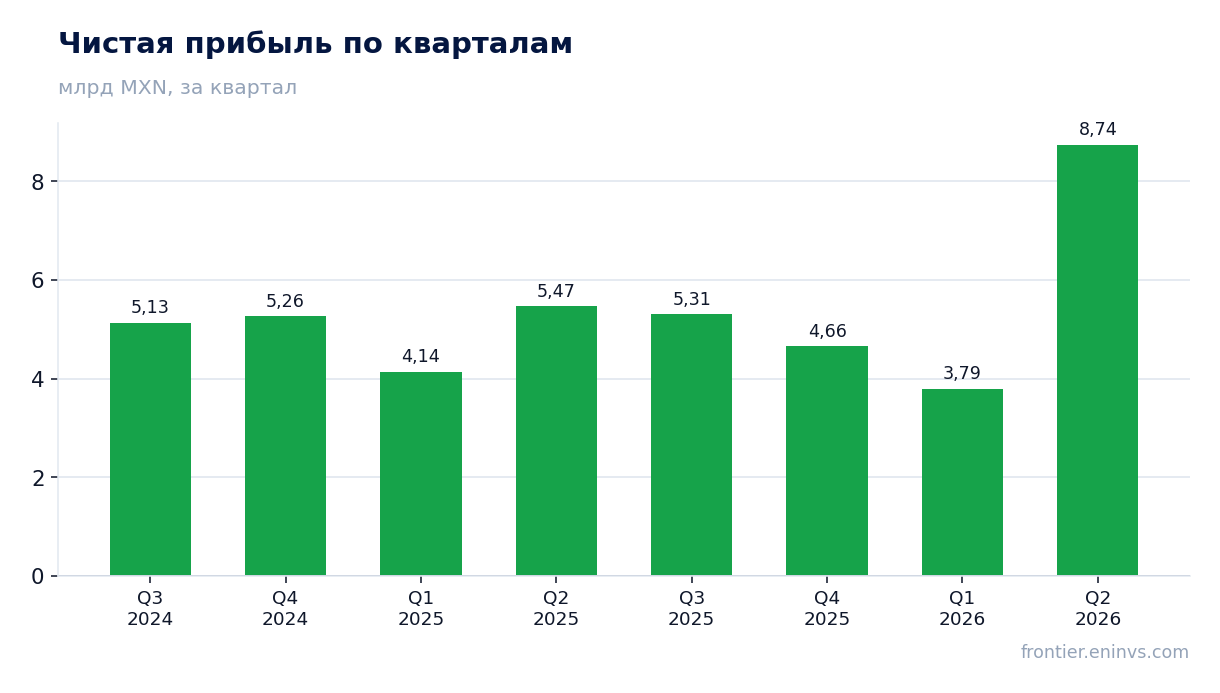
Чистая прибыль выросла на 59,9%, но темпы отстают от выручки из-за операционного рычага и финансовых расходов
Чистая прибыль во втором квартале 2026 года достигла 8 744 млн песо, увеличившись на 59,9% год к году. Однако темпы роста прибыли значительно ниже роста выручки (90,2%), что объясняется снижением операционной маржи и ростом финансовых расходов. В первом квартале 2026 года чистая прибыль снизилась на 8,5% год к году, что указывает на волатильность.
За последние двенадцать месяцев чистая прибыль составила 22 504 млн песо, что даёт коэффициент P/E 14,4. Это умеренный уровень для компании с растущей выручкой, но сжатие маржи требует внимания.
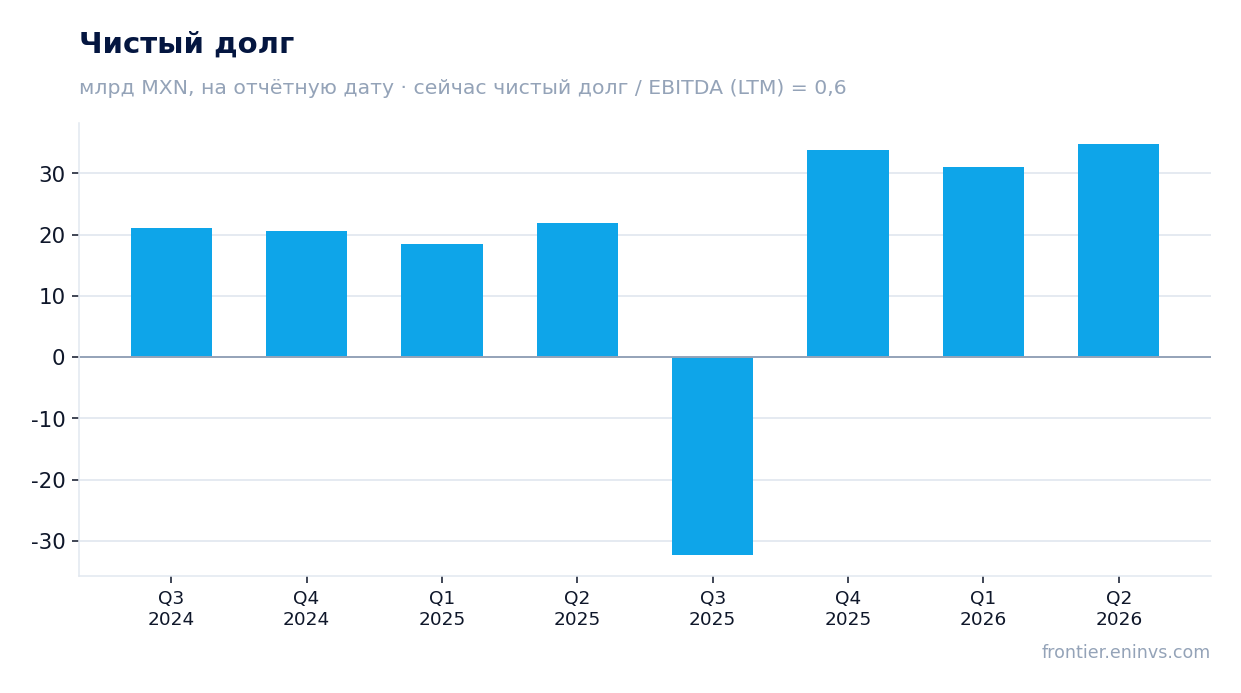
Долговая нагрузка составляет 0,6 EBITDA, что оставляет пространство для финансирования роста и дивидендов
На конец второго квартала 2026 года чистый долг составил 33 768 млн песо, что соответствует 0,6 EBITDA за последние двенадцать месяцев. Это низкий уровень долговой нагрузки, который даёт компании финансовую гибкость для инвестиций и выплаты дивидендов.
За квартал чистый долг вырос на 3,7 млрд песо, а за последние 12 месяцев – на 13,0 млрд песо, что отражает финансирование капитальных затрат и возможные приобретения. Тем не менее, коэффициент остаётся комфортным.
Капитальные затраты во втором квартале составили 2 854 млн песо, что ниже уровней прошлого года, поддерживая свободный денежный поток
Во втором квартале 2026 года капитальные затраты составили 2 854 млн песо, что ниже 4 629 млн песо во втором квартале 2025 года. Это снижение, вероятно, связано с завершением некоторых инвестиционных проектов и фокусом на эффективности.
Операционный денежный поток за квартал составил 9 022 млн песо, что покрывает капитальные затраты с запасом. За последние двенадцать месяцев операционный денежный поток достиг 37 700 млн песо, обеспечивая свободный денежный поток после инвестиций.
Дивидендная доходность за последние 12 месяцев – 4,1%, что выше средней по рынку и подкреплено денежным потоком
За последние двенадцать месяцев дивидендная доходность Arca Continental составила 4,1%, что является привлекательным уровнем для акционеров. Дивиденды подкреплены стабильным операционным денежным потоком и низкой долговой нагрузкой.
В первом квартале 2026 года компания выплатила дивиденд в размере 4,28 песо на акцию, что соответствует коэффициенту выплат 37% от нераспределённой прибыли. Это демонстрирует сбалансированный подход к распределению капитала.
По модели портала потенциал роста акции составляет 42%, что делает её привлекательной на текущих уровнях
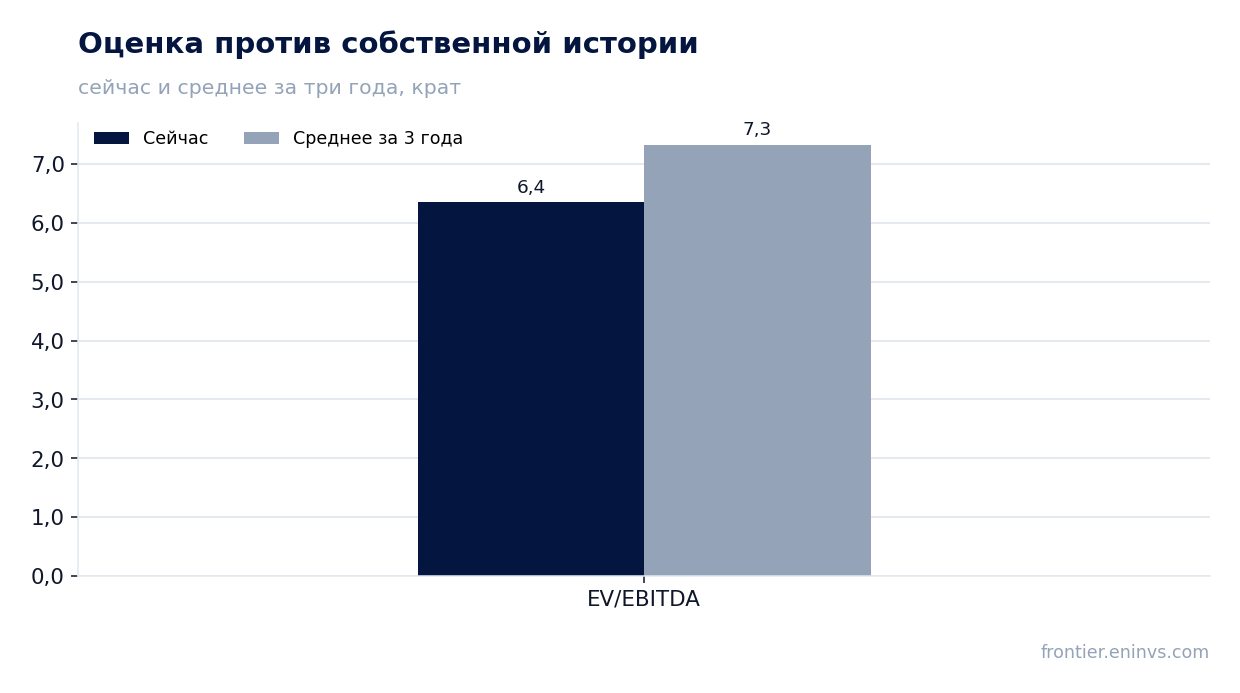
Согласно модели портала, основанной на росте EBITDA и целевом мультипликаторе, потенциал роста акции составляет 42% от текущей рыночной капитализации. Это указывает на то, что рынок не полностью оценивает перспективы компании.
Текущий мультипликатор EV/EBITDA составляет 6,4, что ниже среднего за три года (7,3). Это говорит о том, что акция торгуется с дисконтом к своей собственной истории, что создаёт потенциал для переоценки.
Оценка по последним отчётным данным
| Метрика | Значение |
|---|---|
| Капитализация | 324 млрд MXN |
| P/E (LTM) | 14,4 |
| EV/EBITDA (LTM) | 6,4 |
| P/B | 1,99 |
| Чистый долг / EBITDA | 0,60 |
| Операционный денежный поток (LTM) | 37,7 млрд |
| ROE | 24,1% |
| Дивидендная доходность (12 мес) | 4,1% |
| EV/EBITDA, среднее за 3 года | 7,3 |
Итог
Итог: Arca Continental показала впечатляющий рост выручки во втором квартале 2026 года (+90,2%), но этот рост сопровождался снижением маржинальности и отставанием чистой прибыли. Компания сохраняет низкую долговую нагрузку (0,6 EBITDA) и генерирует достаточный денежный поток для покрытия капзатрат и выплаты дивидендов. Акция торгуется с дисконтом к собственной истории (EV/EBITDA 6,4 против 7,3 в среднем за три года), что вместе с дивидендной доходностью 4,1% и потенциалом по модели портала (+42%) делает её привлекательной. Однако ключевой вопрос для держателей – сможет ли компания стабилизировать маржу и обеспечить органический рост после завершения интеграционных эффектов.
Перейти к финансовой карточке компании AC →
Смотрите также: обзор рынка · карта оценки рынков · скринеры акций