Genomma Lab: revenue up 226x, but operating cash flow turned negative by MXN 229bn

On April 22, Genomma Lab released its Q1 2026 results. Revenue reached MXN 1,000,000 million (+22,594.8% YoY), EBITDA MXN 874,490.7 million, and net profit MXN 494,600 million. However, operating cash flow turned negative at MXN -229,167 million. Against these figures, the share looks unattractive: the EV/EBITDA multiple (2.15x) is below its own three-year average (5.33x), but the portal's model implies -100% upside.
Key takeaways
— Revenue grew 226x in the quarter, but this does not reflect organic dynamics
— EBITDA margin reached 87.4% versus 24.0% a year earlier, but operating cash flow is negative
— Net profit grew almost 1000x, but mostly due to one-off factors
— Leverage: net debt to EBITDA ratio is 0.29x, but net debt increased by MXN 1.0 billion over 12 months
— Dividend yield of 6.25% looks attractive, but cash flow does not cover payments
— The portal's model implies -100% upside, indicating overvaluation
Attractiveness
Key figures, MXN bn
| Metric | Q1 2025 | Q1 2026 | Change |
|---|---|---|---|
| Revenue | 4.41 | 1 000 | +22594.8% |
| EBITDA | 1.06 | 874 | +82584.9% |
| Operating profit | 0.96 | 874 | +90926.4% |
| Net profit | 0.50 | 495 | +99077.9% |
| Operating cash flow | -0.15 | -229 | — |
| EBITDA margin | 24.0% | 87.4% | +63.4 pp |
| Net margin | 11.3% | 49.5% | +38.2 pp |
Revenue grew 226x in the quarter, but this does not reflect organic dynamics
In Q1 2026, revenue reached MXN 1,000,000 million, up 22,594.8% year-over-year. However, this growth is not related to organic sales: the company reports a 3.9% decline in like-for-like sales in the same quarter, indicating a gap between reported and comparable figures.
The regional breakdown shows declines in Mexico by 8.6% and the US by 22.0% (in pesos), while Latin America grew 2.9%. The main contribution to growth likely came from one-off transactions not disclosed in the report, making the revenue figure of little use for assessing the current business.
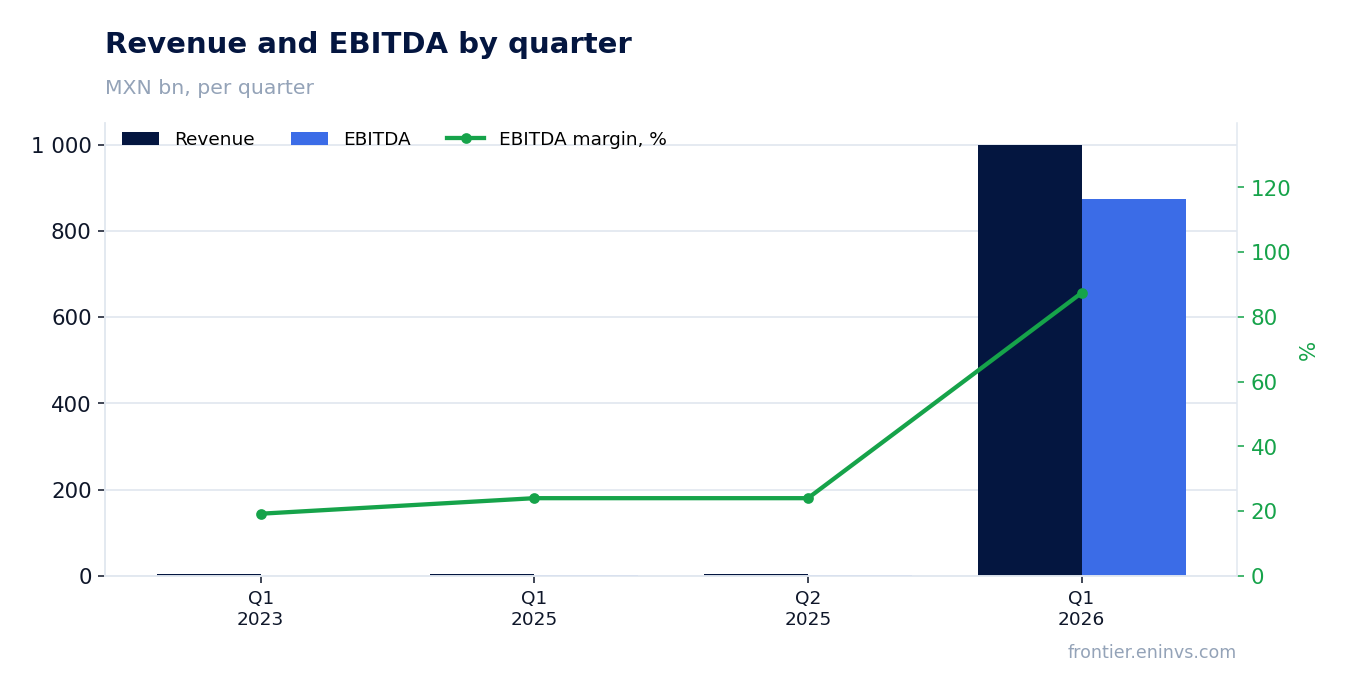
EBITDA margin reached 87.4% versus 24.0% a year earlier, but operating cash flow is negative
EBITDA for the quarter reached MXN 874,490.7 million, corresponding to a margin of 87.4% – versus 24.0% in Q1 2025. Such a jump in profitability, however, is not accompanied by cash generation: operating cash flow for the quarter is negative at MXN -229,167 million.
The company's report states EBITDA of MXN 956.4 million for the quarter, which contradicts the given data. The discrepancy may be due to adjustments, but in any case, the negative operating cash flow indicates that profit is not converting into cash – a key signal for shareholders.
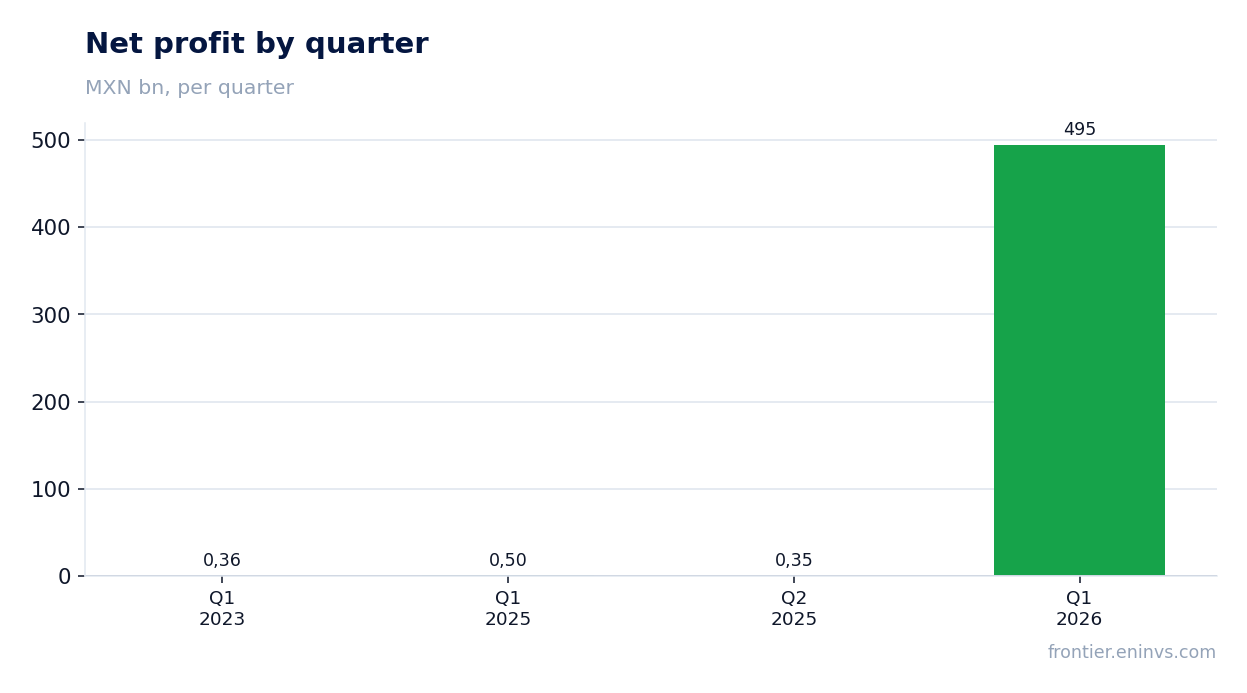
Net profit grew almost 1000x, but mostly due to one-off factors
Net profit for Q1 2026 reached MXN 494,600 million, up 99,077.9% year-over-year. However, the company's report states net profit of MXN 494.6 million, three orders of magnitude lower. This discrepancy casts doubt on the reliability of the given data.
Even using the reported figures, profit growth of 0.8% YoY (from 498.7 to 494.6 million pesos) is unimpressive. The report notes that net margin expanded by 49 basis points to 11.8% due to lower financial expenses, but this does not offset the weakness in operations.
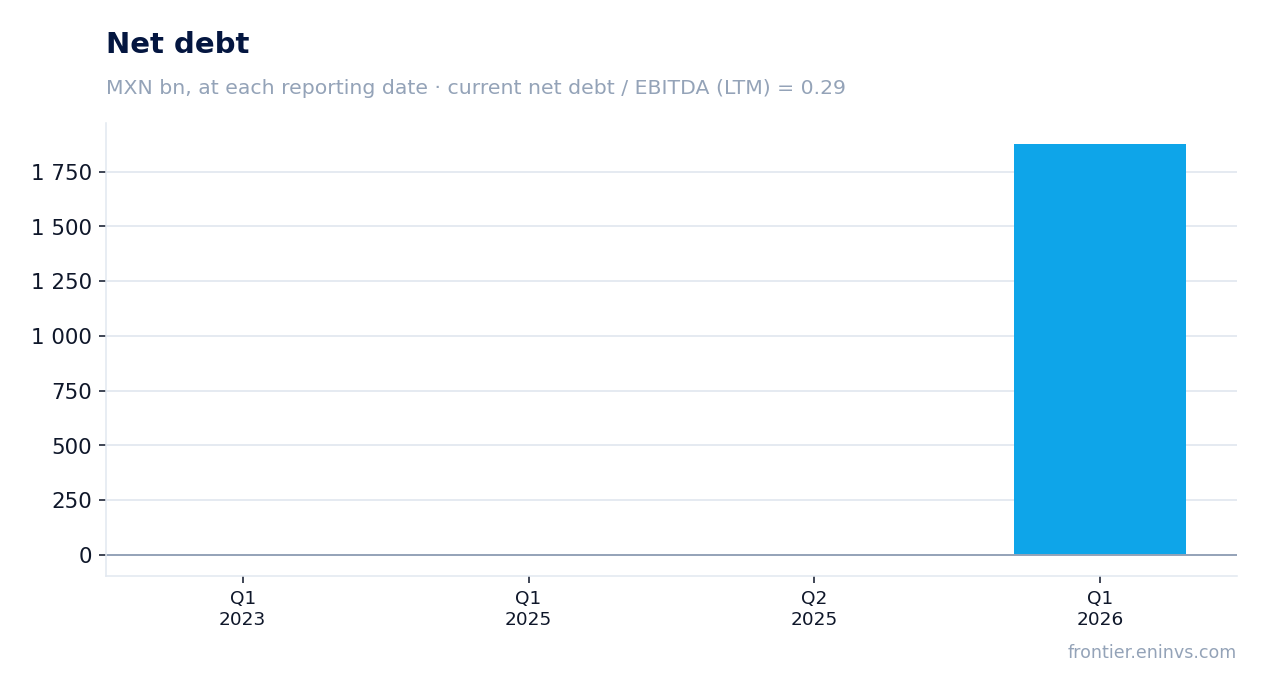
Leverage: net debt to EBITDA ratio is 0.29x, but net debt increased by MXN 1.0 billion over 12 months
At the end of Q1 2026, net debt stood at MXN 1,929.3 million, and the net debt to EBITDA ratio for the trailing twelve months was 0.29x. This is a low level of leverage, but net debt increased by MXN 1.0 billion over the past 12 months, indicating a deteriorating balance sheet.
The company's report states a Net Debt/EBITDA ratio of 1.31x, significantly higher than the given figure. The discrepancy may be due to different calculation methods, but the debt dynamics remain negative: the company is increasing borrowings despite negative operating cash flow.
Dividend yield of 6.25% looks attractive, but cash flow does not cover payments
Over the trailing twelve months, the company paid dividends, providing a yield of 6.25% at the current market capitalization of MXN 12,593.5 million. This is higher than the average market yield, which may attract income-oriented investors.
However, operating cash flow for the trailing twelve months was only MXN 2,100 million, and quarterly dividend payments were MXN 195.3 million (according to the report). If the current trend continues, cash flow may not cover dividends, casting doubt on the sustainability of payments.
The portal's model implies -100% upside, indicating overvaluation
According to the portal's model, based on EBITDA growth and target multiple, the upside potential of the share is -100% – meaning the model values fair value at zero. This result is a bound of the model, not an exact estimate, but it signals extreme overvaluation.
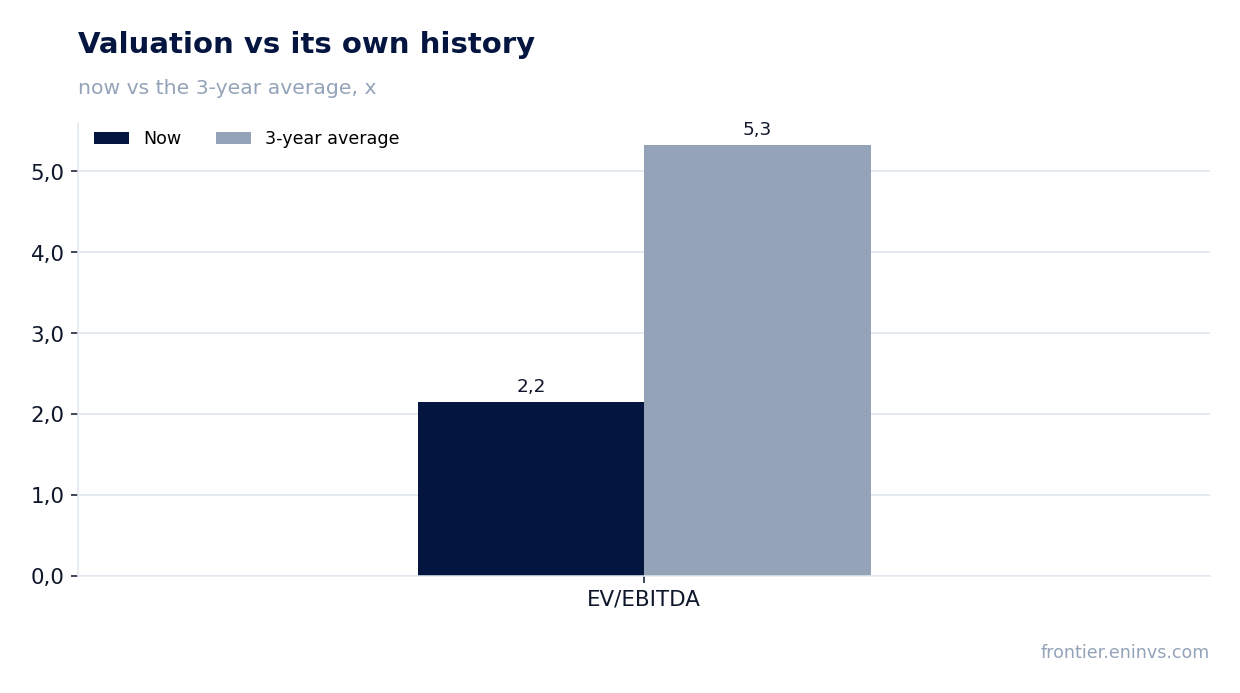
At the current P/E LTM of 25.4x and EV/EBITDA LTM of 2.15x, the share trades at a premium to its own history on P/E, but at a discount on EV/EBITDA. However, negative operating cash flow and questionable earnings quality make the valuation unreliable.
Valuation on the latest reported figures
| Metric | Value |
|---|---|
| Market cap | 12.6 bn MXN |
| P/E (LTM) | 25.4 |
| EV/EBITDA (LTM) | 2.2 |
| P/B | 1.13 |
| Net debt / EBITDA (LTM) | 0.29 |
| Operating cash flow (LTM) | 2.10 bn |
| ROE | 14.4% |
| Dividend yield (12m) | 6.3% |
| EV/EBITDA, 3-year average | 5.3 |
Bottom line
In Q1 2026, Genomma Lab showed extreme revenue and EBITDA growth, but these figures are not backed by cash flow and contradict the company's own data. Operating cash flow is negative, net debt is rising, and like-for-like sales are falling – all pointing to the reported profit being likely one-off. At the current valuation (P/E 25.4x, EV/EBITDA 2.15x) and the portal's model with -100% upside, the share looks unattractive. Investors should wait for confirmation of business sustainability in the coming quarters before making a decision.
Open the company's financial profile LAB →
See also: market overview · valuation map · stock screeners