NCSP: revenue stagnates, EBITDA down 20%, but net profit rises on FX gains and finance income
1 июня 2026 года НМТП раскрыл промежуточную сокращённую консолидированную финансовую отчётность за первый квартал 2026 года. Выручка практически не изменилась – 19 829 млн руб. против 19 826 млн руб. годом ранее, EBITDA сократилась на 20% до 12 830 млн руб., а чистая прибыль выросла на 3% до 10 734 млн руб.. В обзоре разберём, что скрывается за этими цифрами: рост операционных расходов, влияние курсовых разниц и финансовых доходов, а также оценим дивидендную привлекательность и справедливую стоимость акций.
Key takeaways
— Revenue stagnated, but the mix shifted: stevedoring slightly down, fleet and other services up
— EBITDA fell 20% due to higher operating expenses, including one-off receivables assignment charges
— Net profit rose thanks to FX gains and finance income, offsetting weak operating results
— Leverage remains low: net debt is negative, and net debt/EBITDA stands at -0.26
— Capex almost tripled, but cash flow remains positive
— Dividend yield of 17.2% is well above our expectations, but the payout ratio may be unsustainable
— Shares trade at a discount to their own history: EV/EBITDA of 2.05 vs 3.79 three-year average
Key figures, RUB bn
| Metric | Q1 2025 | Q1 2026 | Change |
|---|---|---|---|
| Revenue | 19.8 | 19.8 | +0.0% |
| EBITDA | 16.0 | 12.8 | -20.0% |
| Operating profit | 14.5 | 11.3 | -21.9% |
| Net profit | 10.4 | 10.7 | +3.0% |
| Operating cash flow | 9.11 | 8.74 | -4.1% |
| Capex | 2.08 | 5.42 | +160.9% |
| EBITDA margin | 80.9% | 64.7% | -16.2 pp |
| Net margin | 52.6% | 54.1% | +1.5 pp |
Revenue stagnated, but the mix shifted: stevedoring slightly down, fleet and other services up
In Q1 2026, NCSP's revenue amounted to RUB 19,829 million, almost unchanged from a year earlier (RUB 19,826 million). However, the mix shifted: revenue from stevedoring and additional port services declined 1.1% to RUB 18,899 million, while fleet services rose 17.8% to RUB 674 million and other services jumped 77.8% to RUB 256 million.
Thus, stagnation at the total revenue level masks divergent trends across segments. The stevedoring business, which generates the bulk of income, is under pressure, while auxiliary segments are growing. This may reflect changes in cargo flows and client structure, but overall the top line has remained flat for several consecutive quarters.
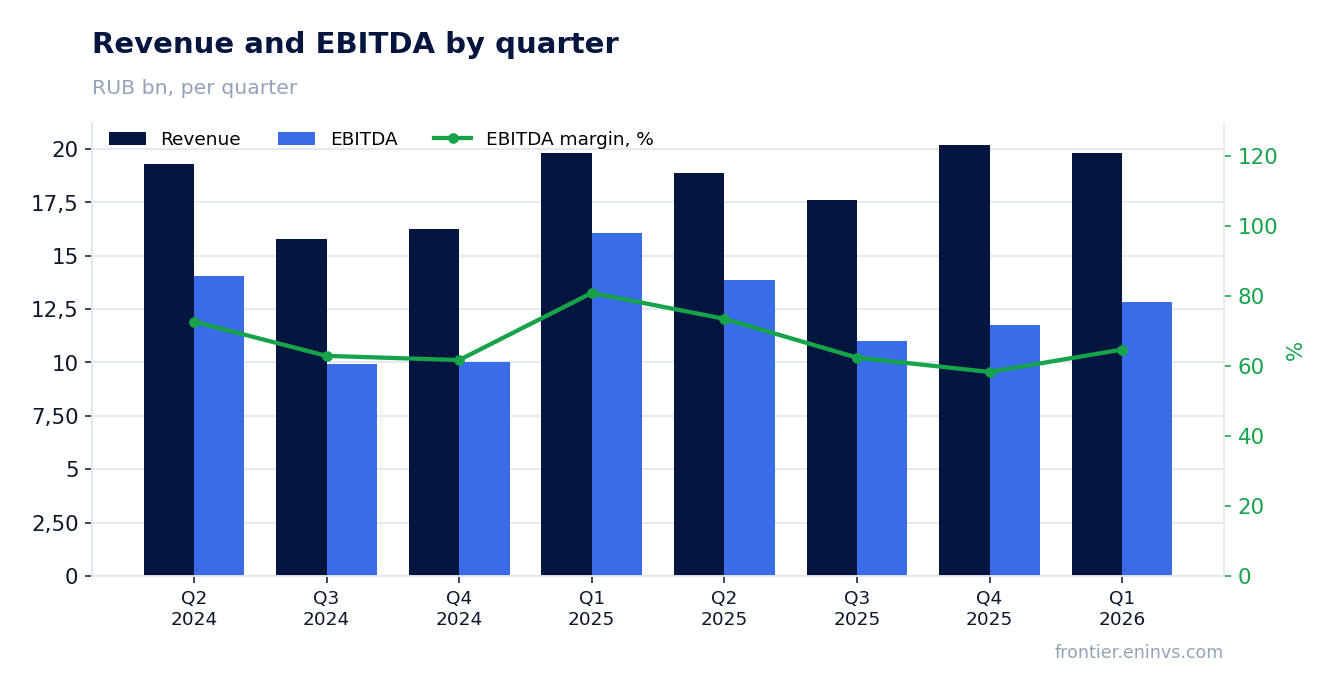
EBITDA fell 20% due to higher operating expenses, including one-off receivables assignment charges
EBITDA for Q1 2026 stood at RUB 12,830 million, down 20% from a year earlier (RUB 16,045 million). Operating expenses excluding depreciation rose from RUB 3,781 million to RUB 6,999 million, with a significant portion related to receivables assignment charges – RUB 375 million versus a negative figure last year (minus RUB 1,957 million).
Employee compensation expenses also increased from RUB 2,239 million to RUB 3,399 million, possibly reflecting salary indexation and headcount growth. As a result, EBITDA margin declined from 80.9% to 64.7%, a significant deterioration in operating efficiency.
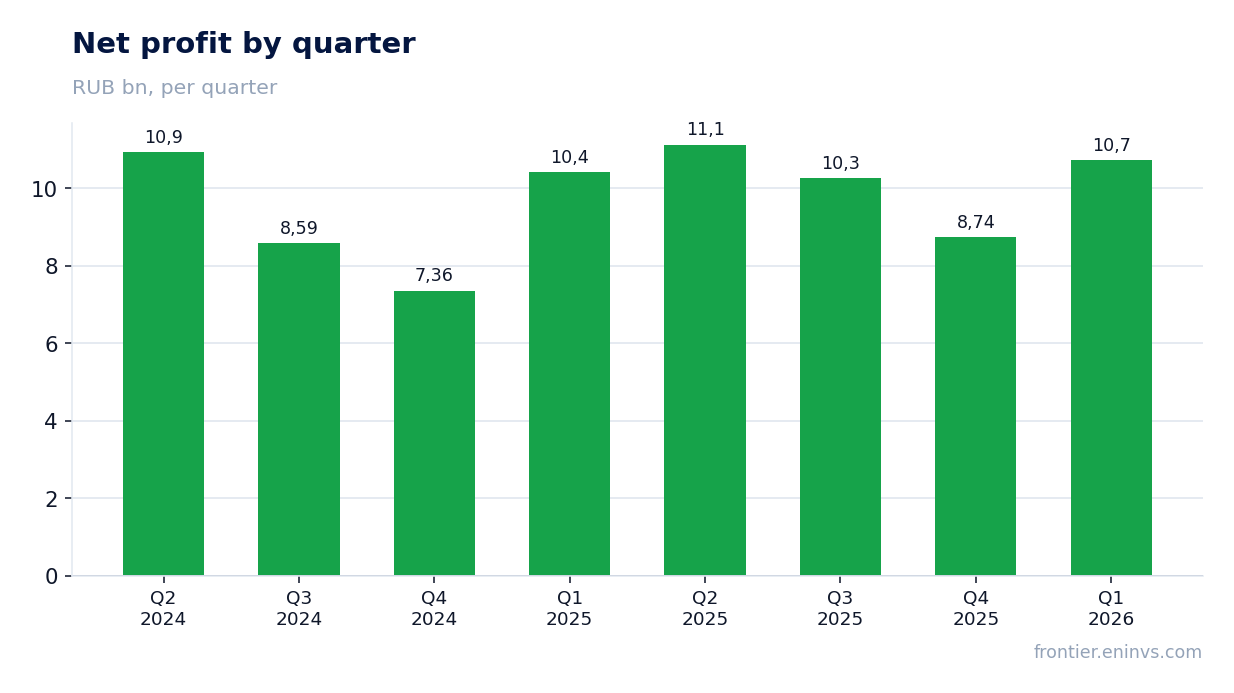
Net profit rose thanks to FX gains and finance income, offsetting weak operating results
Net profit for Q1 2026 amounted to RUB 10,734 million, up 3% from a year earlier (RUB 10,422 million). The growth was mainly driven by positive FX differences – RUB 390 million versus a loss of RUB 2,497 million last year, as well as stable finance income of RUB 2,582 million.
Excluding these items, operating profit declined from RUB 14,474 million to RUB 11,303 million, reflecting deterioration in the core business. Nevertheless, net margin rose from 52.6% to 54.1% thanks to effective management of financial flows and tax burden.
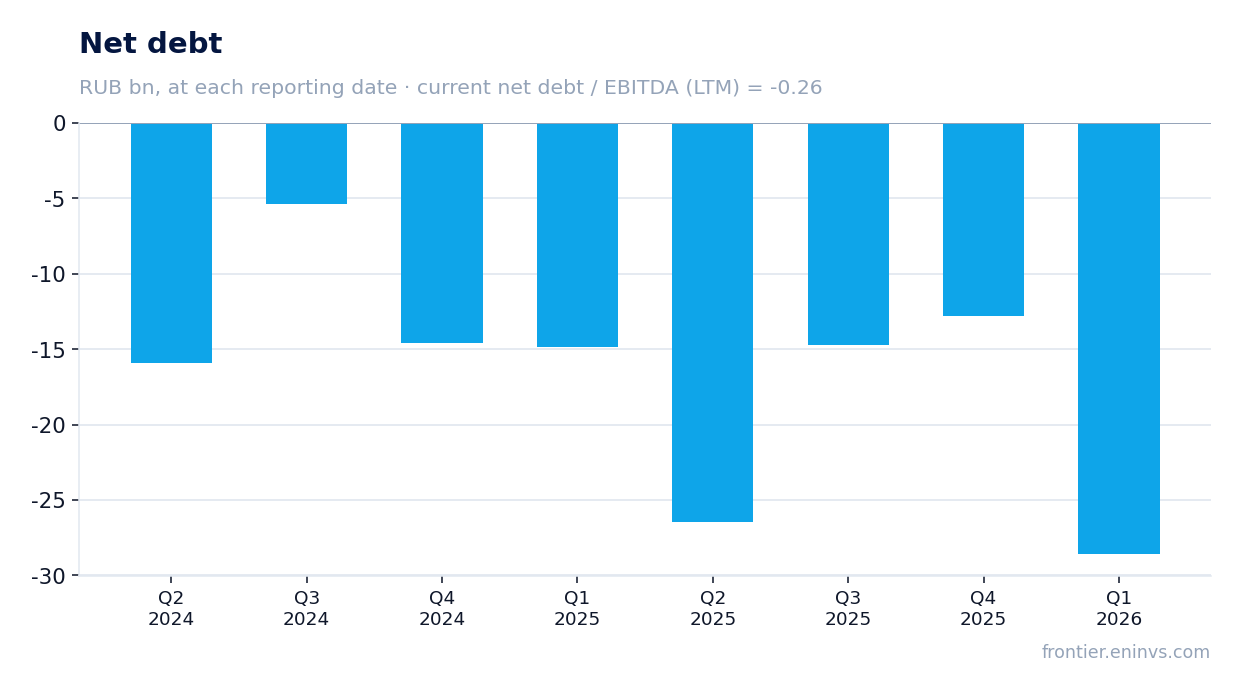
Leverage remains low: net debt is negative, and net debt/EBITDA stands at -0.26
At the end of Q1 2026, NCSP's net debt stood at RUB -14,555 million, meaning the company has a net cash position. The net debt/EBITDA ratio for the trailing twelve months is -0.26, indicating extremely low leverage.
During the quarter, net debt decreased by RUB 13.6 billion, and over the last 12 months by RUB 13.5 billion. This was driven by strong operating cash flow and placement of funds on deposits. Interest expenses for the quarter amounted to RUB 584 million, easily covered by finance income.
Capex almost tripled, but cash flow remains positive
Capex in Q1 2026 amounted to RUB 5,419 million versus RUB 2,077 million a year earlier – a 2.6-fold increase. The bulk is related to acquisitions of property, plant and equipment and construction in progress, including advances under the concession agreement.
Despite higher investments, operating cash flow remained positive – RUB 8,741 million versus RUB 9,114 million last year. Free cash flow after capex stands at about RUB 3.3 billion, allowing investments to be funded without taking on debt.
Dividend yield of 17.2% is well above our expectations, but the payout ratio may be unsustainable
Over the last 12 months, NCSP paid dividends of RUB 1.1448 per share, providing a yield of 17.2% at the current price. Our model estimates the next payment at RUB 1.14 per share, also implying a forward yield of 17.2%.
However, the payout ratio is 0.41 of profit, leaving a significant portion of earnings for investments. Meanwhile, the fair yield for this stock, in our view, is 10.5%, well below the current level. This may indicate that the market is pricing in lower dividends or deteriorating financial performance.
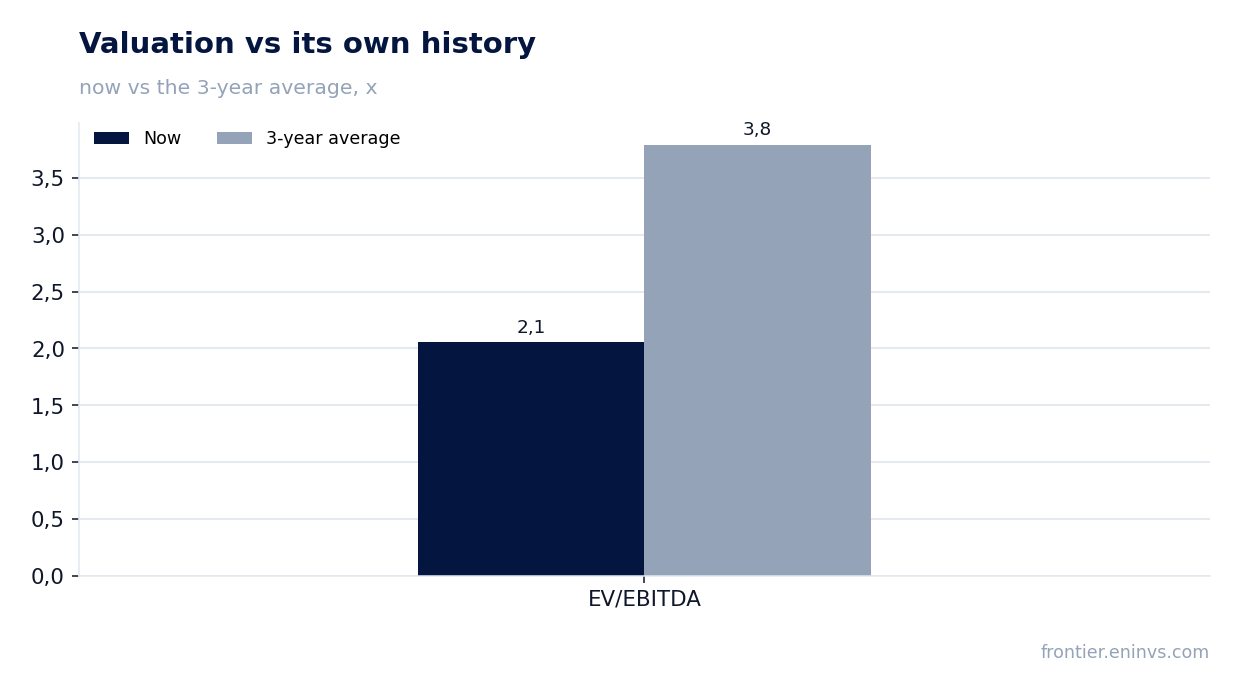
Shares trade at a discount to their own history: EV/EBITDA of 2.05 vs 3.79 three-year average
The current EV/EBITDA multiple is 2.05, well below the three-year average of 3.79. This means the market values the company at a discount to its own history, despite low leverage and high dividend yield.
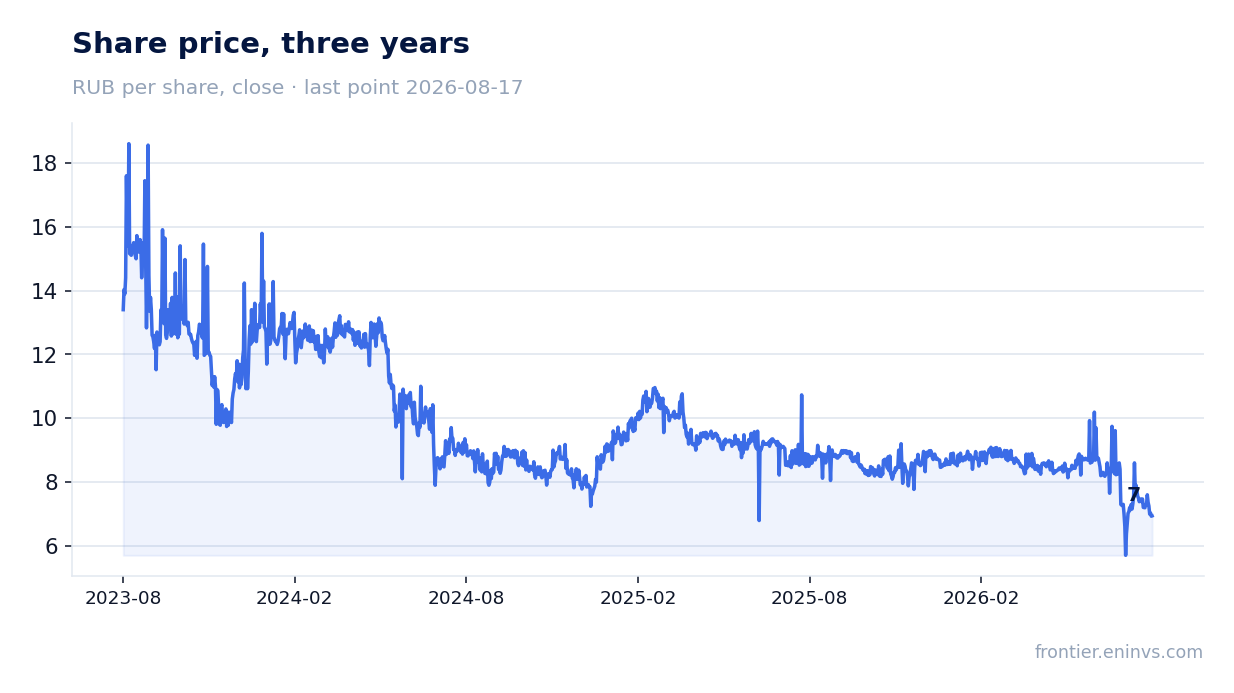
P/E for the trailing twelve months is 3.18, which also looks attractive. However, the share price decline of 20.2% from the release date to August 17, 2026 may reflect investor concerns about the sustainability of operating performance and future dividends.
Valuation on the latest reported figures
| Metric | Value |
|---|---|
| Market cap | 130 bn ₽ |
| P/E (LTM) | 3.2 |
| EV/EBITDA (LTM) | 2.1 |
| P/B | 0.76 |
| Net debt / EBITDA (LTM) | -0.26 |
| Operating cash flow (LTM) | 42.4 bn |
| ROE | 21.5% |
| Dividend yield (12m) | 11.1% |
| EV/EBITDA, 3-year average | 3.8 |
Bottom line
In Q1 2026, NCSP delivered mixed results: revenue stagnated, EBITDA fell 20%, but net profit rose thanks to FX gains and finance income. Strengths remain low leverage (negative net debt) and high dividend yield, but operating efficiency is deteriorating and capex is rising. The key question for shareholders is whether the company can maintain dividends at current levels amid declining EBITDA and growing investments. The market has already reacted with a 20% decline in share price, which may reflect these concerns.
Open the company's financial profile NMTP →
See also: market overview · valuation map · stock screeners