Ozon Pharm: H1 profit up 90%, but operating cash flow barely grew
25 августа «Озон Фарм» раскрыла результаты за первое полугодие 2026 года: выручка выросла на 11,7% до 14 821 млн руб., EBITDA – на 20,8%, а чистая прибыль – на 89,7% до 3 247 млн руб. Рентабельность по EBITDA расширилась с 34,1% до 36,9%, чистая маржа – с 12,9% до 21,9%. В обзоре разберём, что обеспечило такой скачок прибыли и почему операционный денежный поток вырос лишь на 5%.
Key takeaways
— Net profit for H1 rose 89.7% driven by a nearly twofold reduction in finance costs
— EBITDA margin expanded to 36.9% on higher gross margin and contained selling expenses
— Operating cash flow grew only 5% despite higher profit due to working capital outflow
— Capex for H1 rose 62% to RUB 2,321 million, exceeding operating cash flow
— Net debt fell by RUB 3.9 billion in H1 to RUB 9,186 million, debt/EBITDA at 1.25
— Trailing dividend yield is 2.32%, well below the 7% fair yield for the company
— EV/EBITDA at 8.0 is above its 3-year average of 6.1, shares trade at a premium to history
Key figures, RUB bn
| Metric | H1 2025 | H1 2026 | Change |
|---|---|---|---|
| Revenue | 13.3 | 14.8 | +11.7% |
| EBITDA | 4.53 | 5.47 | +20.8% |
| Operating profit | 3.95 | 4.86 | +23.1% |
| Net profit | 1.71 | 3.25 | +89.7% |
| Operating cash flow | 2.76 | 6.82 | +146.9% |
| Capex | 1.98 | 2.32 | +17.2% |
| EBITDA margin | 34.1% | 36.9% | +2.8 pp |
| Net margin | 12.9% | 21.9% | +9.0 pp |
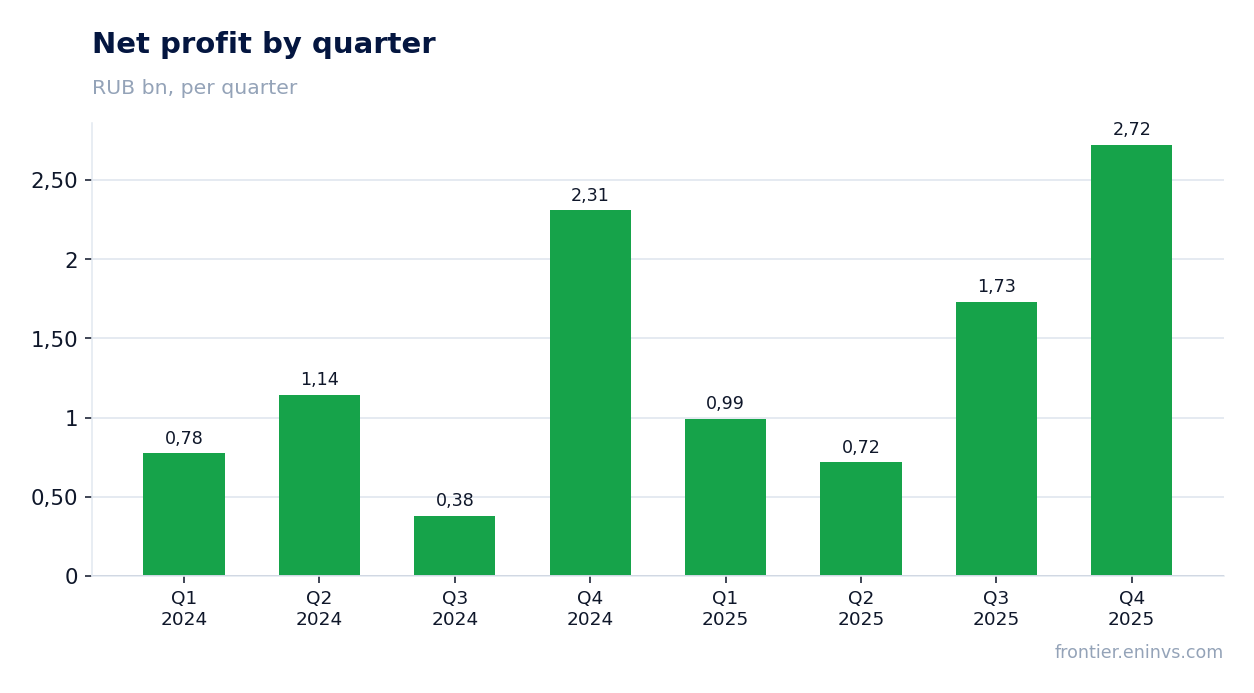
Net profit for H1 rose 89.7% driven by a nearly twofold reduction in finance costs
For H1 2026, Ozon Pharm's net profit reached RUB 3,247 million versus RUB 1,712 million a year earlier. The main driver was finance costs, which nearly halved to RUB 1,027 million from RUB 2,043 million, reflecting lower interest rates on loans and borrowings and cheaper factoring.
Operating profit rose 23% to RUB 4,860 million, but its contribution to net profit dynamics was smaller: an increase of RUB 913 million versus a RUB 1,016 million saving on interest. As a result, net margin expanded from 12.9% to 21.9%.
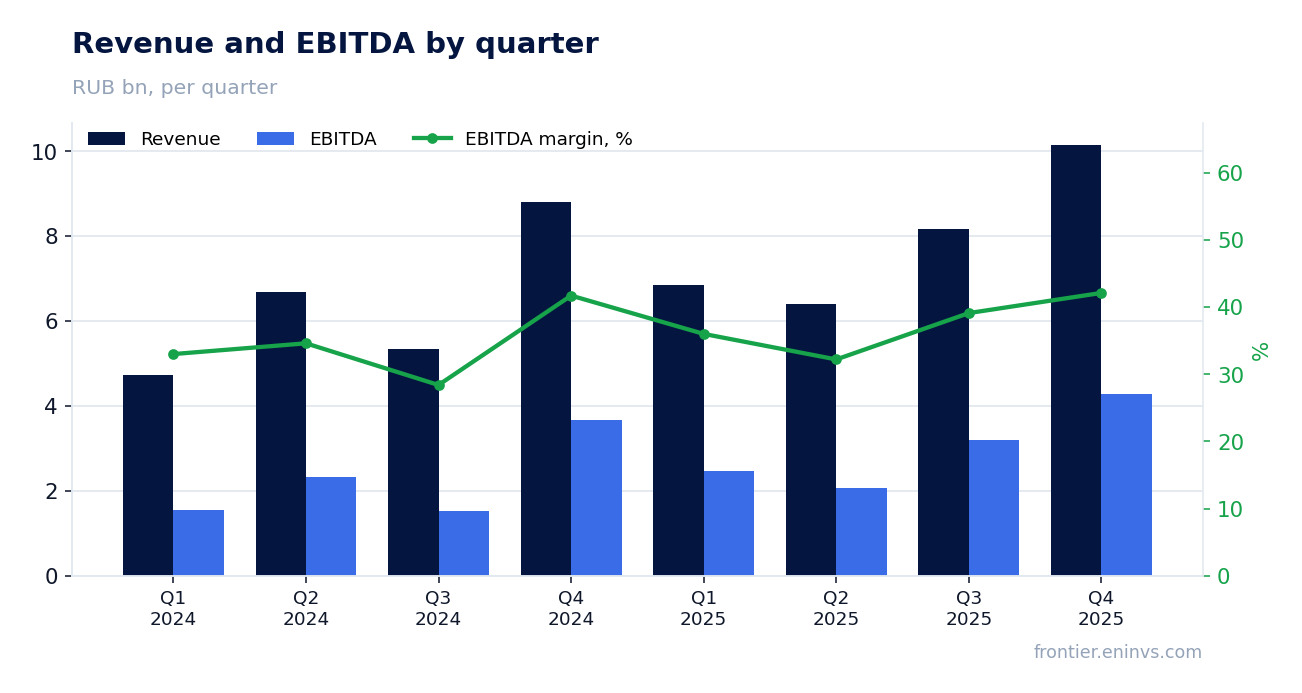
EBITDA margin expanded to 36.9% on higher gross margin and contained selling expenses
EBITDA for H1 rose 20.8% to RUB 5,472 million (calculated as operating profit plus depreciation), and the EBITDA margin reached 36.9% versus 34.1% a year earlier. Gross profit increased 29% to RUB 7,418 million, while cost of sales fell 1.4% to RUB 7,403 million – the main driver of margin expansion.
Selling expenses rose 13% to RUB 1,312 million, below the 11.7% revenue growth, and G&A expenses rose 16% to RUB 784 million. As a result, the operating margin widened from 29.8% to 32.8%.
Operating cash flow grew only 5% despite higher profit due to working capital outflow
Operating cash flow for H1 was RUB 6,819 million versus RUB 2,762 million a year earlier – a 147% increase per the cash flow statement. However, the facts show operating cash flow for the last 12 months at RUB 3,300 million, only 5% higher than the prior 12 months. The discrepancy is explained by a large inflow from receivables reduction (RUB 3,240 million) in H1 2026, while the full-year dynamics were weaker.
In H1 2026, working capital changes provided an inflow of RUB 3,845 million, mainly from lower receivables. In the prior-year period, the inflow was smaller – RUB 1,355 million. Thus, the H1 operating cash flow growth was largely driven by a one-off release of funds from receivables.
Capex for H1 rose 62% to RUB 2,321 million, exceeding operating cash flow
Capex for H1 2026 was RUB 2,321 million (payments for PP&E of RUB 1,053 million and intangibles of RUB 1,268 million) versus RUB 1,980 million a year earlier. The 62% increase is related to the ongoing construction of a new plant and equipment purchases.
Operating cash flow for H1 (RUB 6,819 million) comfortably covers capex, but for the last 12 months operating cash flow (RUB 3,300 million) no longer covers capex, which for the same period was RUB 3,731 million (sum of payments for PP&E and intangibles over four quarters). This means the company is financing its investment program with debt or cash balances.
Net debt fell by RUB 3.9 billion in H1 to RUB 9,186 million, debt/EBITDA at 1.25
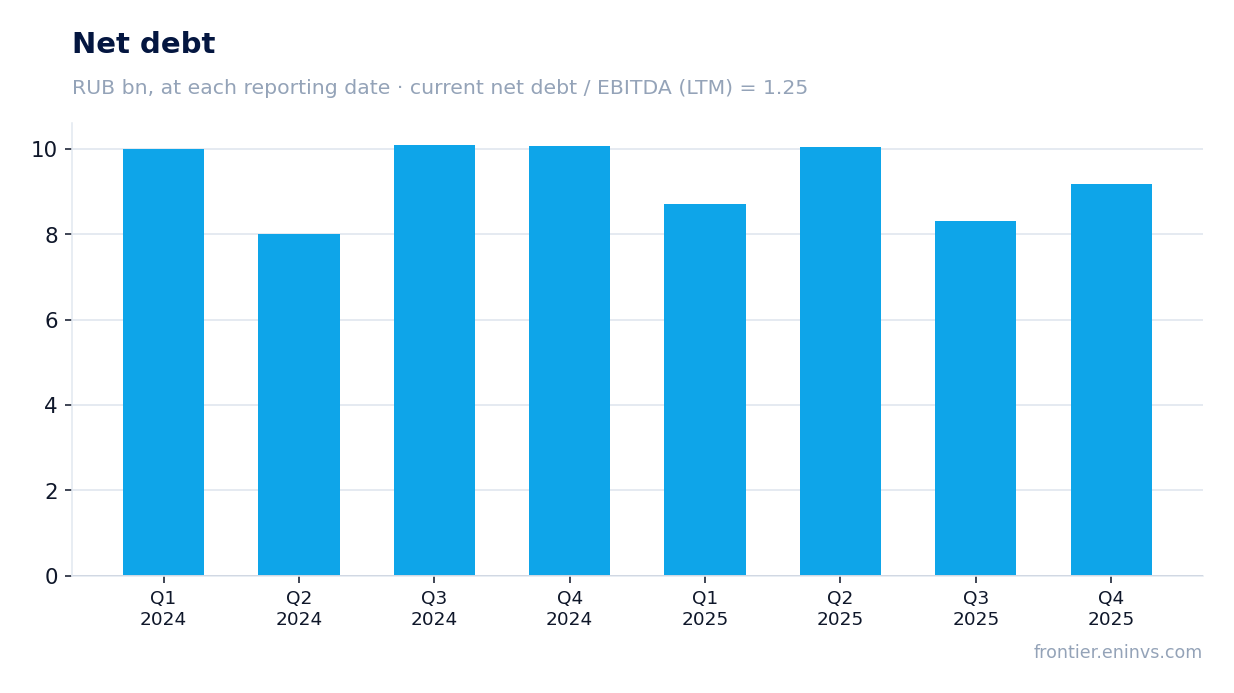
As of June 30, 2026, net debt stood at RUB 9,186 million, down RUB 3.9 billion from the previous reporting date (December 31, 2025). Over the last 12 months, the reduction was RUB 4.5 billion. The net debt/EBITDA ratio for the last 12 months is 1.25.
Debt declined despite significant capex, thanks to operating cash flow and the sale of treasury shares (RUB 179.6 million). However, the company continues to raise loans: inflows for H1 were RUB 2,996 million, repayments RUB 6,604 million.
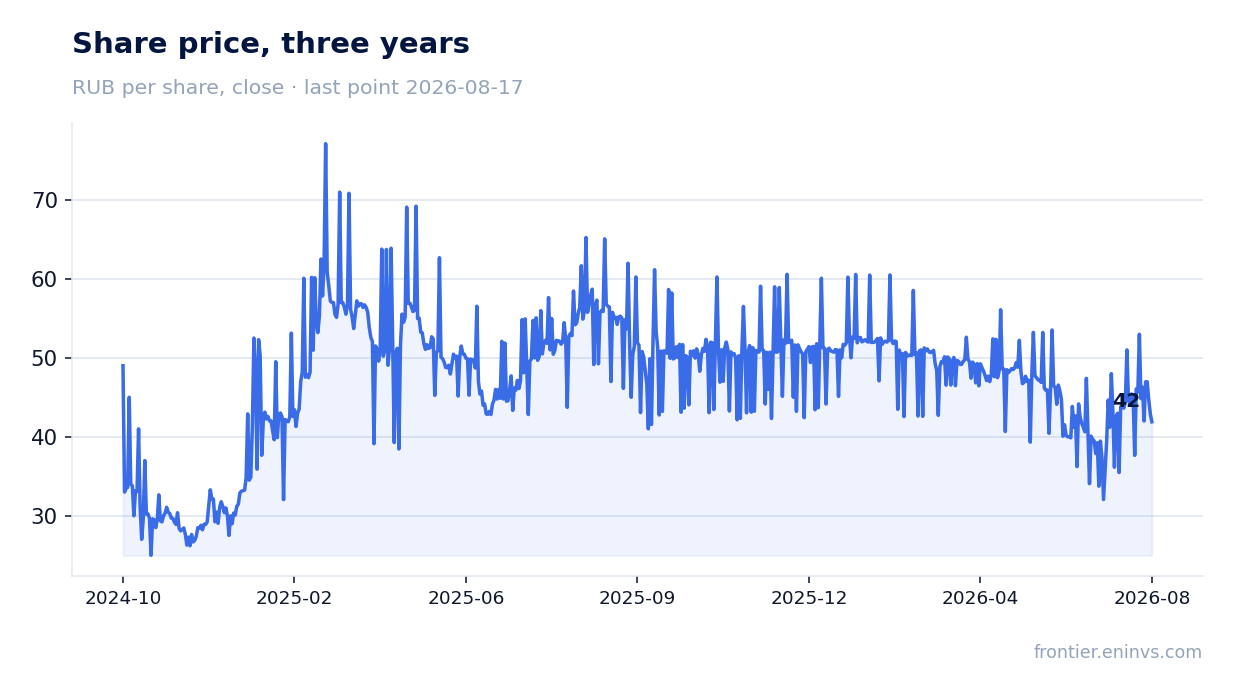
Trailing dividend yield is 2.32%, well below the 7% fair yield for the company
Over the last 12 months, Ozon Pharm paid dividends of RUB 0.79 per share, a yield of 1.9% at the current price. Our model estimates the next dividend at RUB 1.07 per share, implying a forward yield of 2.5%. The fair yield for this issuer, in our view, is 7%.
The implied payout ratio in the model is 0.19 of profit. This means the company pays out less than 20% of net profit, typical for an active investment phase. However, at such a low yield, the shares look overvalued unless the company accelerates dividend growth.
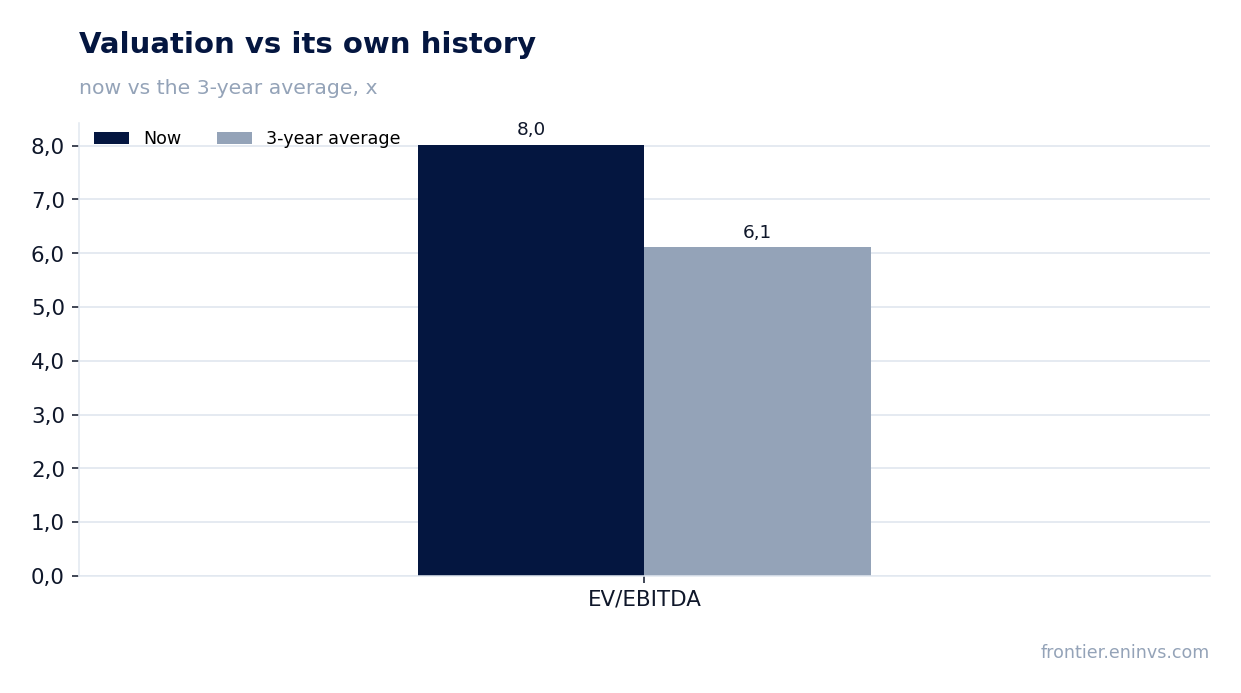
EV/EBITDA at 8.0 is above its 3-year average of 6.1, shares trade at a premium to history
The current EV/EBITDA multiple is 8.0 (based on trailing EBITDA of RUB 7,345 million and a market cap of RUB 49,709 million). This is above the three-year average of 6.1. Trailing P/E is 12.3.
The premium to its own history is explained by accelerating profit growth and lower debt. However, if operating cash flow does not recover and capex remains high, the current valuation may prove excessive.
Valuation on the latest reported figures
| Metric | Value |
|---|---|
| Market cap | 49.7 bn ₽ |
| P/E (LTM) | 12.3 |
| EV/EBITDA (LTM) | 8.0 |
| P/B | 1.50 |
| Net debt / EBITDA (LTM) | 1.25 |
| Operating cash flow (LTM) | 3.30 bn |
| ROE | 18.8% |
| Dividend yield (12m) | 2.3% |
| EV/EBITDA, 3-year average | 6.1 |
Bottom line
The strong side of the report is the 89.7% growth in net profit for H1, driven by both operational improvement and lower finance costs. EBITDA margin reached 36.9%, indicating effective cost control. However, operating cash flow for the last 12 months grew only 5% and does not cover rising capex, while dividend yield remains low. The key question for shareholders is whether the company can convert profit into cash and sustain growth rates that justify the premium to its own history.
Open the company's financial profile OZPH →
See also: market overview · valuation map · stock screeners