Transneft (pref): results weaker than a year ago, but the treasury grew by RUB 83.9 bn over 12 months
1 июня 2026 года Транснефть (прив) раскрыла сокращённую консолидированную промежуточную отчётность за первый квартал 2026 года. Выручка практически не изменилась (–0,1% год к году, до 361 222 млн руб.), EBITDA сократилась на 2,4%, а чистая прибыль – на 8,6%, до 76 997 млн руб.. В обзоре разберём, что стоит за снижением маржинальности, как изменился долг и что это значит для дивидендов.
Key takeaways
— Revenue was almost flat, but EBITDA fell 2.4% due to higher operating expenses
— Net profit dropped 8.6%: higher operating expenses and lower finance income took a toll
— Operating cash flow rose 38% to RUB 94,620 mn, but investments absorbed almost all of it
— Net debt remains negative: the treasury grew by RUB 83.9 bn over 12 months
— EBITDA for the last 12 months is RUB 530,215 mn, margin 36.8% – lower than in the reported quarter
— Dividend yield 14.4% over 12 months, forward 19.3% vs. fair 10.5%
— Valuation: EV/EBITDA 0.87 vs. 3-year average 1.33 – the stock trades at a discount to its own history
Key figures, RUB bn
| Metric | Q1 2025 | Q1 2026 | Change |
|---|---|---|---|
| Revenue | 362 | 361 | -0.1% |
| EBITDA | 159 | 155 | -2.4% |
| Operating profit | 99.1 | 96.7 | -2.4% |
| Net profit | 84.2 | 77.0 | -8.6% |
| Operating cash flow | 68.5 | 94.6 | +38.1% |
| Capex | 79.0 | 76.8 | -2.8% |
| EBITDA margin | 43.9% | 42.9% | -1.0 pp |
| Net margin | 23.3% | 21.3% | -2.0 pp |
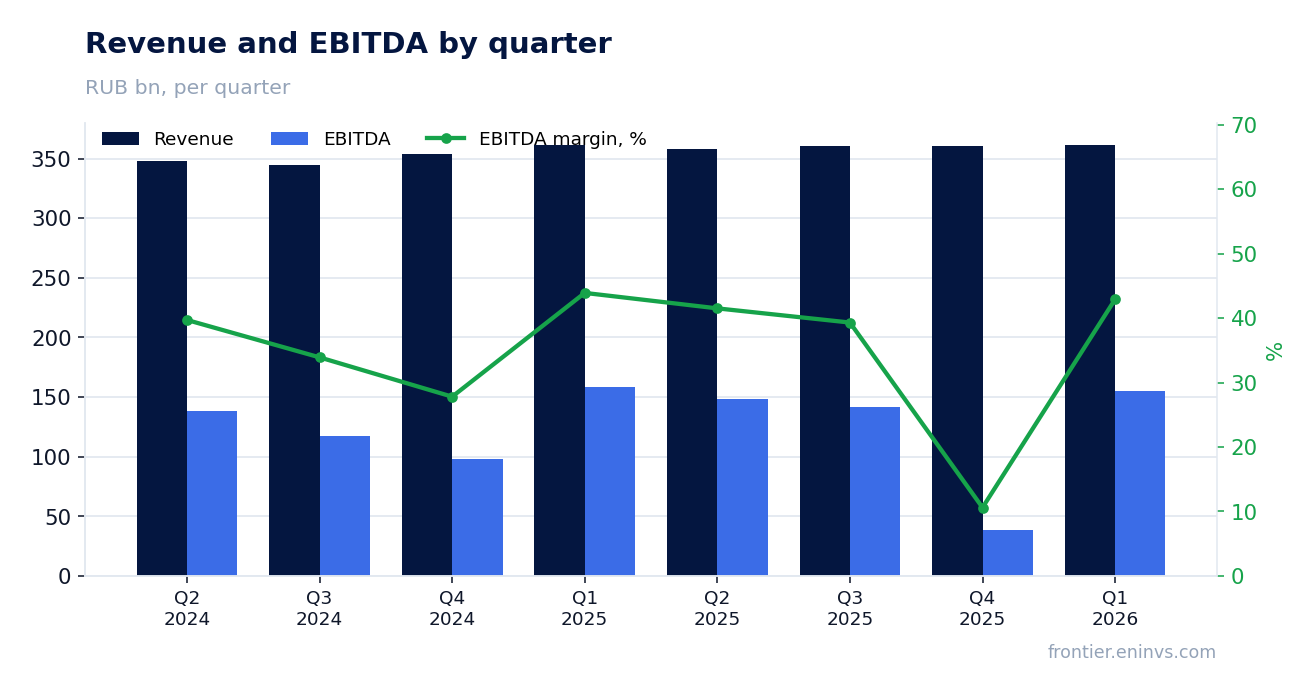
Revenue was almost flat, but EBITDA fell 2.4% due to higher operating expenses
In Q1 2026, revenue was RUB 361,222 mn, down 0.1% year-on-year. The main contribution came from oil and oil products transportation services – RUB 323,331 mn, other revenue – RUB 16,298 mn, stevedoring and fleet services – RUB 19,563 mn.
EBITDA for the reported quarter was RUB 154,854 mn, down 2.4% from Q1 2025. Operating expenses excluding depreciation and impairment increased from RUB 202,836 mn to RUB 206,388 mn, mainly due to higher labour costs and materials. EBITDA margin fell from 43.9% to 42.9%.
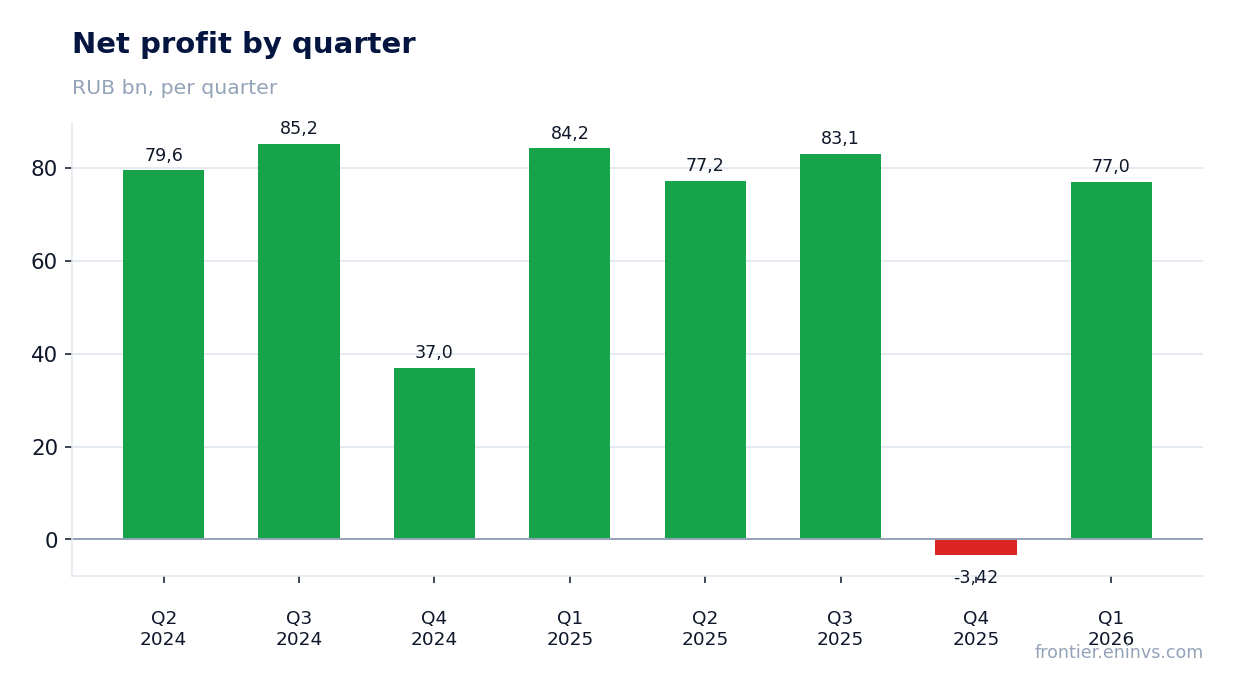
Net profit dropped 8.6%: higher operating expenses and lower finance income took a toll
Net profit for Q1 2026 was RUB 76,997 mn, down 8.6% from RUB 84,207 mn a year earlier. Operating profit fell from RUB 99,074 mn to RUB 96,692 mn, and finance income decreased from RUB 37,970 mn to RUB 26,950 mn – mainly due to lower interest income on deposits and reduced gains from exchange rate differences.
Income tax was RUB 47,516 mn versus RUB 49,601 mn a year earlier. Net margin fell from 23.3% to 21.3%.
Operating cash flow rose 38% to RUB 94,620 mn, but investments absorbed almost all of it
Operating cash flow for Q1 2026 was RUB 94,620 mn versus RUB 68,495 mn a year earlier. The growth was mainly driven by higher receipts from customers and tax refunds.
Capital expenditures were RUB 76,762 mn, close to last year's RUB 78,992 mn. Free cash flow after capex was about RUB 17.9 bn, but including purchases of debt securities and deposits, net cash outflow from investing activities was RUB 151,007 mn.
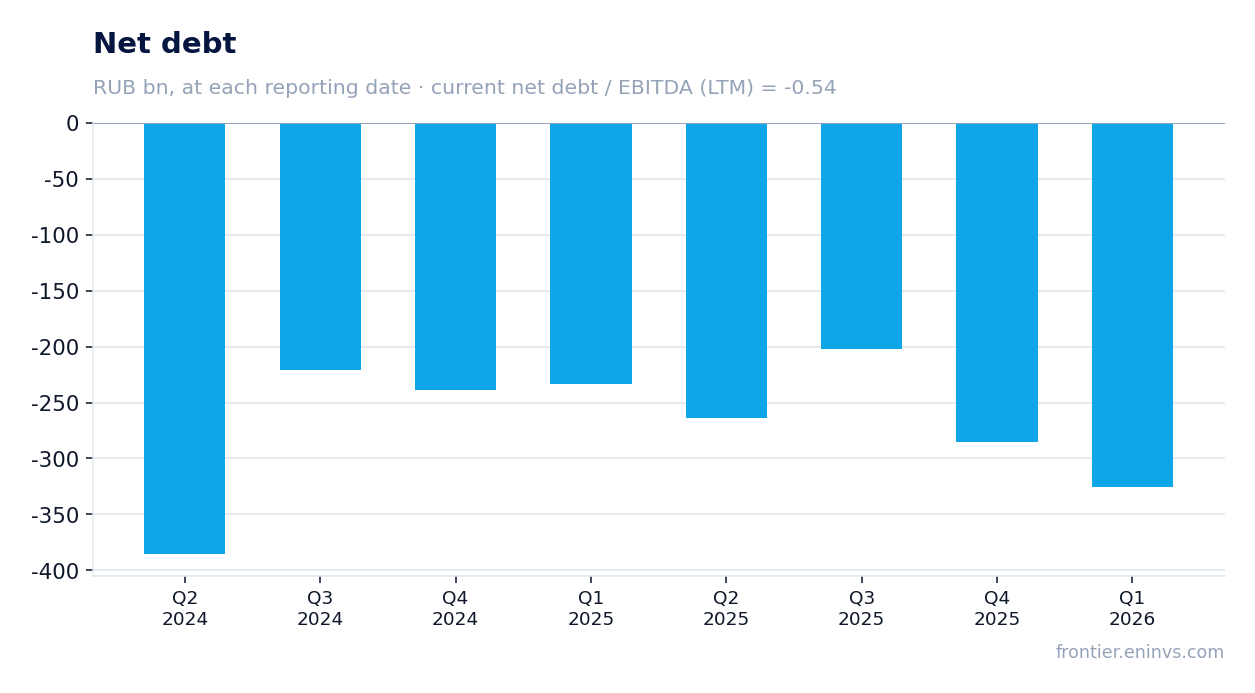
Net debt remains negative: the treasury grew by RUB 83.9 bn over 12 months
As of March 31, 2026, net debt was RUB –325,775 mn, meaning cash and financial investments exceed debt. Over 12 months, net debt improved by RUB 83.9 bn, and over the quarter – by RUB 36.8 bn.
Net debt to EBITDA for the last 12 months is –0.54. The debt burden remains minimal; the company finances its investment programme mostly from internal funds.
EBITDA for the last 12 months is RUB 530,215 mn, margin 36.8% – lower than in the reported quarter
For the last 12 months (Q2 2025 – Q1 2026), EBITDA was RUB 530,215 mn on revenue of RUB 1,439,900 mn. EBITDA margin was 36.8%, lower than the quarterly margin of 42.9% due to the weak Q4 2025, when EBITDA was only RUB 38,180 mn.
Net profit for the same period was RUB 233,917 mn, operating cash flow – RUB 439,000 mn.
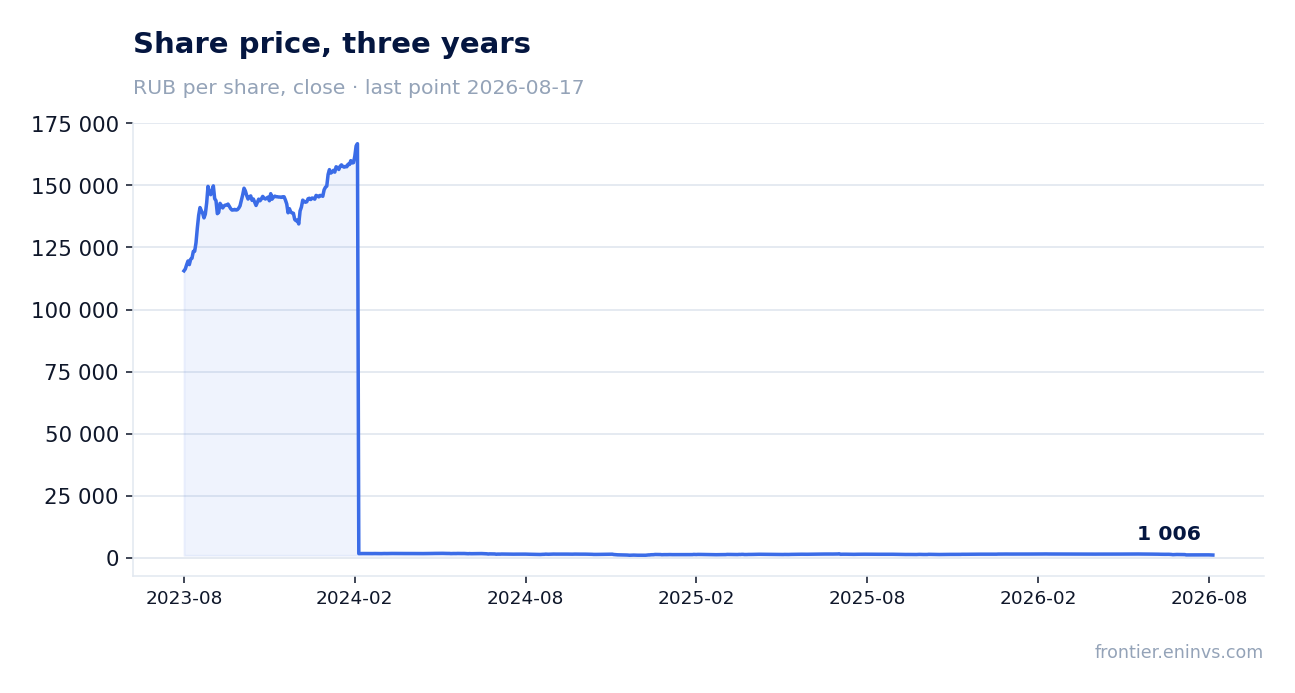
Dividend yield 14.4% over 12 months, forward – 19.3% vs. fair 10.5%
Over the last 12 months, the company paid dividends of RUB 0.0 per share. Our model estimates the next dividend at RUB 198.25 per share, implying a forward yield of 19.3% versus our fair yield of 10.5%.
The payout ratio is 0.5 of profit. At the current price of RUB 1,423.2 before the release, the share fell 29.3% from the release to August 17, 2026, making the dividend yield more attractive.
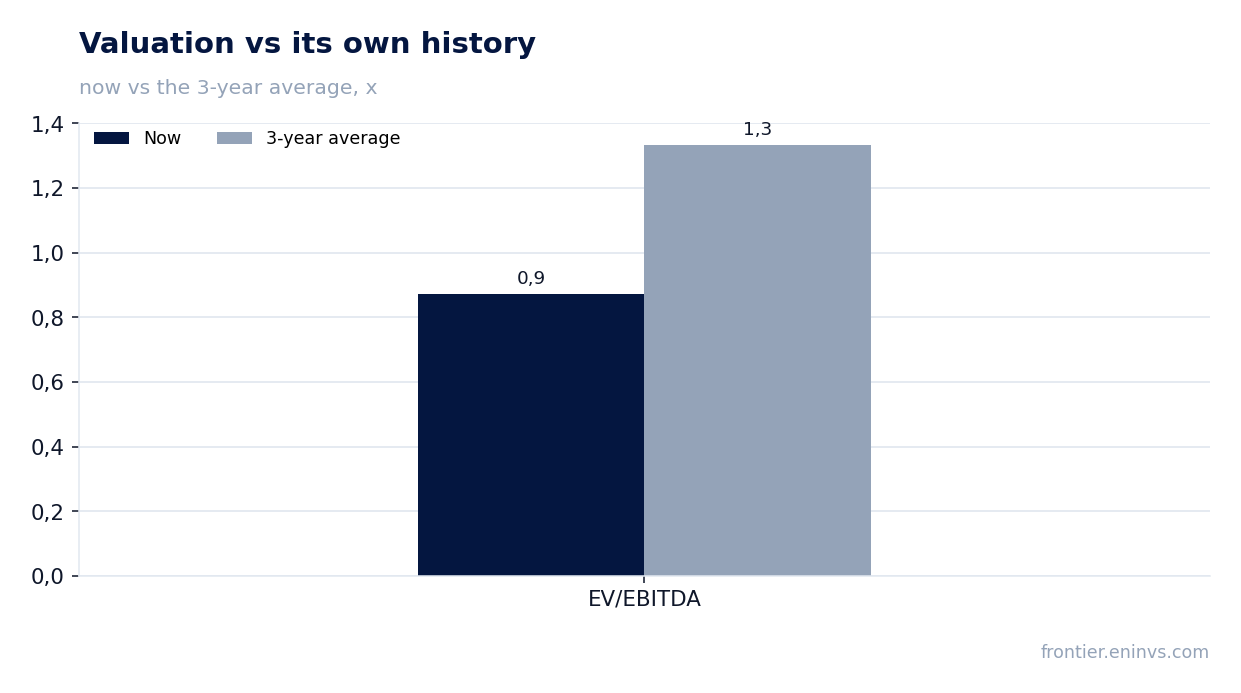
Valuation: EV/EBITDA 0.87 vs. 3-year average 1.33 – the stock trades at a discount to its own history
EV/EBITDA for the last 12 months is 0.87, well below the 3-year average of 1.33. P/E LTM is 3.20, ROE – 10.1%.
Market capitalisation is RUB 747,475 mn, and with negative net debt the valuation looks even more attractive. The stock trades at a discount to its own history, possibly reflecting concerns about tariff regulation and tax burden.
Valuation on the latest reported figures
| Metric | Value |
|---|---|
| Market cap | 747 bn ₽ |
| P/E (LTM) | 3.2 |
| EV/EBITDA (LTM) | 0.9 |
| P/B | 0.25 |
| Net debt / EBITDA (LTM) | -0.54 |
| Operating cash flow (LTM) | 439 bn |
| ROE | 10.1% |
| Dividend yield (12m) | 14.4% |
| EV/EBITDA, 3-year average | 1.3 |
Bottom line
The Q1 2026 report showed stable but not impressive dynamics: revenue was almost flat, EBITDA and net profit declined due to higher expenses and lower finance income. The strong point remains cash flow: operating cash flow rose 38%, and net debt remains negative, improving by RUB 83.9 bn over 12 months. The key question for shareholders is dividends: with a forward yield of 19.3% and a fair yield of 10.5%, the stock looks attractive, but a 29.3% price drop after the report signals market doubts. Watch the dynamics of operating expenses and possible changes in dividend policy.
Open the company's financial profile TRNFP →
See also: market overview · valuation map · stock screeners