AMBARELLA INC: loss shrank threefold, but $9m of that is a one-off deposit release, not a business improvement
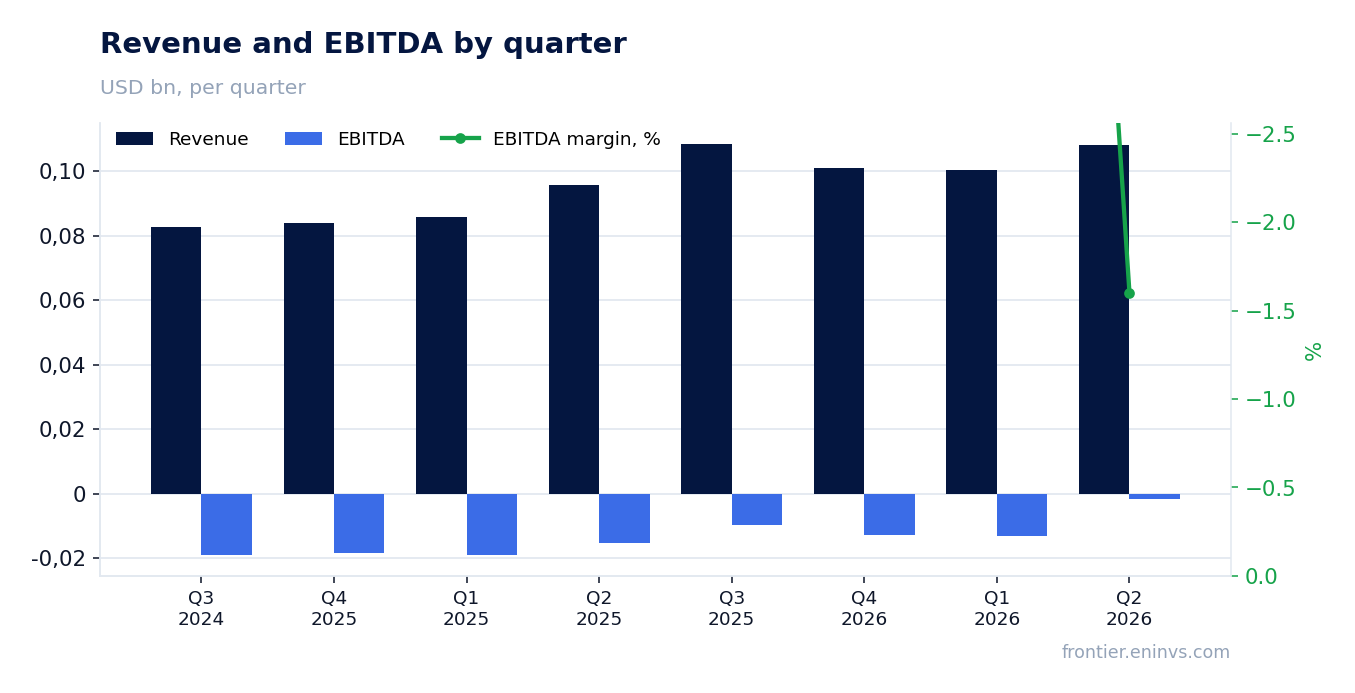
On 3 September AMBARELLA INC reported results for the second quarter of fiscal 2027, ended 31 July 2026. Revenue rose 13.2% year on year to $108.1m, the net loss narrowed to $6.7m from $20.0m a year earlier, and the EBITDA margin improved from -16.1% to -1.6%. A one-off $9.0m deposit release after a development project was terminated drove almost all of that shift; without it the loss would have stayed in double digits. With a market capitalisation of $2.94bn and a share price of $67.14, the stock is expensive against its own history, so the shares look neutral: revenue growth is slowing and sustainable profit is still some way off.
Key takeaways
— Revenue grew 13.2% year on year, but the pace has slowed for six consecutive quarters
— The loss narrowed threefold mainly due to a one-off $9.0m deposit release
— Gross margin fell to 57.7% on higher cost of revenue, not on an improved sales mix
— Operating cash flow over the last twelve months was $73.5m, but in the quarter itself it was zero
— Net cash rose to $259.7m, but that reflects financing rather than profit
— A $2.94bn market capitalisation is not supported by profit: the company is still loss-making on a GAAP basis
Attractiveness
Key figures, USD bn
| Metric | Q2 2025 | Q2 2026 | Change |
|---|---|---|---|
| Revenue | 0.10 | 0.11 | +13.2% |
| EBITDA | -0.02 | -0.00 | — |
| Operating profit | -0.02 | -0.01 | — |
| Net profit | -0.02 | -0.01 | — |
| Operating cash flow | 0.01 | -0.00 | -104.7% |
| Capex | 0.00 | 0.01 | +65.9% |
| EBITDA margin | -16.1% | -1.6% | +14.5 pp |
| Net margin | -20.9% | -6.2% | +14.7 pp |
Revenue grew 13.2% year on year, but the pace has slowed for six consecutive quarters
In the second quarter of fiscal 2027 revenue was $108.1m, up 13.2% from $95.5m a year earlier. This is the sixth consecutive quarter of slowing annual growth: in the first quarter of fiscal 2025 it was 57.6%, then 49.9%, 31.2%, 20.1%, 16.9% and now 13.2%. The slowdown is steady and consistent.
Sequential growth over the previous quarter was 7.7%: revenue rose from $100.4m to $108.1m. This is the best quarterly result in the company's history, as CEO Fermi Wang explicitly stated. However, annual growth is still slowing because the comparison base rises year after year.
For the first half of fiscal 2027 revenue reached $208.5m, up 14.9% from $181.4m in the same period last year. The half-year growth rate is higher than the quarterly one, reflecting weaker results in the first quarter a year ago. But if the quarterly slowdown persists, the half-year figure in the next report could come in lower.
The loss narrowed threefold mainly due to a one-off $9.0m deposit release
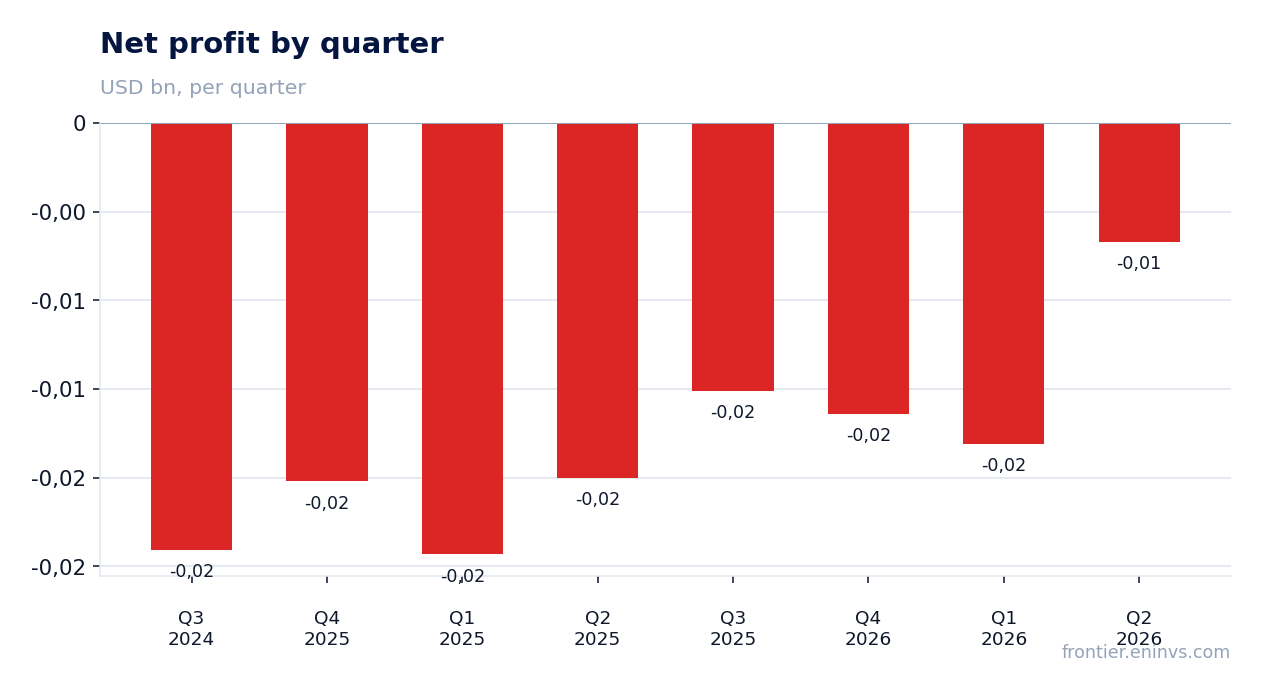
The net loss in the second quarter of fiscal 2027 was $6.7m versus $20.0m a year earlier. The near-threefold reduction looks impressive, but the report explicitly states that the company recognised a one-time $9.0m reduction in research and development expense following the termination of a development project. This deposit release has nothing to do with operating activity.
Without this one-off effect the loss would have been about $15.7m, only slightly better than last year's $20.0m. Operating loss narrowed from $22.0m to $8.1m, and the $13.9m difference is almost entirely explained by the same deposit release and a $9.2m reduction in research and development expense.
Adjusted net income excluding one-off items and stock-based compensation was $8.2m, or $0.18 per share, versus $6.4m and $0.15 a year earlier. This is a positive signal, but it was achieved mainly through cost cuts rather than revenue growth.
Gross margin fell to 57.7% on higher cost of revenue, not on an improved sales mix
GAAP gross margin in the second quarter of fiscal 2027 was 57.7% versus 58.9% a year earlier. The 1.2 percentage point decline occurred alongside 13.2% revenue growth, meaning cost of revenue grew faster than revenue. Cost of revenue rose to $45.7m from $39.3m, or 16.4%.
Non-GAAP gross margin also declined, to 59.3% from 60.5%. The difference between GAAP and non-GAAP margin remained at 1.6% and is explained by stock-based compensation and acquisition-related costs. The company does not disclose the reasons for the faster growth in cost of revenue, but it could be due to a change in sales mix or rising component prices.
For the first half of fiscal 2027 GAAP gross margin was 58.0% versus 59.4% a year earlier. Margin decline alongside revenue growth means the company is not getting the scale effect that could improve profitability. This is a key risk for future profitability.
Operating cash flow over the last twelve months was $73.5m, but in the quarter itself it was zero
Over the last twelve months operating cash flow was $73.5m. This is a substantial sum, but it was accumulated in previous quarters. In the second quarter of fiscal 2027 itself operating cash flow was negative at -$0.3m, significantly worse than $5.5m a year earlier and $34.3m in the third quarter of fiscal 2025.
Capital expenditure in the reporting quarter rose to $6.8m from $4.1m a year earlier. This resulted in negative free cash flow in the quarter. Over the last twelve months capital expenditure was about $17.6m, small relative to operating cash flow, but the quarterly dynamics are concerning.
The company does not disclose the reasons for weak operating cash flow in the quarter. However, inventory growth from $52.2m to $76.9m since the start of the year and a decline in accounts payable from $54.0m to $26.5m could have absorbed a significant portion of cash. This may be related to preparations for new product launches.
Net cash rose to $259.7m, but that reflects financing rather than profit
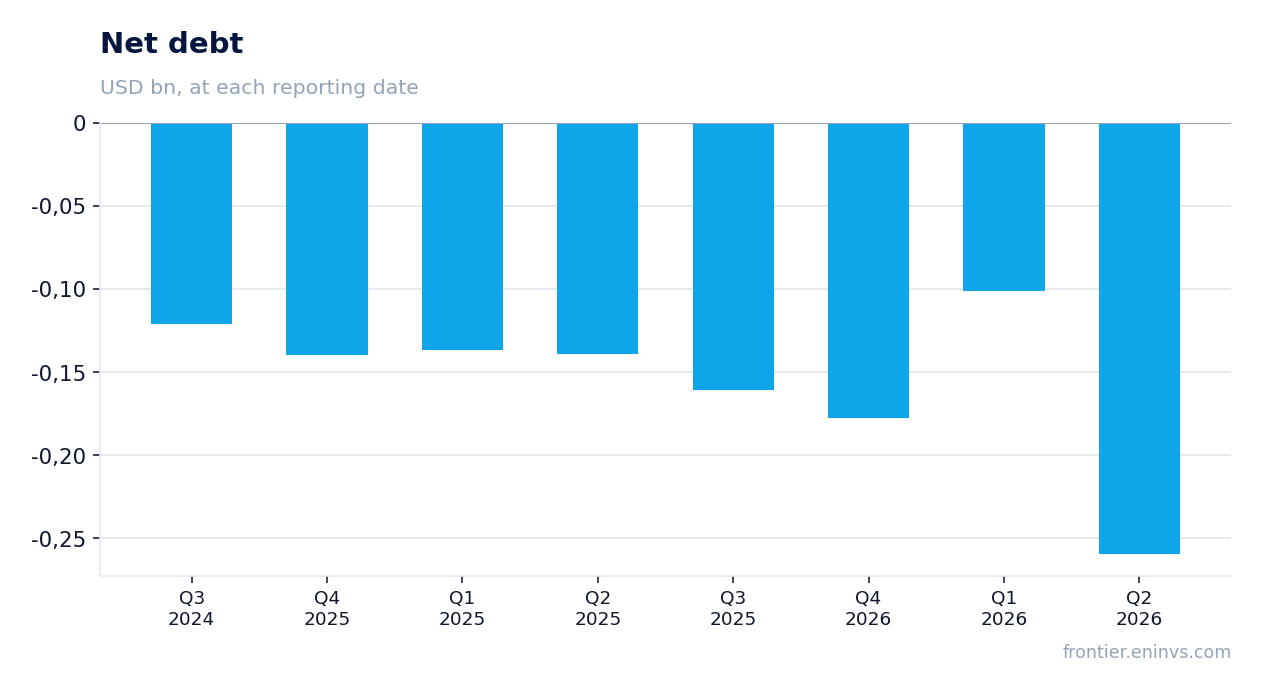
Net cash at the end of the second quarter of fiscal 2027 was $259.7m, up from $177.6m at the end of the previous quarter. The $82.1m increase occurred despite a $6.7m net loss and negative operating cash flow. This means the company raised significant financing.
Total cash, cash equivalents and marketable debt securities at the end of the quarter were $272.3m versus $277.8m in the previous quarter and $261.2m a year earlier. The $5.5m decline from the previous quarter alongside a rise in net cash is explained by an increase in debt liabilities.
The company does not disclose details of the financing, but a rise in net cash during losses indicates that funds were obtained from external sources. This could be related to an equity or debt issuance. To assess the sustainability of the business, it is important to understand how one-off this is.
A $2.94bn market capitalisation is not supported by profit: the company is still loss-making on a GAAP basis
With a market capitalisation of $2.94bn and trailing twelve-month revenue of $417.8m, the market-cap-to-revenue ratio is about 7.0. For a company still generating GAAP losses, this is a high multiple. Return on equity is negative at -4.4%.
Adjusted net income over the last twelve months, if quarterly figures are summed, remains positive but insignificant relative to market capitalisation. The company does not provide profit guidance for the next quarter, but it guides revenue to $115.0–124.0m and non-GAAP gross margin to 59.0–60.0%.
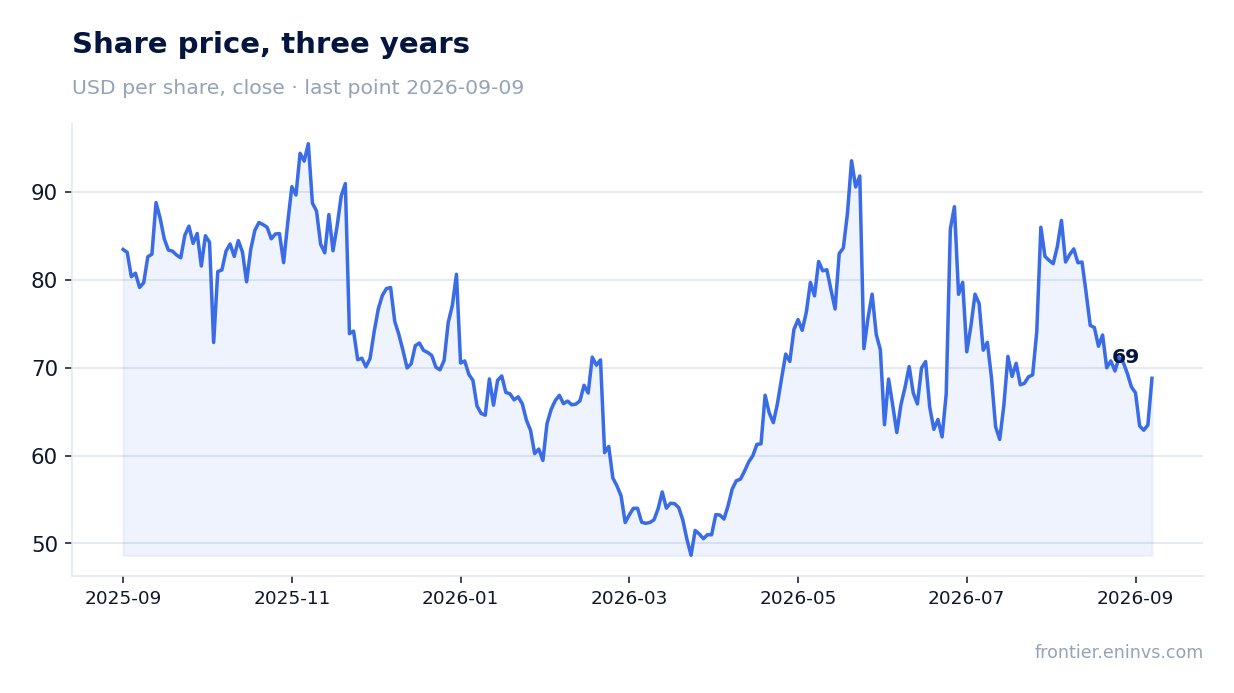
The share closed at $67.14 before the release, fell 5.6% on the release day, and has risen 2.5% from the release to 9 September. The market reaction was muted, reflecting the mixed results. Without sustainable profit, the company's valuation remains speculative and dependent on future growth.
Valuation on the latest reported figures
| Metric | Value |
|---|---|
| Market cap | 2.94 bn USD |
| P/B | 4.94 |
| Operating cash flow (LTM) | 0.07 bn |
| ROE | -4.4% |
Bottom line
The report's strengths were record quarterly revenue, a narrower loss, and higher net cash. However, almost all of the profit improvement came from a one-off $9.0m deposit release rather than better operating performance. Operating cash flow in the quarter was zero, gross margin declined, and annual revenue growth has slowed for six consecutive quarters. With a $2.94bn market capitalisation and no sustainable profit, the stock looks neutral: the market is already pricing in significant future growth that current results do not yet confirm.
Open the company's financial profile AMBA →
See also: market overview · valuation map · stock screeners