Tech titans and energy outliers: AI demand reshapes the earnings landscape
This earnings season delivered a clear verdict: the AI-driven technology surge is widening the gap between winners and laggards, with the median revenue growth in tech at +23.3% dwarfing the +4.7% for US oil & gas E&P. Yet within energy, a handful of nimble players are defying the gravity of a sector that saw median growth of just +4.7%, while utilities—especially independent power—posted a stunning +189.5% median gain, hinting at a structural shift in power demand.
Revenue growth by industry (median YoY)
AI infrastructure spending turbocharges tech revenue and margins
The technology sector’s +23.3% median revenue growth was powered by companies directly benefiting from AI buildout. NVIDIA, the poster child, delivered a staggering +85.2% revenue surge, with EBITDA up +145.1% and net profit soaring +210.6%. Broadcom was not far behind, with revenue +47.9% and EBITDA nearly tripling at +155.3%. Even legacy semiconductor firms like Analog Devices joined the party: revenue jumped +37.2% and net profit more than doubled at +106.5%, while Lattice Semiconductor saw revenue +42.2% and net profit +334.4%.
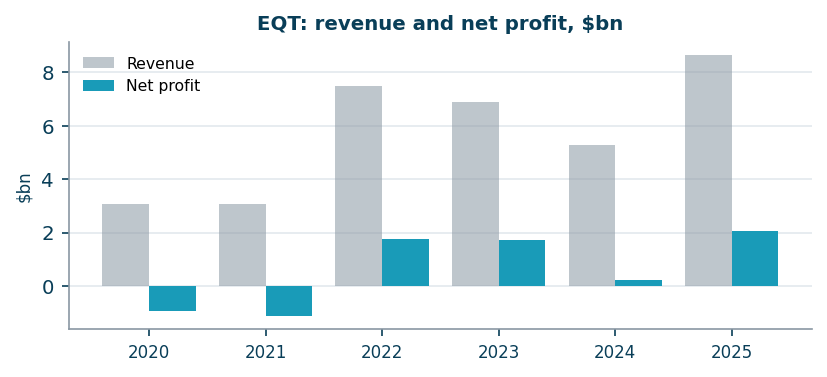
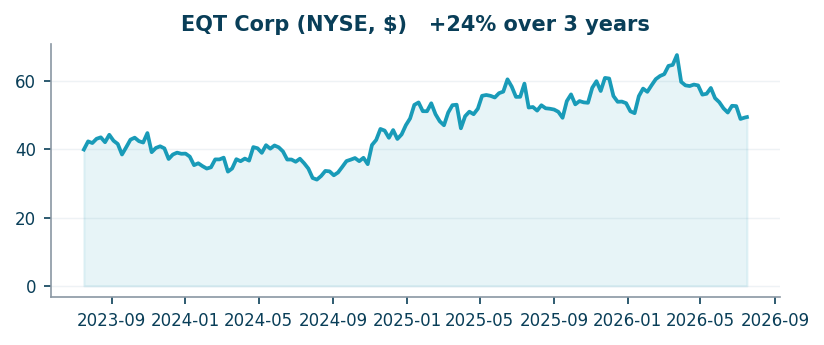
Energy patch splits: natural gas and select E&Ps shine while many struggle
The US oil & gas E&P sector’s median revenue growth of +4.7% masks a deep divide. Antero Resources, riding a natural gas rally, posted a +43.8% revenue increase and EBITDA more than doubled at +104.4%. Northern Oil and Gas surged +74.0%, and SM Energy grew revenue +75.0%. But the losers were brutal: California Resources cratered -87.0%, EQT fell -29.2%, and Matador Resources dropped -33.8%, with EBITDA plunging -49.4%. The sector’s wide dispersion—from +75.0% to -87.0%—tells a story of commodity exposure and operational leverage.
The plot twist: Micron’s explosive recovery and Qualcomm’s surprising stumble
The biggest surprise came from Micron Technology, which delivered a jaw-dropping +345.7% revenue surge—by far the highest in the entire dataset—with EBITDA and net profit turning positive after prior losses. This represents a dramatic acceleration from a period of decline, driven by memory pricing recovery and AI demand. In stark contrast, Qualcomm saw revenue slip -3.5%, a deceleration from prior growth, as its handset and IoT markets softened. The contrast between memory’s cyclical upswing and Qualcomm’s mature-market headwinds underscores the uneven nature of the tech recovery.
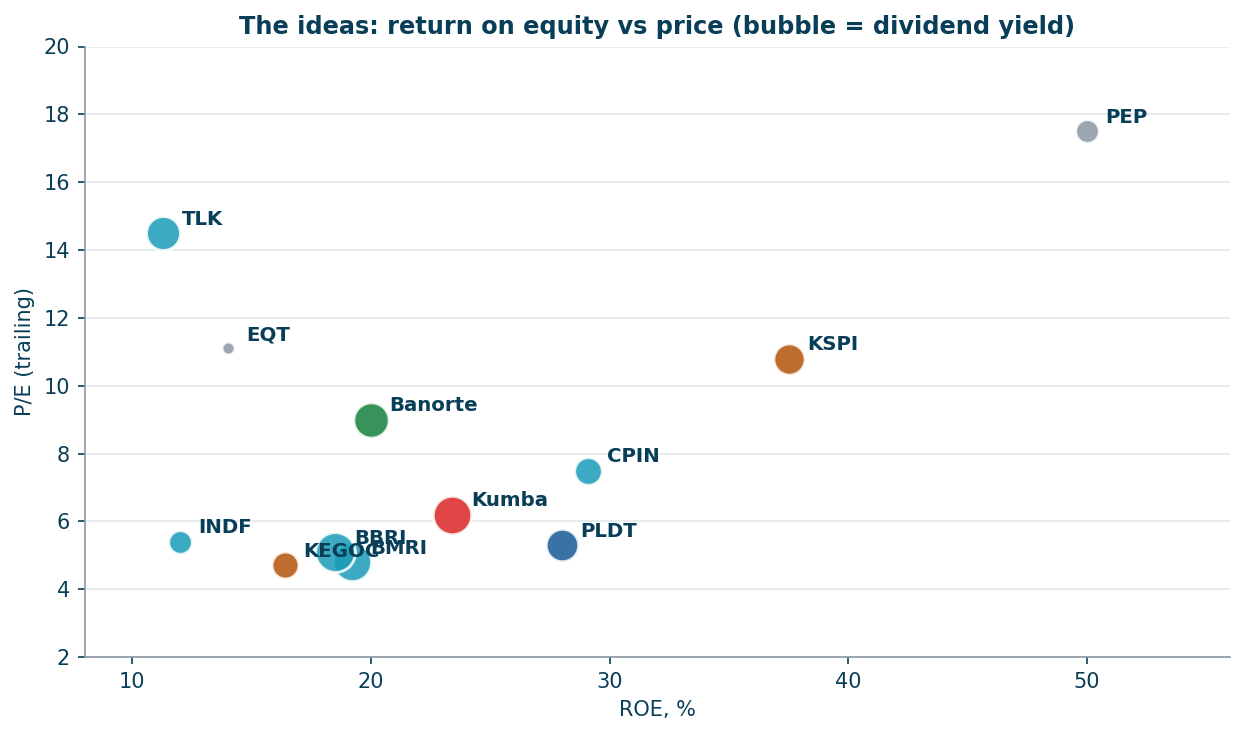
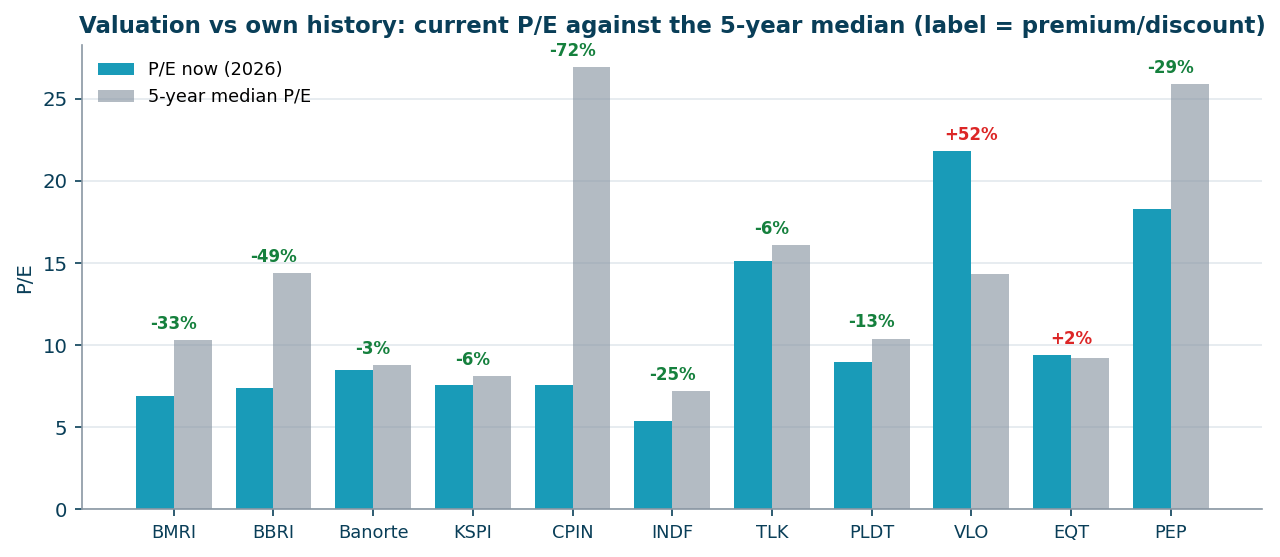
Valuation extremes: growth at any price versus hidden bargains
The valuation landscape is equally polarized. NVIDIA, growing revenue at +85.2%, trades at a seemingly reasonable P/E of 29.9x and EV/EBITDA of 28.9x—cheap for its growth rate. Conversely, Marvell Technology, with revenue growth of +27.6%, commands a P/E of 64.5x and EV/EBITDA of 64.8x, pricing in perfection. At the other end, Apple trades at 40.6x P/E despite just +16.6% revenue growth and a modest 3-year CAGR of +1.8%, while Alphabet offers a more balanced profile: +21.8% revenue growth with a P/E of 24.7x. The most extreme value play is Bloom Energy, with a P/E of just 4.5x despite +130.4% revenue growth, though its EBITDA turned positive from a loss.
Income investors find few havens as yields remain compressed
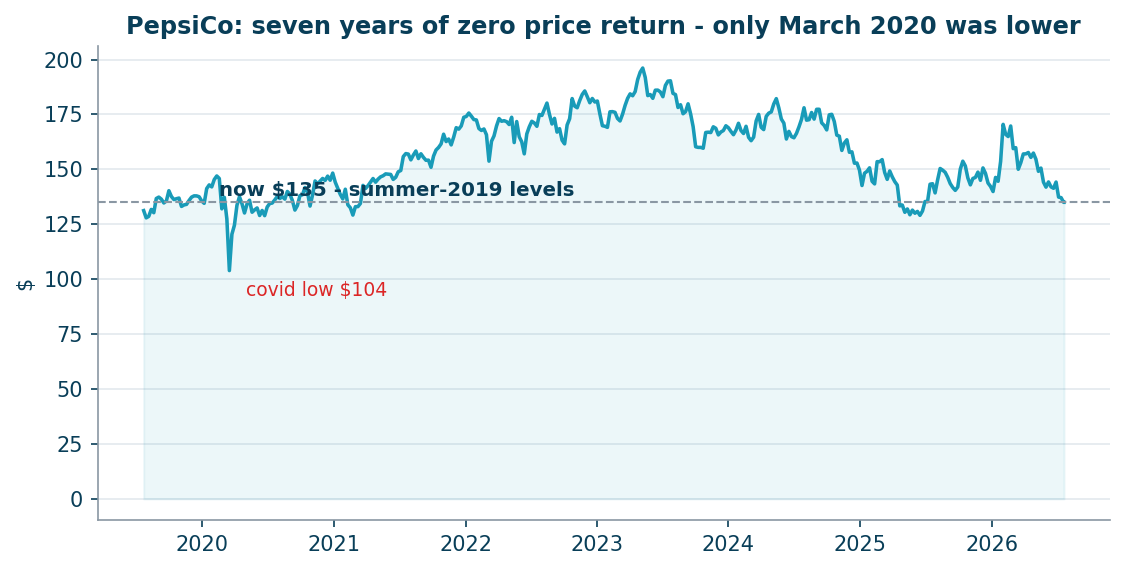
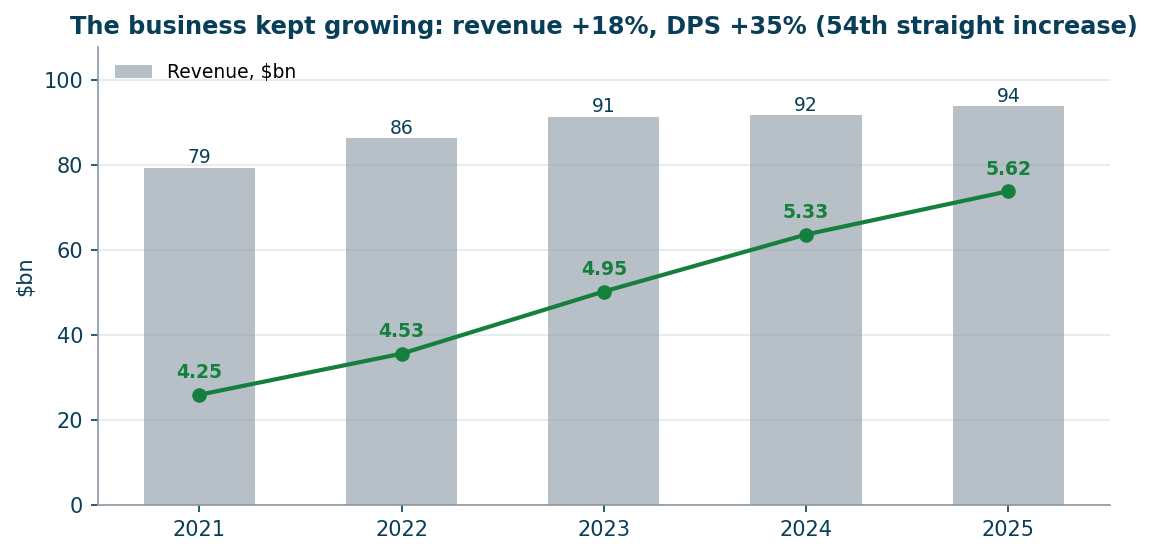
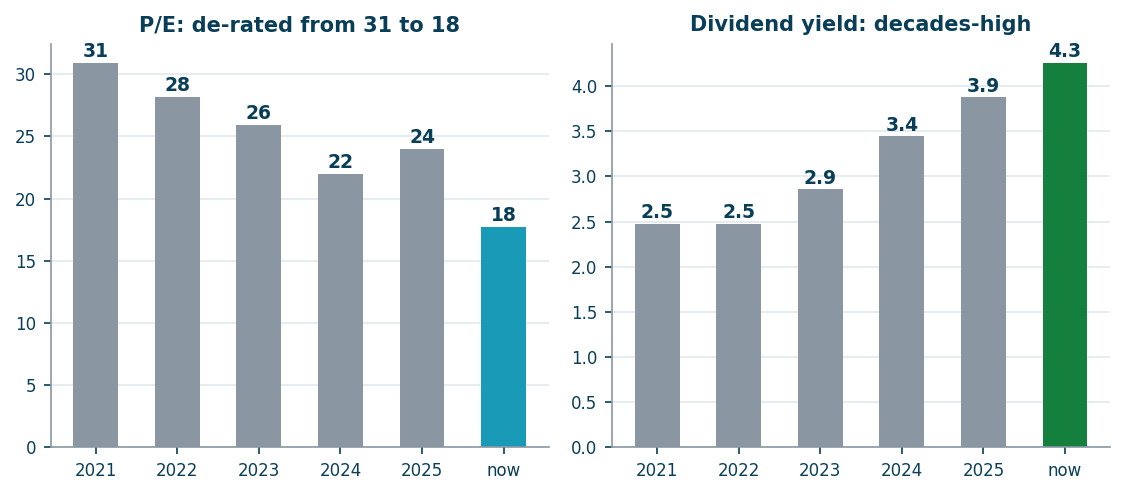
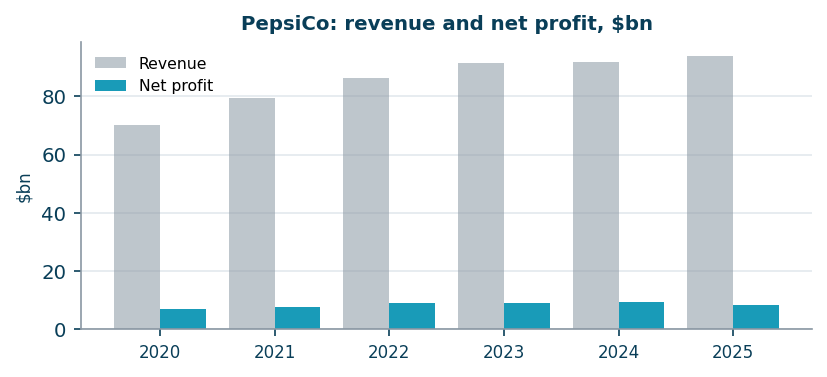
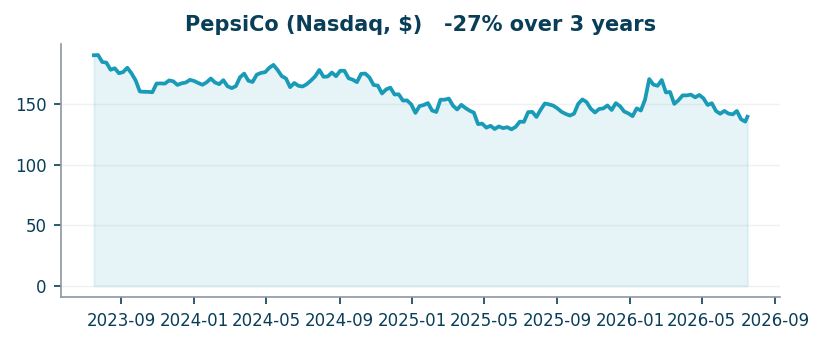
Dividend yields are thin across the board. Among the few standouts, AT&T offers a yield implied by its P/E of 8.1x (roughly 12.3% earnings yield), though its revenue growth is a tepid +2.3%. Verizon trades at a P/E of 12.4x (about 8.1% earnings yield) but with revenue declining -0.7%. For those seeking growth and yield, Coca-Cola provides a modest P/E of 26.4x with consistent +12.1% revenue growth, while PepsiCo trades at 18.4x P/E with +6.4% revenue growth and a strong EBITDA jump of +96.6%.
The long view: 3-year CAGRs reveal sustainable winners and cyclical traps
Looking beyond the quarter, NVIDIA’s 3-year revenue CAGR of +100.0% is in a league of its own, followed by Super Micro Computer at +61.7% and Robinhood Markets at +48.8%. These are companies that have compounded growth at extraordinary rates. At the other extreme, Kulicke & Soffa Industries saw a 3-year CAGR of -24.2%, and CCI’s revenue shrank at -15.2% annually. The takeaway: AI infrastructure and digital asset platforms are the secular winners, while legacy telecom and cyclical semiconductor equipment face headwinds. As we move into the next quarter, watch for whether Micron’s memory boom can sustain and if energy’s laggards can stage a recovery amid volatile commodity prices.
Players: growth & yield (no absolute levels)
| Company | Industry | Revenue YoY | EBITDA YoY | Net profit YoY | P/E |
|---|---|---|---|---|---|
| AMAZON COM INC (Q1) | Consumer discretionary | +16.6% | +31.0% | +76.7% | 27.3x |
| Walmart Inc. (Q1) | Consumer staples | +7.3% | +11.1% | +18.8% | 39.2x |
| UNITEDHEALTH GROUP INC (Q2) | Health care | +0.4% | — | +61.0% | 26.8x |
| Apple Inc. (Q2) | Technology | +16.6% | +21.9% | +19.4% | 40.6x |
| Alphabet Inc. (Q1) | Communication services | +21.8% | +31.6% | +81.2% | 24.7x |
| MICROSOFT CORP (Q3) | Technology | +18.3% | +23.4% | +23.1% | 23.1x |
| NVIDIA CORP (Q1) | Technology | +85.2% | +145.1% | +210.6% | 29.9x |
| COSTCO WHOLESALE CORP /NEW (Q3) | Consumer staples | +11.6% | +15.7% | +15.2% | 51.1x |
| JPM (Q2) | — | +27.7% | — | +41.2% | n/m |
| Meta Platforms, Inc. (Q1) | Communication services | +33.1% | +34.6% | +60.9% | 21.3x |
| Dell Technologies Inc. (Q1) | United States — large cap (SEC filings) | +87.5% | +131.9% | +256.3% | 34.3x |
| HOME DEPOT, INC. (Q1) | Consumer discretionary | +4.8% | +1.4% | -4.2% | 23.8x |
| MICRON TECHNOLOGY INC (Q3) | Technology | +345.7% | n/m | n/m | 20.1x |
| VERIZON COMMUNICATIONS INC (Q2) | Communication services | -0.7% | +7.0% | -23.3% | 12.4x |