Antero Resources: record production and a 20% revenue decline — profit rests on derivatives
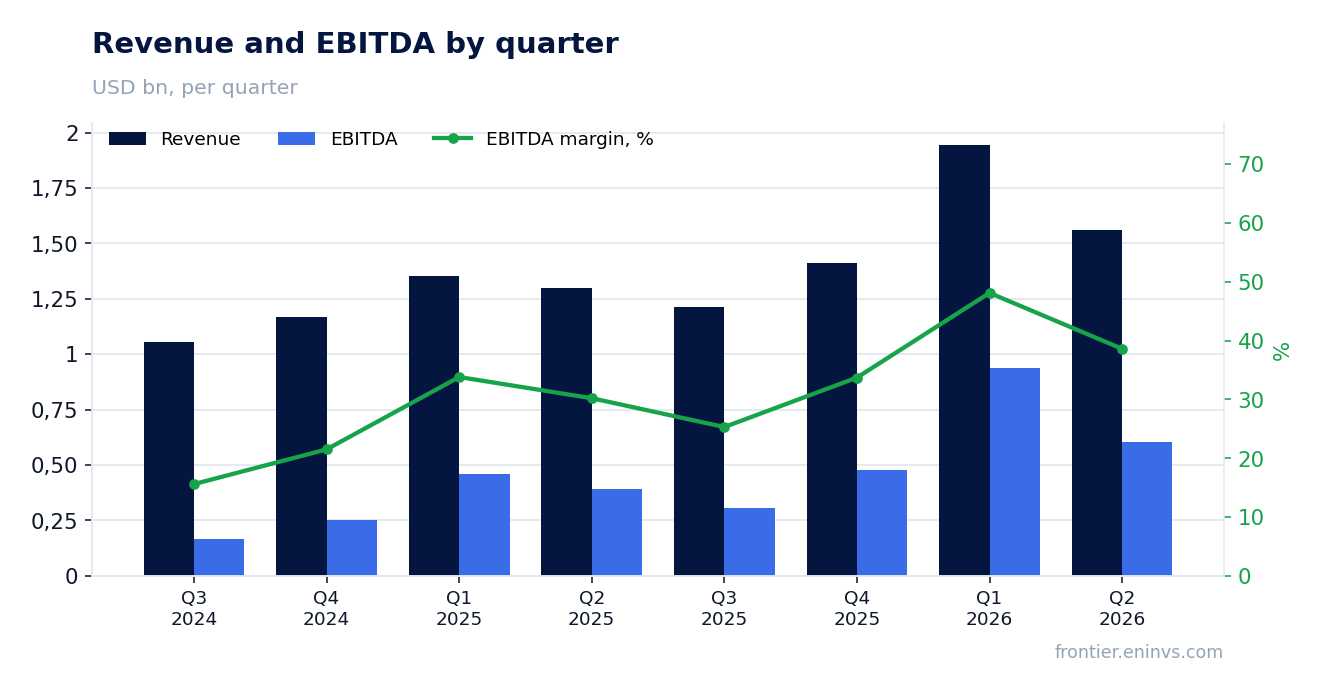
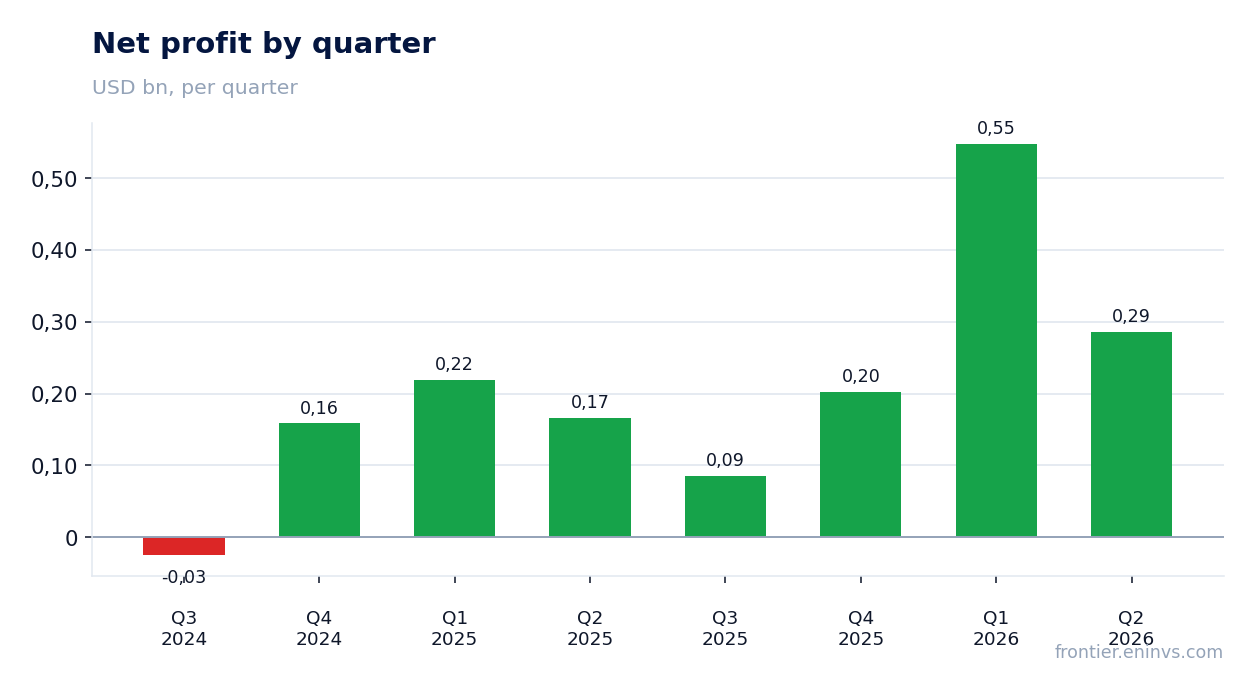
On July 29, Antero Resources Corporation released its second-quarter 2026 results. Revenue fell 20.2% year on year to $1,559.8 million, but EBITDA rose 53.6% to $602.8 million and net income jumped 71.9% to $286.4 million. The gap is explained not by an operational miracle but by an accounting line: derivative gains contributed $160.6 million versus $53.4 million a year earlier. The stock trades below its historical valuation, yet the portal's model puts fair value 32% below the current price. Verdict — neutral: operational progress is real, but the current price already reflects much of it.
Key takeaways
— Revenue fell 20.2% but EBITDA rose 53.6% — the gap was created by derivatives and lower unit costs
— Record production of 4.1 Bcfe/d lifted volumes 21%, yet gas prices dropped 22%
— Derivative gains of $160.6 million are a one-off that may vanish next quarter
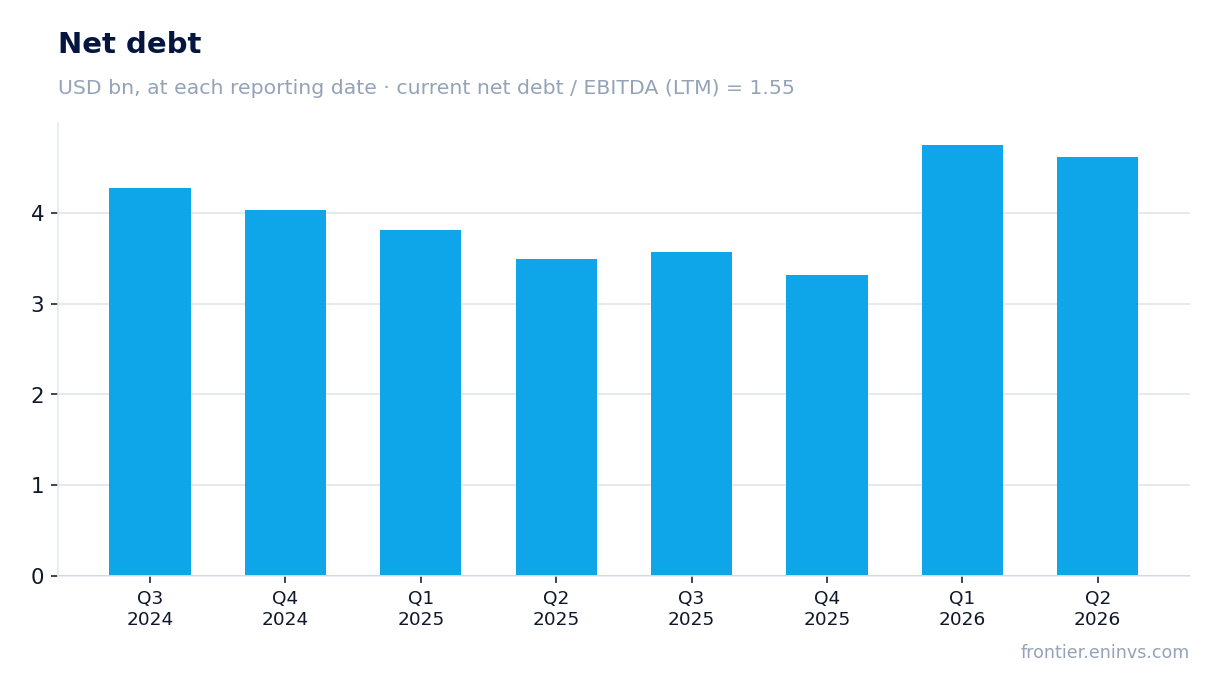
— Leverage of 1.55x EBITDA is moderate, but absolute debt rose to $4,615.3 million
— Adjusted free cash flow before working capital changes was $219.8 million, but capex rose to $340.7 million
— Buybacks of $38 million at an average price of $34.25 signal undervaluation, but the program could be curtailed
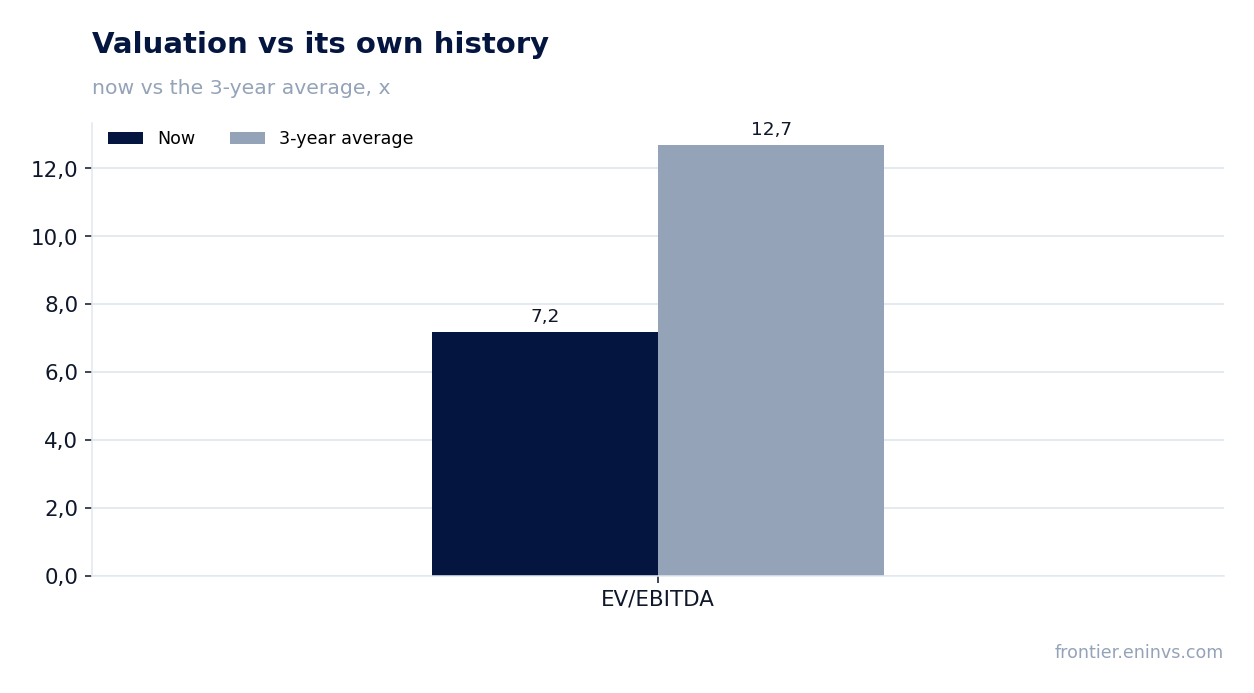
— EV/EBITDA of 7.19 versus a historical 12.70 — a discount to its own history, yet the portal model points to overvaluation
Attractiveness
Key figures, USD bn
| Metric | Q2 2025 | Q2 2026 | Change |
|---|---|---|---|
| Revenue | 1.30 | 1.56 | +20.2% |
| EBITDA | 0.39 | 0.60 | +53.6% |
| Operating profit | 0.20 | 0.38 | +83.3% |
| Net profit | 0.17 | 0.29 | +71.9% |
| Operating cash flow | 0.49 | 0.44 | -10.9% |
| Capex | 0.18 | 0.31 | +71.3% |
| EBITDA margin | 30.2% | 38.6% | +8.4 pp |
| Net margin | 12.8% | 18.4% | +5.6 pp |
Revenue fell 20.2% but EBITDA rose 53.6% — the gap was created by derivatives and lower unit costs
Revenue in the second quarter of 2026 was $1,559.8 million, down 20.2% year on year. The decline is explained by prices: the average realised gas price before hedging fell 22% to $2.66 per Mcf. However, total production rose 21% to 4.1 Bcfe/d, partially offsetting the price pressure.
EBITDA, by contrast, rose 53.6% to $602.8 million. The main source is derivative gains: $160.6 million versus $53.4 million a year earlier. Without this line, EBITDA would be significantly lower. The second factor is lower unit costs: total cash operating costs fell 11% to $2.38 per Mcfe, linked to the integration of HG Energy assets.
The EBITDA margin rose to 38.6% from 30.2% a year earlier. This increase is a combination of a one-off factor (derivatives) and a real improvement in the cost structure. Excluding derivatives, the margin increase would be less pronounced. Nevertheless, the $0.29 per Mcfe cost reduction is a sustainable achievement that the company says will continue.
Record production of 4.1 Bcfe/d lifted volumes 21%, yet gas prices dropped 22%
Average daily production in the second quarter of 2026 reached a record 4,144 MMcfe/d, up 21% from a year earlier. The increase was driven by a full quarter of operation of the acquired HG Energy assets. The company also noted drilling success: 26 Marcellus wells were brought online, and one well became the longest in company history at over 24,000 feet.
However, the price environment remains weak. The average realised gas price before hedging fell 22% to $2.66 per Mcf. Prices for C3+ NGLs rose 17% to $44.33 per barrel, and oil rose 57% to $78.60 per barrel, but their share of revenue is smaller. As a result, total revenue fell 20.2%.
The company raised its full-year 2026 production guidance to 4.15–4.2 Bcfe/d, expecting further growth in the fourth quarter to 4.4–4.5 Bcfe/d. This should support revenue even with weak gas prices. However, the lowered guidance for the NYMEX premium to $0.05–$0.15 per Mcf indicates caution in assessing price differentials.
Derivative gains of $160.6 million are a one-off that may vanish next quarter
In the income statement, the line 'Commodity derivative fair value gains' was $160.6 million, up 201% from $53.4 million a year earlier. This is the key factor behind the 71.9% increase in net income to $286.4 million. Without this gain, profit would have been significantly lower and the dynamics far more modest.
Derivatives are hedges the company uses to protect against price fluctuations. Their fair value changes with market prices, and gains or losses are recognised in the income statement even if the contracts are not closed. Next quarter, if gas prices move, this line could turn into a loss. The company does not control this factor, and it is unrelated to operational efficiency.
Nevertheless, management emphasises that the hedging strategy reduces cash flow volatility. The release notes that although Henry Hub fell 16% year on year, adjusted EBITDAX rose 57%. This indeed shows that hedges work, but their contribution to profit is unstable.
Leverage of 1.55x EBITDA is moderate, but absolute debt rose to $4,615.3 million
Net debt at the end of the second quarter of 2026 was $4,615.3 million, up $1.1 billion from a year earlier. The increase is linked to the acquisition of HG Energy and subsequent strategic purchases. The net debt to EBITDA ratio for the trailing twelve months is 1.55 — a moderate level for the industry, but the company does not disclose the previous value of this ratio, so the direction of change is unknown.
The debt structure changed: the company repaid 7.625% senior notes of $365.4 million and issued new 5.400% notes of $750 million, and also raised a $1.1 billion term loan. This reduces future interest expenses, but in the reporting quarter interest expense rose 88% to $37.5 million due to the larger total debt.
Debt servicing remains comfortable: EBITDA of $602.8 million for the quarter covers interest more than 16 times. However, the absolute increase in debt warrants attention, especially if gas prices remain low.
Adjusted free cash flow before working capital changes was $219.8 million, but capex rose to $340.7 million
Adjusted free cash flow before changes in working capital in the second quarter of 2026 was $219.8 million, up 41% from $156.3 million a year earlier. This is a positive signal, but it was achieved mainly through higher EBITDA rather than improved cash conversion.
Capital expenditures rose to $340.7 million from $208.4 million a year earlier. The increase is linked to drilling and completion, as well as land acquisitions of $29 million. The company is investing to maintain production and integrate new assets. As a result, operating cash flow of $438.8 million does not fully cover capital expenditures, and free cash flow after capex was $92.7 million.
The company repurchased 1.1 million shares for $38 million at an average price of $34.25. This indicates management's confidence in the stock being undervalued. The remaining buyback program is $880 million. However, if low gas prices persist and capex remains high, free cash flow could come under pressure.
Buybacks of $38 million at an average price of $34.25 signal undervaluation, but the program could be curtailed
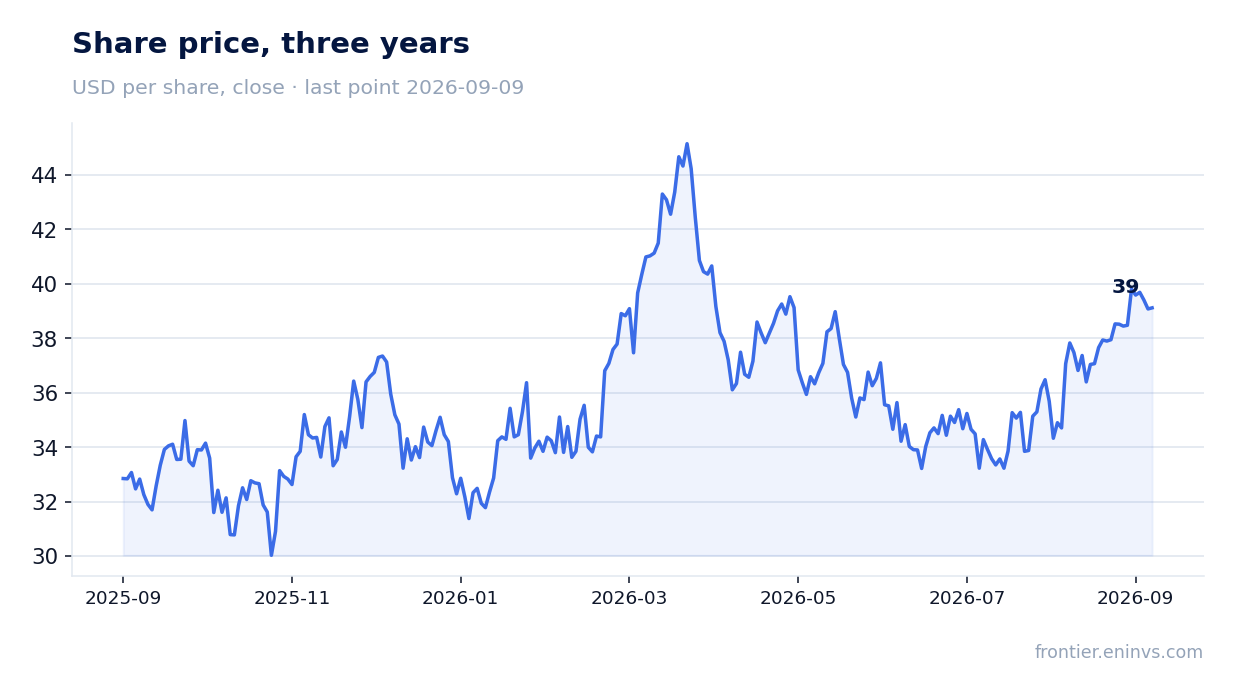
During the second quarter of 2026, Antero Resources repurchased 1.1 million of its shares for about $38 million at an average price of $34.25 per share. This is 3.7% above the closing price before the release ($33.88). From the release to September 9, the stock rose 15.5%, which may reflect the market's reaction to the buyback and operational results.
The company has $880 million remaining under its buyback program. Management stated it intends to act countercyclically, using opportunities to buy shares when prices fall. This supports the share price but does not guarantee further buybacks, especially if free cash flow declines.
Buying back at a price below the current market may benefit remaining shareholders if the company is indeed undervalued. However, if gas prices remain low, the company may prefer to direct funds to debt reduction or capital expenditures.
EV/EBITDA of 7.19 versus a historical 12.70 — a discount to its own history, yet the portal model points to overvaluation
The current EV/EBITDA for the trailing twelve months is 7.19, significantly below the three-year average of 12.70. This may indicate undervaluation relative to its own history. However, the P/E for the trailing twelve months is 10.75, also below historical levels but less dramatically so.
The portal's model, which reprices EBITDA at current commodity prices and the target EV/EBITDA, estimates fair value 32% below the current market price. This means that at current gas prices and the target multiple, the stock appears overvalued. The discrepancy with the historical discount is explained by the fact that the historical average EV/EBITDA was formed during a period of higher energy prices.
Market capitalisation is $12,077.9 million, and EV/EBITDA LTM is 7.19. If gas prices recover, the multiple could decline, but the current environment does not provide grounds for optimism. Investors should focus on the portal's model, which accounts for current prices, rather than historical multiples.
Valuation on the latest reported figures
| Metric | Value |
|---|---|
| Market cap | 12.1 bn USD |
| P/E (LTM) | 10.8 |
| EV/EBITDA (LTM) | 7.2 |
| P/B | 1.60 |
| Net debt / EBITDA (LTM) | 1.55 |
| Operating cash flow (LTM) | 1.60 bn |
| ROE | 14.0% |
| EV/EBITDA, 3-year average | 12.7 |
Bottom line
Antero Resources delivered record production and significant EBITDA growth, but this growth was mainly driven by one-off derivative gains and lower unit costs. Revenue fell 20.2% due to low gas prices, and the company raised production guidance to offset price pressure. Leverage is moderate (1.55x EBITDA), but absolute debt is rising. The stock trades at a discount to its historical EV/EBITDA, yet the portal model indicates a 32% overvaluation. Verdict — neutral: operational improvements are real, but the current price already reflects much of the positive, while risks of lower gas prices and the one-off nature of profit limit upside.
Open the company's financial profile AR →
See also: market overview · valuation map · stock screeners