Arm Holdings: revenue up 22.4%, but EBITDA margin compressed to 13.4% — and that's at 240x EV/EBITDA
25 августа Arm Holdings раскрыла результаты за второй квартал 2026 финансового года. Выручка выросла на 22,4% год к году, до 1 289 млн долл., однако EBITDA-маржа упала с 16,5% до 13,4%, а чистая прибыль подскочила на 107,7% — в основном за счёт разовых факторов. При текущей цене акция выглядит непривлекательно: мультипликатор EV/EBITDA почти вдвое выше собственного трёхлетнего среднего, а замедление роста и сжатие маржи не оправдывают такую оценку.
Key takeaways
— Revenue grew 22.4% in Q2, but that's a slowdown from 22.4% in the prior quarter
— EBITDA margin fell to 13.4% from 16.5% a year ago — cost growth outpaces revenue
— Net profit rose 107.7% thanks to one-off items, not operations
— Operating cash flow was $902 million in the quarter, but capex rose to $208 million
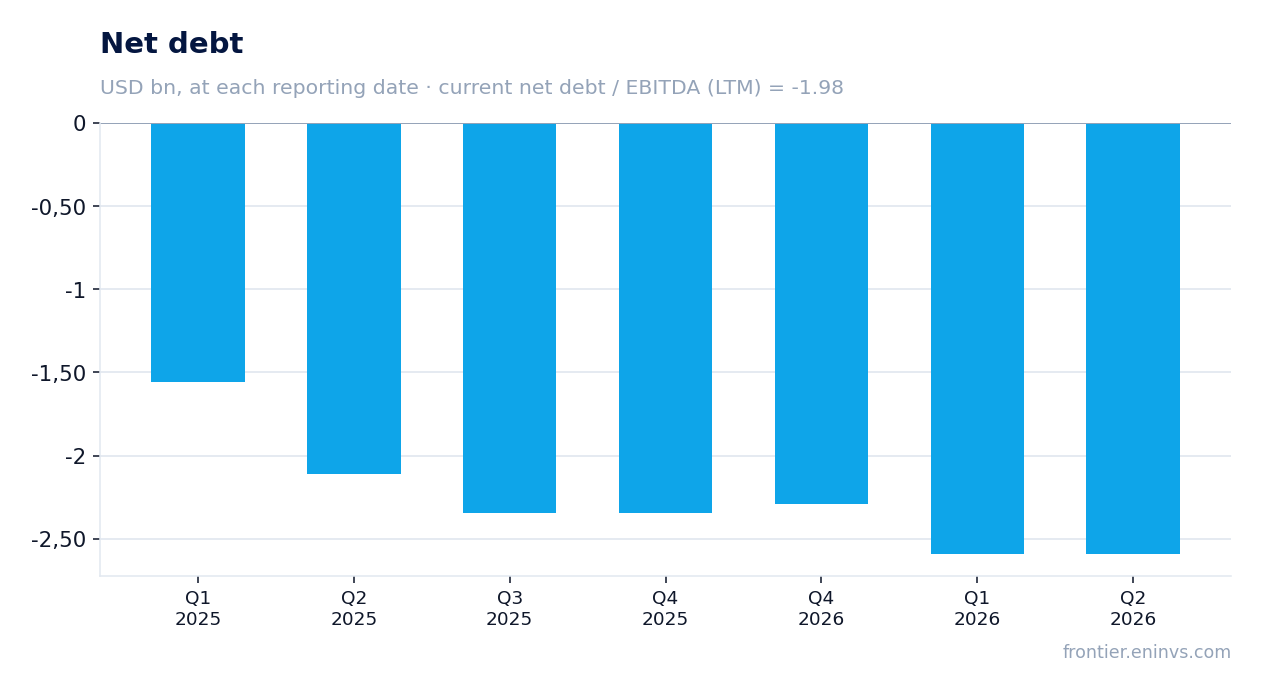
— Net debt is negative: minus $2,594 million at quarter-end
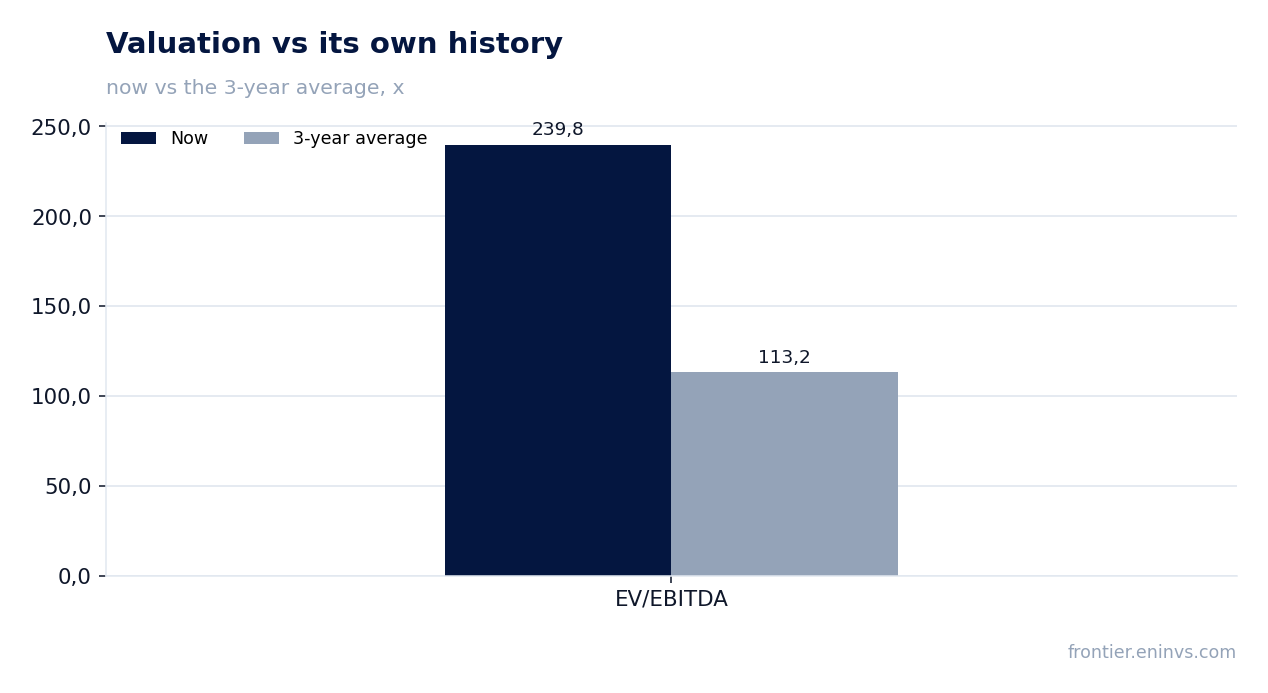
— EV/EBITDA at 239.8 — nearly double its own three-year average of 113.2
— On the portal's model, upside is 0% — fair value already reached
Attractiveness
Key figures, USD bn
| Metric | Q2 2025 | Q2 2026 | Change |
|---|---|---|---|
| Revenue | 1.05 | 1.29 | +22.4% |
| EBITDA | 0.17 | 0.17 | -0.6% |
| Operating profit | 0.11 | 0.10 | -14.0% |
| Net profit | 0.13 | 0.27 | +107.7% |
| Operating cash flow | 0.33 | 0.90 | +171.7% |
| Capex | -0.16 | -0.21 | — |
| EBITDA margin | 16.5% | 13.4% | -3.1 pp |
| Net margin | 12.3% | 20.9% | +8.6 pp |
Revenue grew 22.4% in Q2, but that's a slowdown from 22.4% in the prior quarter
In Q2 of fiscal 2026, Arm Holdings reported revenue of $1,289 million, up 22.4% year-over-year. However, in the prior quarter (Q1 FY2026) growth was the same — 22.4% — so there was no acceleration; quarter-on-quarter, the trend actually slowed: Q4 FY2025 saw 20.0% growth, and Q2 FY2026 came in at 13.6% year-over-year.
Over the trailing twelve months (LTM), revenue reached $5,200 million, reflecting steady but not explosive growth. The main driver remains licensing and royalties, but the pace is clearly cooling, which matters for valuation at such a high market cap.
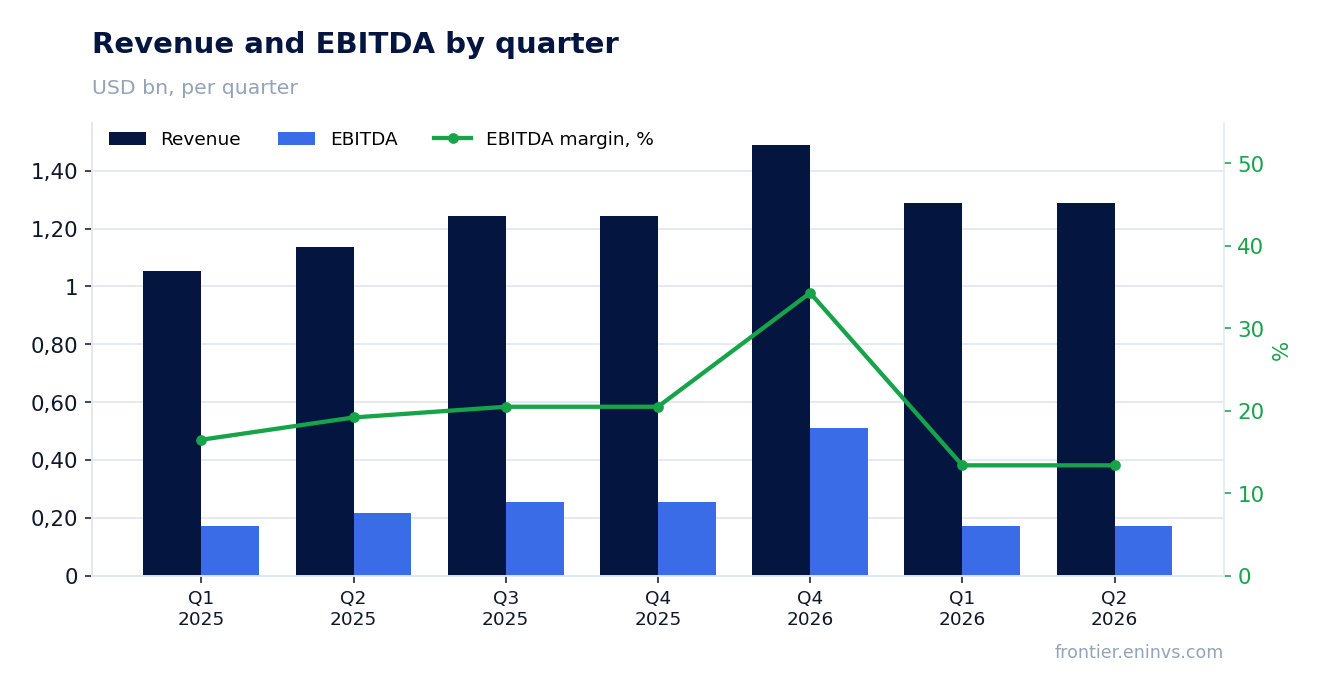
EBITDA margin fell to 13.4% from 16.5% a year ago — cost growth outpaces revenue
In Q2 FY2026, EBITDA was $173 million, down 0.6% year-over-year, while revenue grew 22.4%. As a result, EBITDA margin compressed to 13.4% from 16.5% in Q2 FY2025. This is a direct consequence of operating expenses growing faster than revenue — likely due to increased investment in R&D and headcount.
Over the trailing twelve months, EBITDA reached $1,157.3 million, but quarterly dynamics suggest the peak margin may be behind. If the company cannot stabilize costs, pressure on profitability will continue.
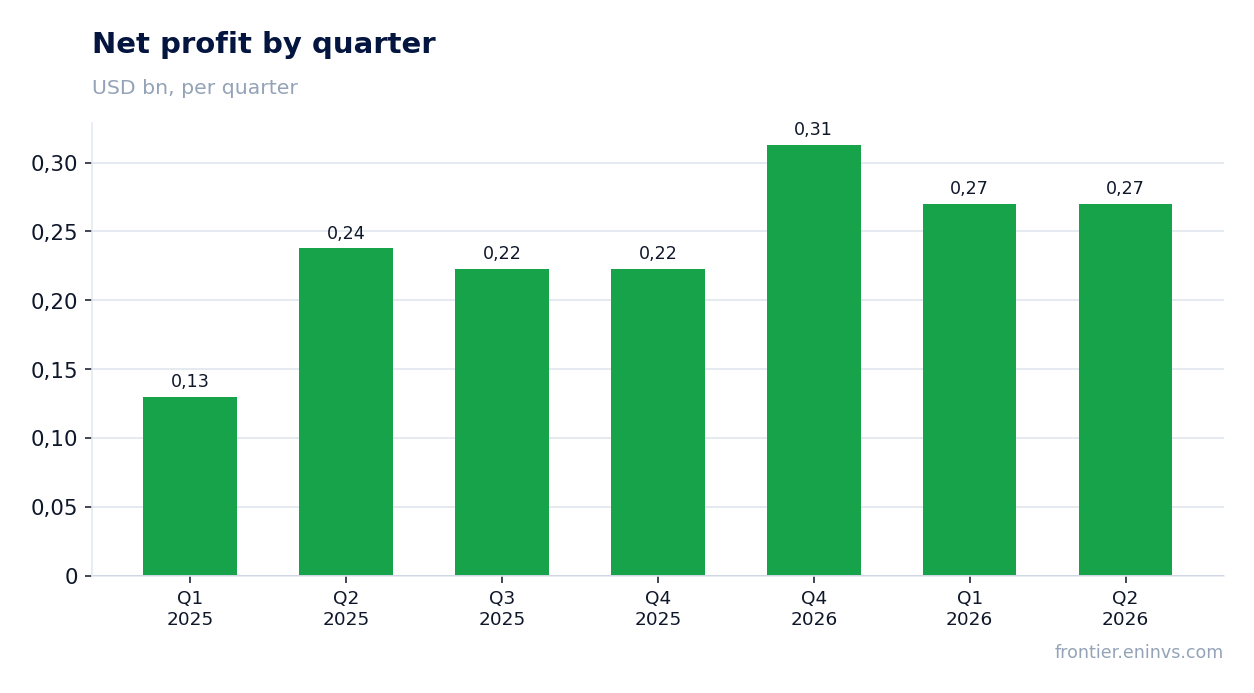
Net profit rose 107.7% thanks to one-off items, not operations
Net profit in Q2 FY2026 was $270 million, up 107.7% year-over-year. However, operating profit for the same period was only $98 million, indicating that the main contribution to net profit growth came from non-operating items, likely tax and interest effects or one-off gains.
This is an important nuance: investors seeing double-digit profit growth should understand it does not reflect improvement in the core business. Operating margin remains under pressure, and without one-off factors net profit would be significantly lower.
Operating cash flow was $902 million in the quarter, but capex rose to $208 million
In Q2 FY2026, operating cash flow reached $902 million — a significant inflow that helped boost the cash position. However, capital expenditures rose to $208 million from $184 million in the prior quarter, reflecting active investment in infrastructure and development.
Over the trailing twelve months, operating cash flow was $1,500 million, providing comfortable coverage of investments. But if capex continues to rise, free cash flow could shrink, especially as revenue growth slows.
Net debt is negative: minus $2,594 million at quarter-end
At the end of Q2 FY2026, net debt was –$2,594 million, meaning cash significantly exceeds debt obligations. Over the trailing twelve months, net debt decreased by $1.0 billion, reflecting strong cash generation.
Net debt to EBITDA for the trailing twelve months is –1.98, indicating a very conservative capital structure. This gives the company financial flexibility for investments and potential share buybacks.
EV/EBITDA at 239.8 — nearly double its own three-year average of 113.2
The current EV/EBITDA multiple is 239.8 — more than double its own three-year average of 113.2. Even considering strong revenue and profit growth, such a valuation implies exceptionally high growth rates for decades to come.
P/E LTM is also at 268.0, making the stock one of the most expensive in the semiconductor sector. With slowing revenue growth and margin compression, any negative surprise could lead to a significant correction.
On the portal's model, upside is 0% — fair value already reached
Our value-creation model, based on EBITDA growth and target multiple, shows that the stock's upside potential is 0% relative to current market cap. This means the market has already fully priced in expected future cash flows.
At such valuation, an investor receives no compensation for the risk of slowing growth or margin compression. Even a slight disappointment in upcoming reports could lead to a downward re-rating.
Valuation on the latest reported figures
| Metric | Value |
|---|---|
| Market cap | 280 bn USD |
| P/E (LTM) | 268.0 |
| EV/EBITDA (LTM) | 239.8 |
| P/B | 33.77 |
| Net debt / EBITDA (LTM) | -1.98 |
| Operating cash flow (LTM) | 1.50 bn |
| ROE | 12.5% |
| EV/EBITDA, 3-year average | 113.2 |
Bottom line
Arm Holdings shows strong revenue growth and generates significant operating cash flow, while negative net debt provides financial stability. However, operating efficiency is deteriorating: EBITDA margin has compressed, and net profit grew largely due to one-off items. Moreover, the stock's valuation is at an extremely high level — nearly double its own three-year average. Verdict — 'unattractive': the current price leaves no margin of safety, and any stumble in growth or margins could lead to a significant correction.
Open the company's financial profile ARM →
See also: market overview · valuation map · stock screeners