US_AVB: revenue growth slows, net profit down 42% on one-offs
25 августа US_AVB раскрыла результаты за второй квартал 2026 года: выручка выросла на 2,3% год к году до 777,8 млн долл., EBITDA – на 2,3% до 762,2 млн долл., но чистая прибыль упала на 42,0% до 155,7 млн долл. из-за разовых статей. При текущей цене акция выглядит скорее привлекательно: стабильный рост, высокая маржа и умеренный долг, но замедление динамики и разовые факторы требуют осторожности.
Key takeaways
— Q2 revenue grew only 2.3% – the slowest in five quarters
— EBITDA margin remained high at 98.0%, but net profit fell 42% on one-offs
— Operating cash flow of 364.1 million and capex of just 77.6 million in the quarter
— Net debt down 0.3 billion in the quarter but up 0.4 billion over the year
— ROE of 5.3% is below the cost of capital
Attractiveness
Key figures, USD bn
| Metric | Q2 2025 | Q2 2026 | Change |
|---|---|---|---|
| Revenue | 0.76 | 0.78 | +2.3% |
| EBITDA | 0.75 | 0.76 | +2.3% |
| Operating profit | 0.51 | 0.53 | +3.0% |
| Net profit | 0.27 | 0.16 | -42.0% |
| Operating cash flow | 0.38 | 0.36 | -3.6% |
| Capex | 0.00 | 0.08 | — |
| EBITDA margin | 98.1% | 98.0% | -0.1 pp |
| Net margin | 35.3% | 20.0% | -15.3 pp |
Q2 revenue grew only 2.3% – the slowest in five quarters
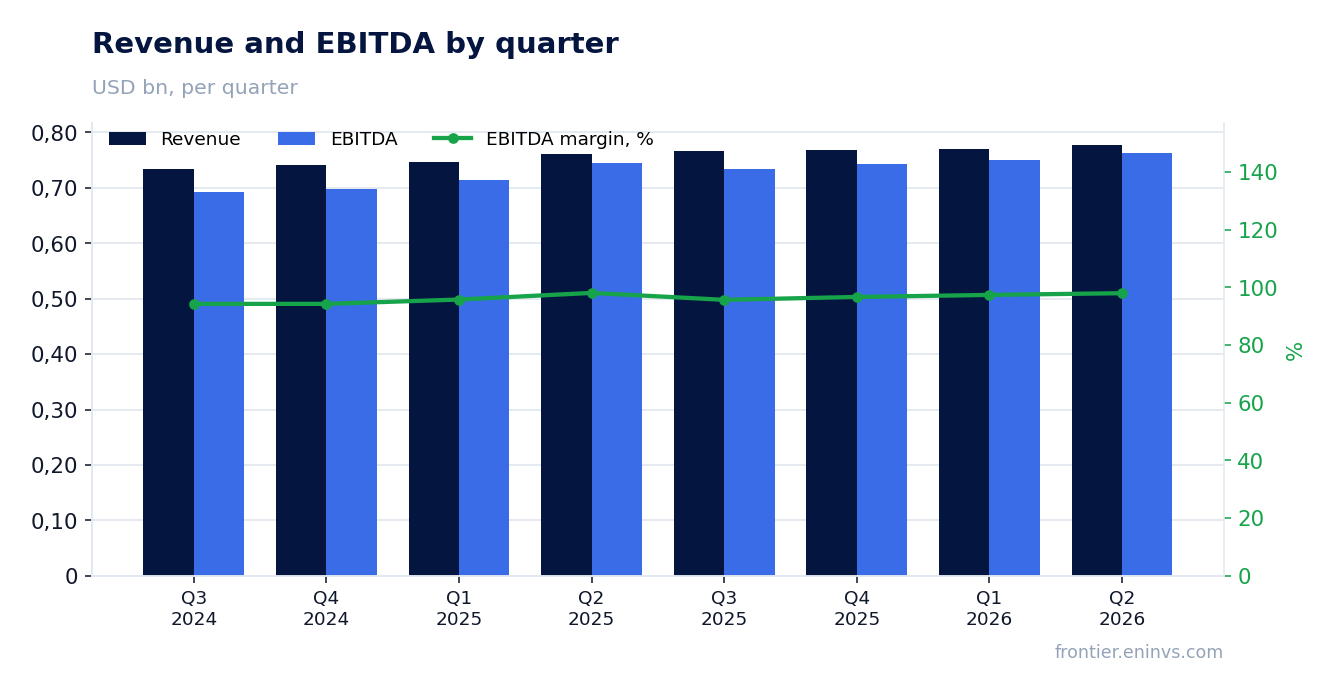
In Q2 2026, US_AVB's revenue reached 777.8 million, up 2.3% year-over-year. This is a noticeable slowdown from previous quarters: Q1 2026 grew 3.3%, and a year ago growth was 4.7%.
Over the trailing twelve months, revenue reached 3,100.0 million, confirming a trend of gradually cooling growth. Not critical yet, but worth watching: if the slowdown persists, it could affect valuation.
EBITDA margin remained high at 98.0%, but net profit fell 42% on one-offs
EBITDA in Q2 grew 2.3% to 762.2 million, with a margin of 98.0% – nearly unchanged from 98.1% a year ago. Operating profit rose to 529.2 million, indicating stability in the core business.
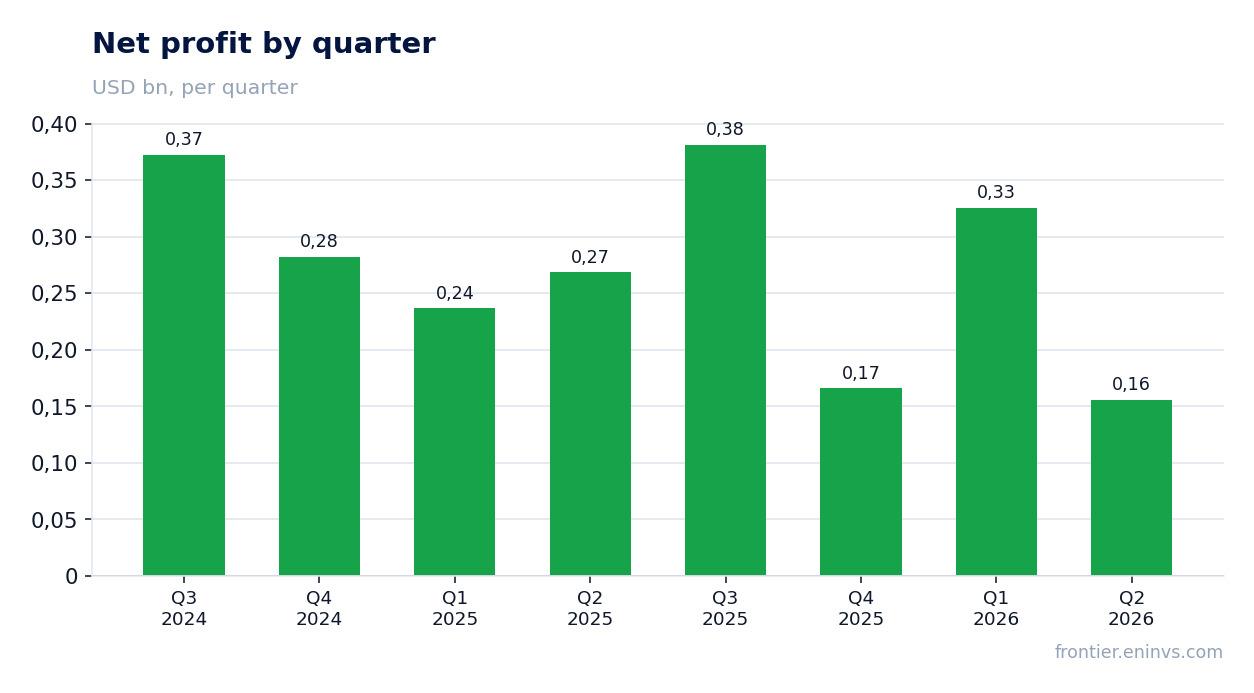
However, net profit fell 42.0% to 155.7 million, and net margin contracted from 35.3% to 20.0%. This divergence from operating metrics points to one-off items – likely higher financial expenses or revaluation losses. Without these, profit would have been significantly higher.
Operating cash flow of 364.1 million and capex of just 77.6 million in the quarter
In Q2, operating cash flow was 364.1 million, down 3.6% from 377.8 million a year earlier. Capital expenditures were minimal at 77.6 million, resulting in strong free cash flow.
Over the trailing twelve months, operating cash flow reached 1,700.0 million, confirming the company's cash generation ability. Low capex is typical for a REIT structure, where investments are made through acquisitions rather than capital expenditures.
Net debt down 0.3 billion in the quarter but up 0.4 billion over the year
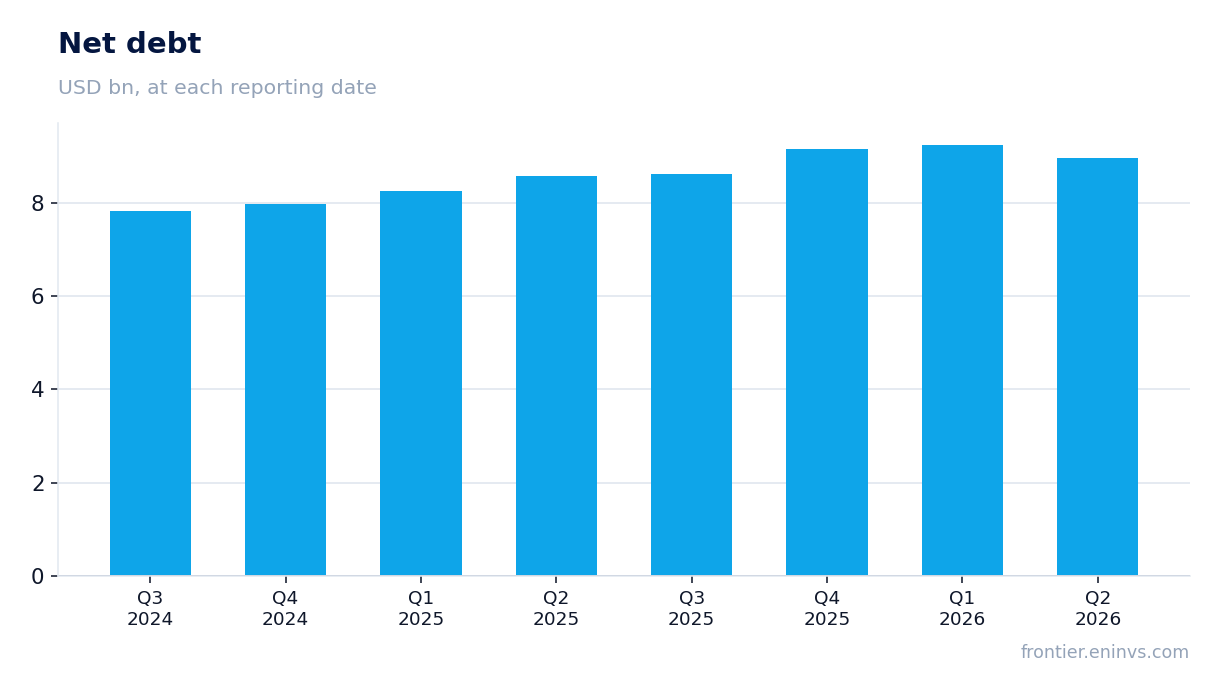
At quarter-end, net debt was 8,944.1 million, down 294.9 million from 9,239.0 million at the end of Q1. This is positive: the company is reducing leverage.
However, over the past twelve months, net debt increased by 0.4 billion – from 8,557.3 million in Q2 2025. Given that EBITDA over the last twelve months was around 3,000 million, leverage remains moderate, but the upward trend needs monitoring.
ROE of 5.3% is below the cost of capital
Return on equity was 5.3%, well below the typical cost of capital for public companies (usually 8–10%). This means the company creates value for shareholders slower than it could.
Low ROE is explained by a high equity base typical for REITs and moderate net profit. If one-offs recur, ROE may stay at this level, limiting dividend growth potential.
Valuation on the latest reported figures
| Metric | Value |
|---|---|
| Operating cash flow (LTM) | 1.70 bn |
| ROE | 5.3% |
Bottom line
In Q2, US_AVB showed stable operating dynamics: revenue and EBITDA grew 2.3%, margins remained high, and free cash flow was substantial. However, net profit fell 42% due to one-offs, distorting the picture, and revenue growth is slowing. Leverage remains moderate, but debt increased over the year. At the current price, the share looks rather attractive for conservative income-seeking investors, but the key question is whether the company can sustain growth and avoid repeating one-off losses.
Open the company's financial profile AVB →
See also: market overview · valuation map · stock screeners