BXP: Revenue Accelerates to +3.1%, but Profit Falls 23% on One-Off Charges
On July 28, 2026, BXP reported results for the second quarter of 2026. Revenue grew 3.1% year-over-year to $895.7 million, EBITDA rose 2.7%, but net profit fell 23.0% to $68.6 million due to one-off impairment and losses from joint ventures. At the current price, the share looks rather attractive: the business generates stable cash flow, and leverage is declining despite quarterly earnings volatility.
Key takeaways
— Revenue accelerated to +3.1% on higher rents and occupancy
— EBITDA margin declined 0.3 p.p. due to higher operating expenses
— Net profit fell 23% on one-off impairment and joint venture losses
— Operating cash flow rose to $446.1 million, covering capex and dividends
— Net debt declined to $2,801.9 million, improving leverage
— Company reaffirmed 2026 FFO guidance at $6.99–$7.05 per share
Attractiveness
Key figures, USD bn
| Metric | Q2 2025 | Q2 2026 | Change |
|---|---|---|---|
| Revenue | 0.87 | 0.90 | +3.1% |
| EBITDA | 0.48 | 0.49 | +2.7% |
| Operating profit | 0.26 | 0.26 | +0.9% |
| Net profit | 0.09 | 0.07 | -23.0% |
| Operating cash flow | 0.35 | 0.45 | +26.3% |
| Capex | 0.00 | — | — |
| EBITDA margin | 55.3% | 55.0% | -0.3 pp |
| Net margin | 10.2% | 7.7% | -2.5 pp |
Revenue accelerated to +3.1% on higher rents and occupancy
In Q2 2026, BXP's revenue reached $895.7 million, up 3.1% year-over-year. This marks an acceleration from the previous quarter's 0.8% growth. The main driver was higher rental revenue: portfolio occupancy rose to 88.4% from 87.4% in Q1, and leased percentage reached 91.3%.
Revenue growth was also supported by parking and other income, which increased 18% quarter-over-quarter. The company continues to benefit from strong demand for premium office space in key markets—Boston, New York, and San Francisco.
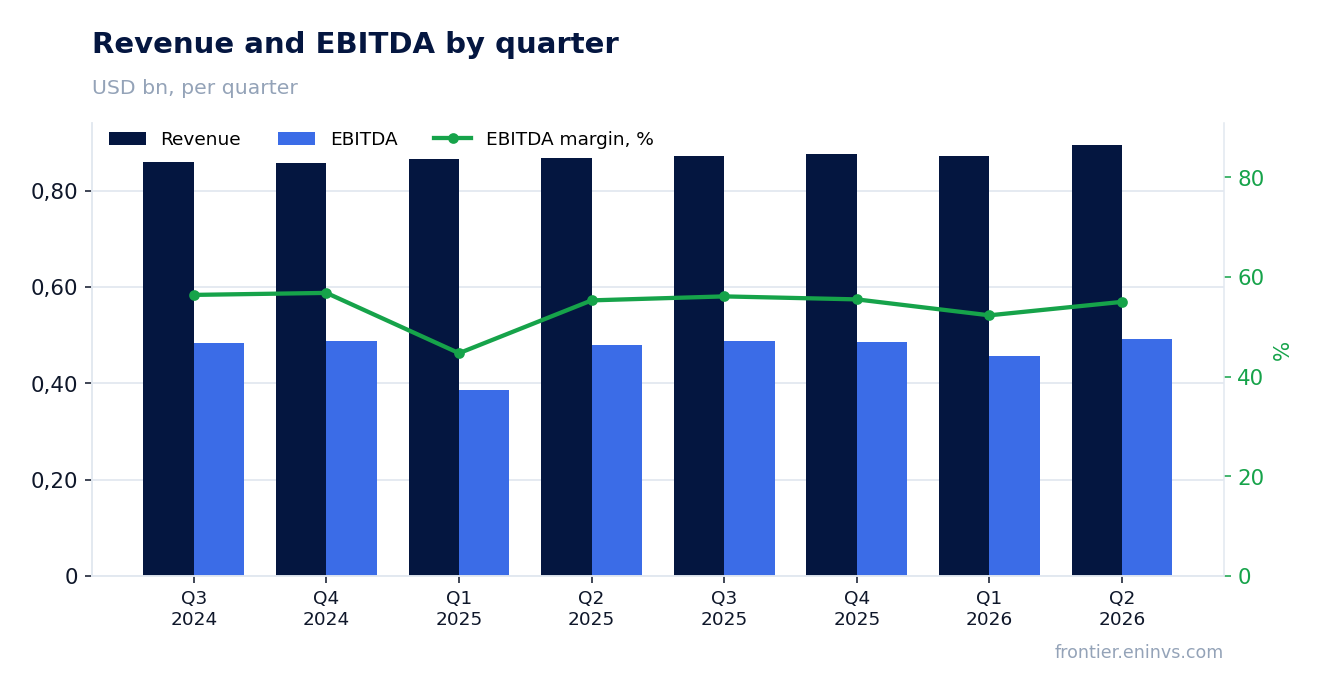
EBITDA margin declined 0.3 p.p. due to higher operating expenses
EBITDA in Q2 rose 2.7% to $492.9 million, but EBITDA margin declined to 55.0% from 55.3% a year earlier. Pressure came from operating expenses: they increased to $192.4 million from $201.8 million in Q1, though they were lower a year ago.
The margin decline is modest and mainly due to higher management and property tax costs. Nevertheless, BXP maintains one of the highest margins among office REITs thanks to its premium portfolio and efficient operations.
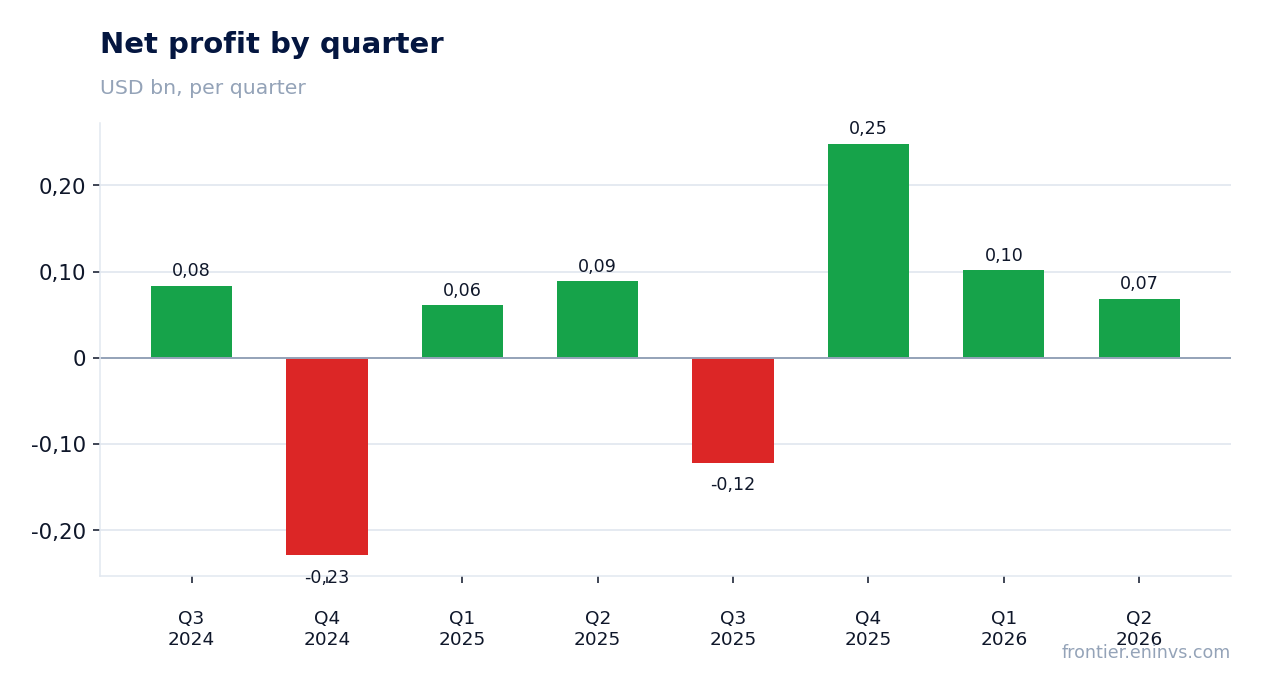
Net profit fell 23% on one-off impairment and joint venture losses
Net profit in Q2 was $68.6 million, down 23% year-over-year. The main reasons were a one-off impairment of $18.0 million on the Sumner Square property in Washington, DC, being prepared for sale, and a loss from joint ventures of $2.4 million versus a profit a year earlier.
Excluding these factors, operating profit rose 0.9% to $258.9 million. The company also recorded $7.0 million in gains from property sales, partially offsetting the charges. Net margin declined to 7.7% from 10.2%.
Operating cash flow rose to $446.1 million, covering capex and dividends
Operating cash flow in Q2 reached $446.1 million—the best quarterly figure in two years. This comfortably covers capital expenditures, which were about $30.8 million in the quarter (excluding development investments).
Free cash flow after capex is sufficient to cover dividends: the company pays $0.70 per share quarterly, and the annual distribution of about $124 million is covered by operating cash flow. The FAD payout ratio was 87.5%—high but sustainable.
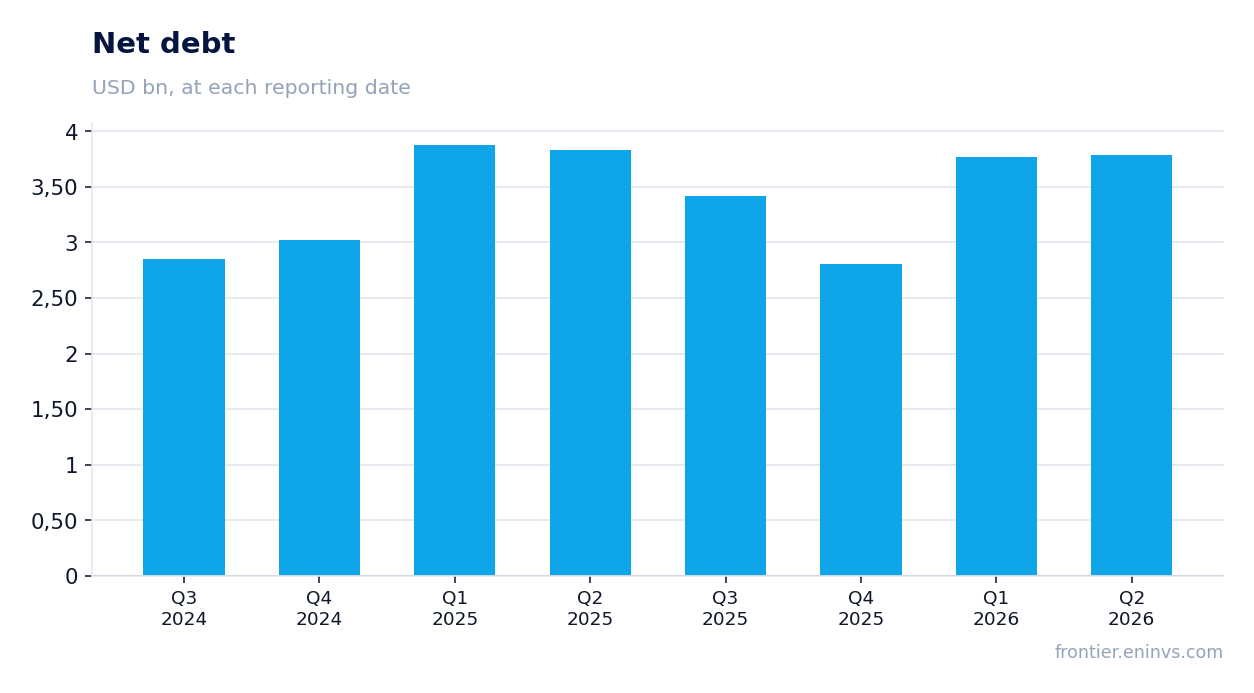
Net debt declined to $2,801.9 million, improving leverage
At quarter-end, BXP's net debt stood at $2,801.9 million, well below the 2025 peaks when it exceeded $3,800 million. The reduction was driven by strong operating cash flow and asset sales.
The net debt to EBITDA ratio (BXP's Share) declined to 7.94x from 8.50x in the prior quarter. The company retains investment-grade ratings of BBB (S&P) and Baa2 (Moody's), ensuring access to cheap debt financing.
Company reaffirmed 2026 FFO guidance at $6.99–$7.05 per share
BXP reaffirmed its 2026 diluted FFO guidance at $6.99–$7.05 per share. This implies growth compared to 2025, when FFO was around $6.80. The guidance incorporates expected occupancy of 88.5–89.25% and same-property NOI growth of 1.8–2.6%.
Management also expects net interest expense of $595–588 million, lower than 2025 levels due to debt reduction. The reaffirmation provides investors with confidence in cash flow stability.
Valuation on the latest reported figures
| Metric | Value |
|---|---|
| Operating cash flow (LTM) | 1.20 bn |
| ROE | 5.3% |
Bottom line
The reported quarter showed steady revenue growth and strong operating cash flow, confirming the quality of BXP's portfolio. One-off impairment and joint venture losses distorted net profit but do not affect the company's ability to generate cash. Debt reduction and reaffirmed FFO guidance support the investment case. However, high leverage (7.94x Net Debt/EBITDA) and moderate growth warrant caution. At the current price, the share looks rather attractive for income-oriented investors, but not for those seeking rapid capital appreciation.
Open the company's financial profile BXP →
See also: market overview · valuation map · stock screeners