Citigroup: profit up 45%, but operating cash flow turned negative by $24 billion

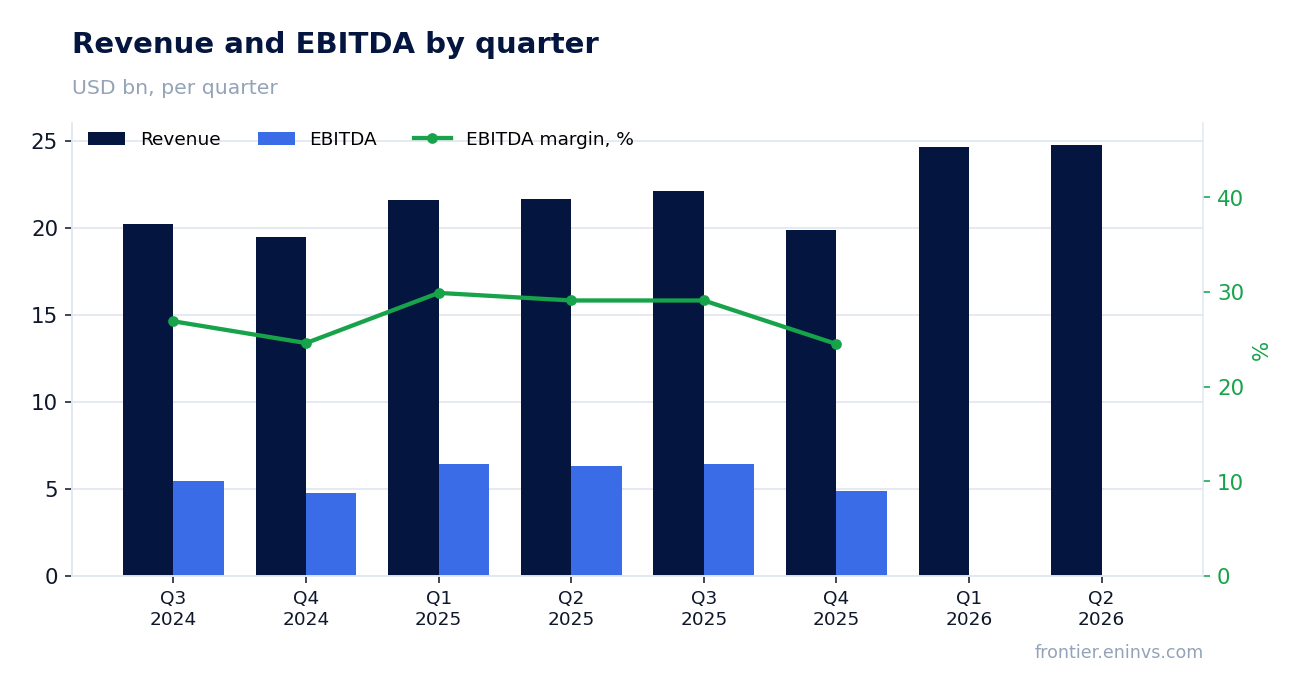
On July 14, Citigroup reported second-quarter 2026 results: revenue rose 14.3% to $24,766 million, net profit increased 45.1% to $5,831 million. However, operating cash flow in the reported quarter was negative $24,079 million, reflecting movements in client balances and positions rather than deteriorating operations. At the current price, the share looks rather attractive: the bank is growing revenue at double-digit rates, improving margins, and maintaining adequate capital levels.
Key takeaways
— Revenue grew 14.3% driven by strong results in Services and Markets
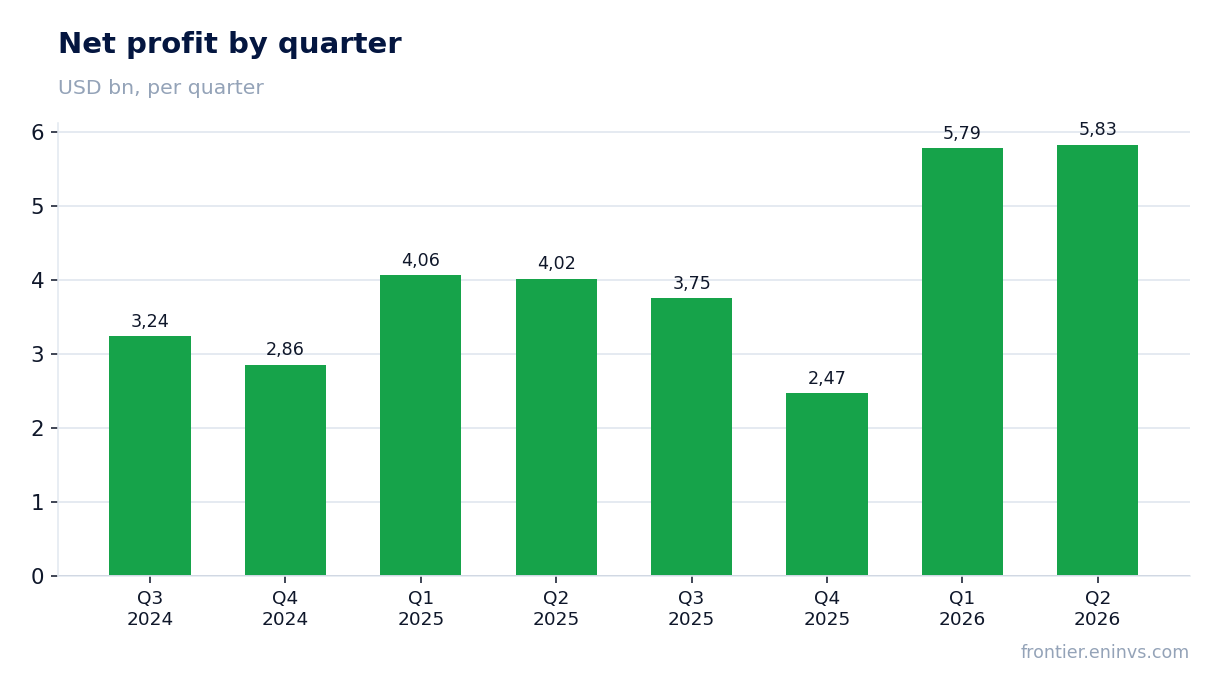
— Net profit increased 45.1% on revenue growth and operating leverage
— Net margin expanded to 23.5% from 18.5% a year earlier
— Operating cash flow negative due to client balance movements
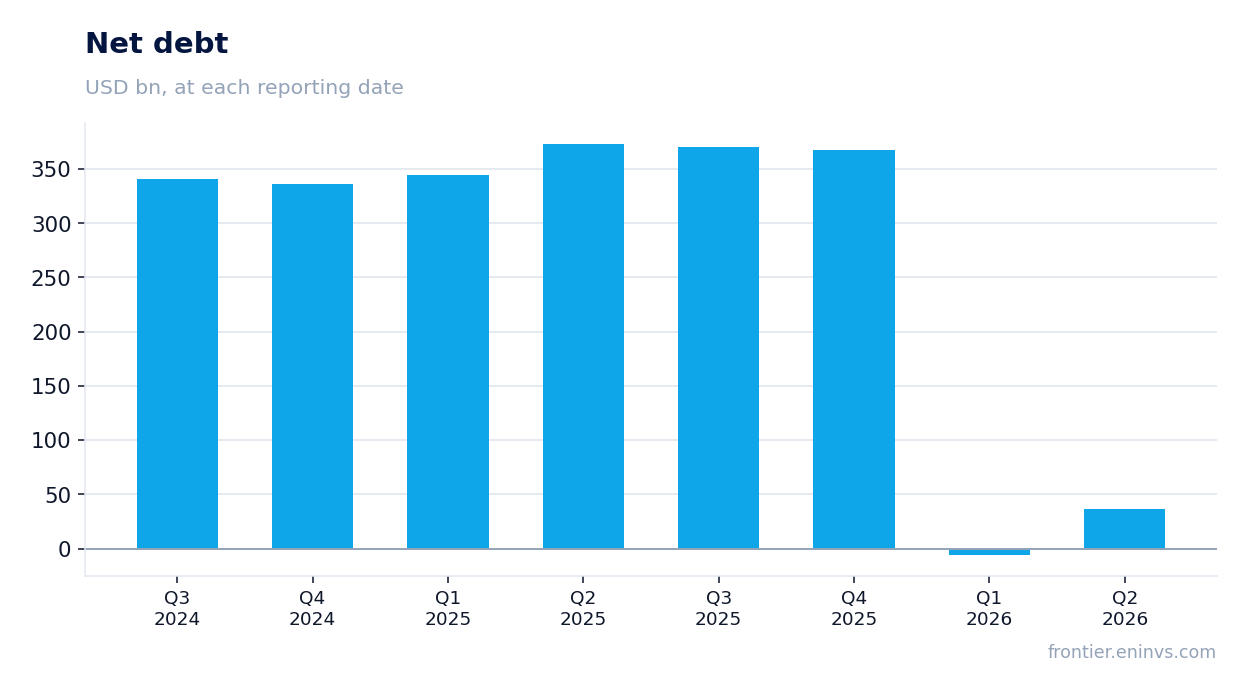
— Debt burden increased: net debt rose by $42.4 billion in the quarter
— Capital remains solid: CET1 ratio 12.8%, ROE 11.0%
— Bank reduces headcount and continues share buybacks
Attractiveness
Key figures, USD bn
| Metric | Q2 2025 | Q2 2026 | Change |
|---|---|---|---|
| Revenue | 21.7 | 24.8 | +14.3% |
| EBITDA | 6.30 | — | — |
| Net profit | 4.02 | 5.83 | +45.1% |
| Operating cash flow | -36.6 | -24.1 | — |
| Capex | 1.75 | 1.55 | -11.6% |
| EBITDA margin | 29.1% | — | — |
| Net margin | 18.5% | 23.5% | +5.0 pp |
Revenue grew 14.3% driven by strong results in Services and Markets
In the second quarter of 2026, Citigroup's revenue reached $24,766 million, up 14.3% from a year earlier. The main drivers were the Services and Markets segments: Services revenue grew 18% to $6,382 million, Markets – 17% to $7,007 million. The bank also saw growth in Banking (+34%) and Wealth (+13%).
Revenue growth accelerated compared with previous quarters: in the first quarter of 2026 the pace was 14.1%, in the second – 14.3%. This points to sustained demand for the bank's services in both corporate and investment segments.
Net profit increased 45.1% on revenue growth and operating leverage
Net profit in the second quarter of 2026 reached $5,831 million, up 45.1% from a year earlier. Profit growth significantly outpaced revenue growth thanks to operating leverage: operating expenses rose only 5%, while revenue increased 14.3%.
Efficiency also improved: the efficiency ratio fell to 57.4% from 62.7% in the second quarter of 2025. This shows the bank is controlling costs and scaling its business.
Net margin expanded to 23.5% from 18.5% a year earlier
Net margin in the second quarter of 2026 was 23.5% versus 18.5% in the same period a year earlier. The margin expansion reflects not only operating leverage but also a lower effective tax rate: income taxes rose 69%, but slower than pre-tax profit (+54%).
Return on equity (ROE) over the trailing twelve months was 11.0%, above the average for large US banks. This confirms the bank's ability to generate shareholder returns.
Operating cash flow negative due to client balance movements
Operating cash flow in the second quarter of 2026 was minus $24,079 million. For a bank, this metric is not an indicator of operating efficiency: it reflects changes in client deposits, margin accounts, and other balance sheet items. A similar pattern was seen in the first quarter of 2026 (minus $21,873 million) and in the second quarter of 2025 (minus $36,579 million).
Capital expenditures are small relative to the scale of the business – $1,551 million in the quarter. Main investments are directed to technology and digital infrastructure, supporting long-term competitiveness.
Debt burden increased: net debt rose by $42.4 billion in the quarter
Net debt at the end of the second quarter of 2026 stood at $36,315.5 million, up $42.4 billion from the end of the first quarter (minus $6,092.6 million). Over the trailing twelve months, net debt increased by $56.0 billion. The rise in debt is linked to balance sheet growth: assets increased 10% year-on-year, including growth in the loan portfolio and trading assets.
Despite higher debt, the bank's capital position remains solid: the CET1 ratio was 12.8% at the end of June 2026, above minimum requirements. Total Capital ratio reached 15.7%.
Capital remains solid: CET1 ratio 12.8%, ROE 11.0%
The CET1 capital ratio stood at 12.8% at the end of June 2026, slightly above the first-quarter level (12.75%). The bank maintains a cushion above regulatory minimums, allowing continued shareholder payouts and growth investments.
Return on equity (ROE) over the trailing twelve months reached 11.0%, and return on tangible common equity (RoTCE) in the second quarter was 13.0%. These are above average levels of recent years and reflect improved operating efficiency.
Bank reduces headcount and continues share buybacks
Citigroup's headcount fell to 219 thousand at the end of June 2026 from 230 thousand a year earlier, down 5%. This is part of an efficiency program that is already yielding results in lower operating expenses.
The bank is also actively returning capital to shareholders: shares outstanding decreased 9% year-on-year – from 1,840.9 million to 1,677.4 million. Buybacks support earnings per share growth: in the second quarter, EPS rose 61% to $3.15.
Valuation on the latest reported figures
| Metric | Value |
|---|---|
| Operating cash flow (LTM) | 67.6 bn |
| ROE | 11.0% |
Bottom line
Citigroup delivered a strong quarter: revenue grew 14.3%, net profit rose 45.1%, and margin expanded to 23.5%. Growth was supported by operating leverage and headcount reduction, not one-off items. However, operating cash flow remains negative, and net debt increased by $56.0 billion over the year – this warrants attention. With ROE of 11.0% and CET1 of 12.8%, the bank looks rather attractive, but investors should watch credit quality trends and the bank's ability to generate positive cash flow in the future.
Open the company's financial profile C →
See also: market overview · valuation map · stock screeners