Extra Space Storage: revenue down 18%, EBITDA up — a quarter where falling sales became a reason for optimism
28 июля Extra Space Storage раскрыла результаты за второй квартал 2026 года. Выручка упала на 18,0% год к году, до 690,2 млн долл., но EBITDA выросла на 4,8%, до 577,8 млн долл., а чистая прибыль — на 5,5%, до 263,5 млн долл. Квартал показывает, что компания выходит из фазы сжатия: операционная эффективность и ancillary-бизнесы компенсируют слабость выручки. Акции выглядят привлекательно: при скромной оценке и улучшении прогнозов по Core FFO на 2026 год, потенциал роста сохраняется.
Key takeaways
— Revenue fell 18%, but this is an effect of asset sales and disposals, not weakening demand
— EBITDA margin rose to 83.7% from 65.5% a year ago — due to structure, not operational leverage
— Same-store revenue grew 2.4% and expenses fell 0.5% — the operating base is stable
— Net debt fell to $800.2 million from $1,823.8 million a year ago — the financial cushion strengthened
— Core FFO per share grew 4.9% and the 2026 outlook was raised — management sees a recovery
— The dividend was maintained at $1.62 per share — cash flow covers the payout
Attractiveness
Key figures, USD bn
| Metric | Q2 2025 | Q2 2026 | Change |
|---|---|---|---|
| Revenue | 0.84 | 0.69 | -18.0% |
| EBITDA | 0.55 | 0.58 | +4.8% |
| Operating profit | 0.37 | 0.39 | +4.9% |
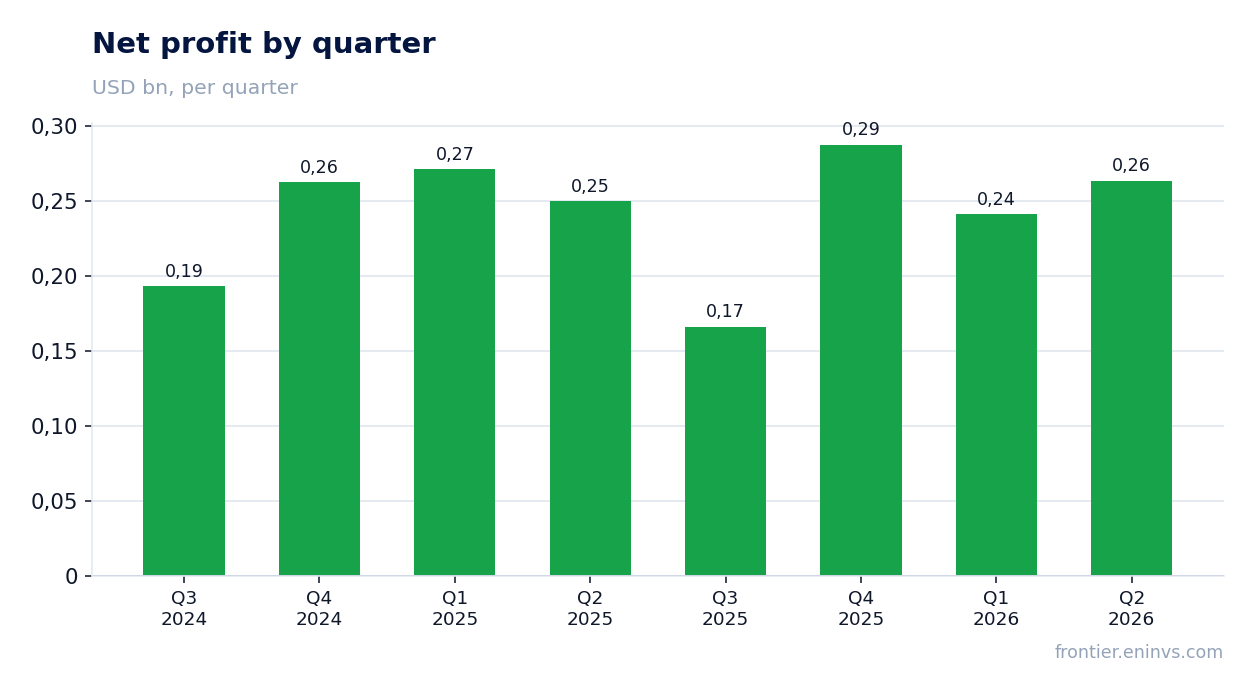
| Net profit | 0.25 | 0.26 | +5.5% |
| Operating cash flow | 0.54 | 0.59 | +7.8% |
| Capex | 0.16 | 0.09 | -46.3% |
| EBITDA margin | 65.5% | 83.7% | +18.2 pp |
| Net margin | 29.7% | 38.2% | +8.5 pp |
Revenue fell 18%, but this is an effect of asset sales and disposals, not weakening demand
In Q2 2026, total revenue was $690.2 million, down 18.0% year-over-year. However, this decline does not reflect deteriorating operations: the company actively sold and deconsolidated assets, reducing the base for revenue recognition. In particular, the report states that no properties were sold during the quarter, but over the year the company completed several transactions to exit joint ventures and sell real estate.
The key metric — same-store revenue — grew 2.4% year-over-year to $690.2 million (the coincidence with total revenue is because the same-store pool now includes almost all operating properties). This indicates that on a comparable basis demand is stable, and the decline in total revenue is a consequence of changes in the perimeter, not market weakness.
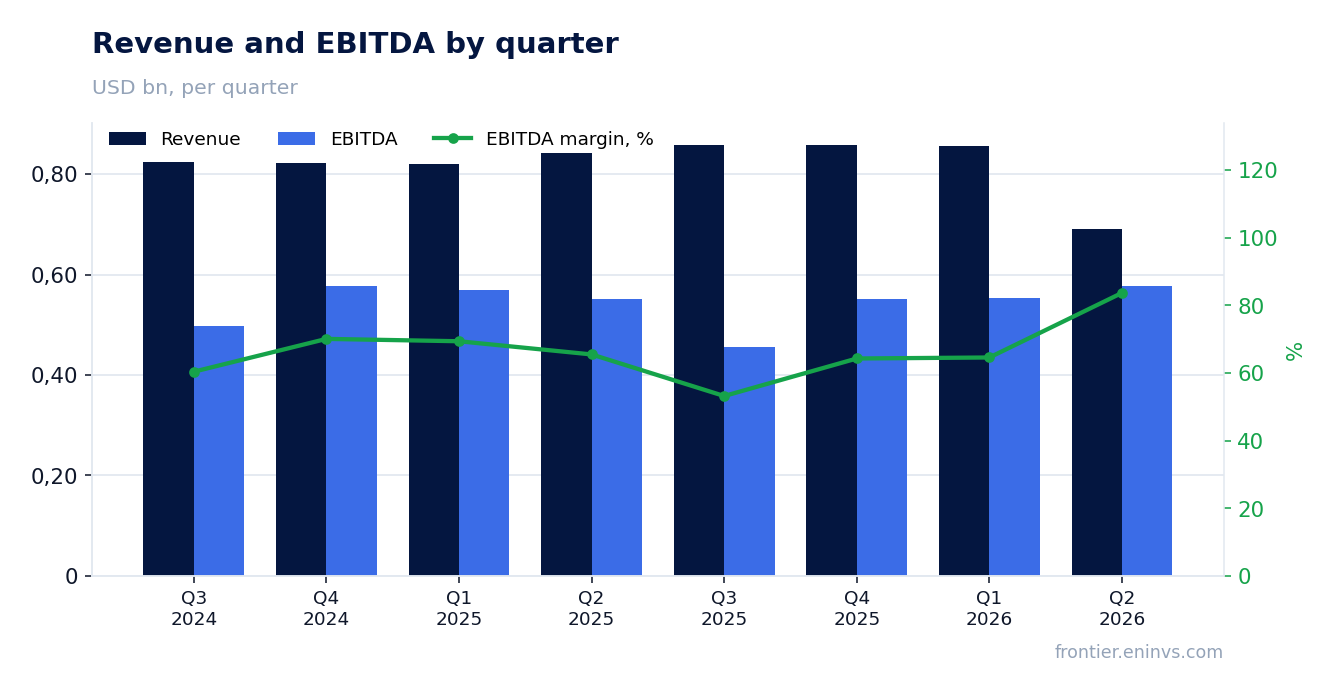
EBITDA margin rose to 83.7% from 65.5% a year ago — due to structure, not operational leverage
EBITDA for the quarter grew 4.8% year-over-year to $577.8 million, with EBITDA margin reaching 83.7% versus 65.5% a year earlier. This jump in margin is explained not so much by improved operational efficiency as by a change in revenue structure: asset sales and disposals increased the share of management fees and tenant reinsurance income, which have high margins.
Operating profit grew 4.9% to $392.2 million, confirming that even with declining revenue the company can increase profit through higher-margin segments. However, investors should remember that such a margin is not sustainable in the long term if revenue continues to decline due to asset sales.
Same-store revenue grew 2.4% and expenses fell 0.5% — the operating base is stable
On a comparable basis (1,870 properties), revenue grew 2.4% year-over-year to $690.2 million, while operating expenses fell 0.5% to $194.1 million. As a result, same-store NOI increased 3.5% to $496.1 million. This indicates that the company is controlling costs, especially in repairs and maintenance (down 15.5%) and marketing (down 4.6%).
Same-store occupancy was 94.2% at quarter-end, only slightly below the year-ago level of 94.4%. This indicates stable demand and no pricing pressure. NOI growth on a comparable basis is the main indicator of business health, and it is positive.
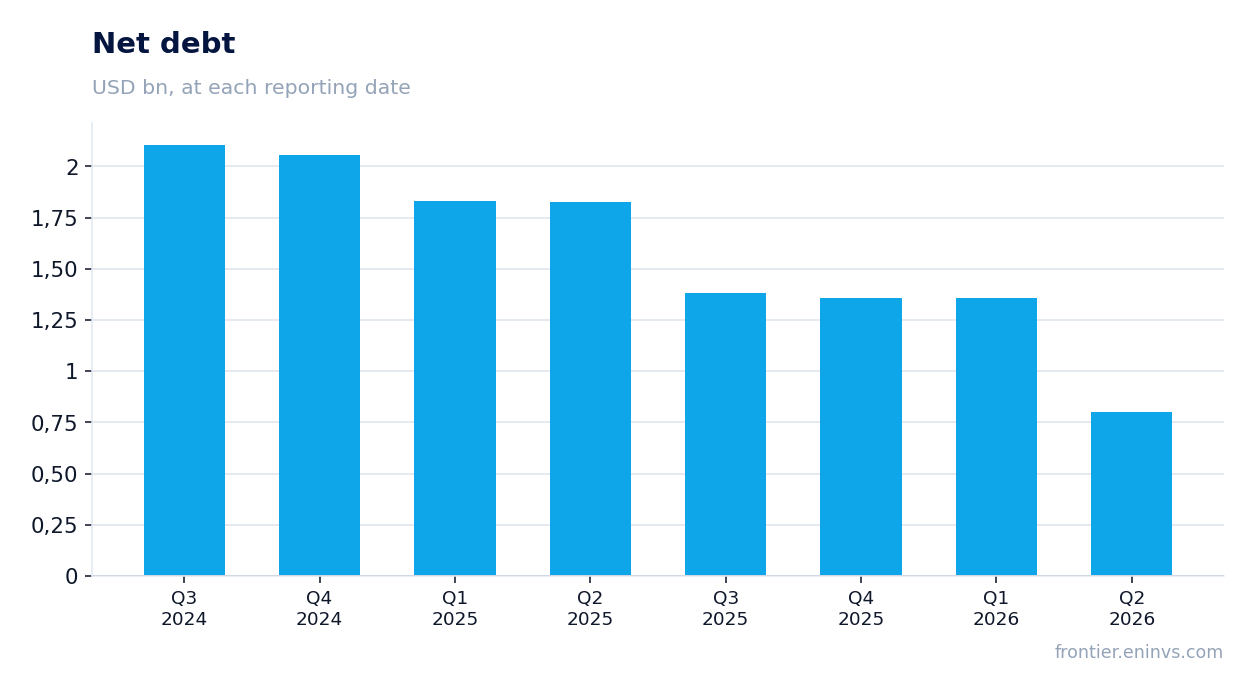
Net debt fell to $800.2 million from $1,823.8 million a year ago — the financial cushion strengthened
At quarter-end, net debt was $800.2 million versus $1,823.8 million a year earlier — a reduction of more than half. This was made possible by asset sales and strong operating cash flow, which reached $1,900 million over the last twelve months. The company also placed $550 million in bonds in June, but judging by the dynamics of debt, the proceeds were used to repay more expensive liabilities.
The reduction in debt strengthens the balance sheet and lowers future interest expenses. The share of fixed-rate debt is 78.5%, and the average rate is 4.3%, providing predictability of interest payments. This is especially important in an environment where the market expects rate cuts.
Core FFO per share grew 4.9% and the 2026 outlook was raised — management sees a recovery
Core FFO per share in Q2 was $2.15, up 4.9% year-over-year. For the first half, Core FFO per share grew 3.5% to $4.19. Management raised its 2026 Core FFO outlook to a range of $8.25–$8.40 per share (previously $8.05–$8.35), implying acceleration in the second half.
The outlook raise was accompanied by improved same-store revenue expectations: the company now expects growth of 1.0–2.0% (previously -0.5% to +1.5%). This is a signal that management is confident in the continued recovery. The tenant reinsurance income outlook was also raised, and G&A expense expectations were lowered.
The dividend was maintained at $1.62 per share — cash flow covers the payout
The company paid a dividend of $1.62 per share for Q2, same as a year ago. The annual dividend is $6.48 per share, which at the current price gives a yield of about 4.5% (estimated, based on a price of around $145). Operating cash flow over the last twelve months was $1,900 million, which comfortably covers dividend payments (approximately $1,370 million per year).
Maintaining the dividend despite falling revenue is a sign of management's confidence in cash flow. Capital expenditures in Q2 were moderate at $86.8 million, leaving significant free cash flow after payouts.
Valuation on the latest reported figures
| Metric | Value |
|---|---|
| Operating cash flow (LTM) | 1.90 bn |
| ROE | 7.9% |
Bottom line
The quarter showed that Extra Space Storage is successfully adapting to the new reality: the decline in revenue due to asset sales is offset by higher margins and ancillary income. Same-store metrics — NOI growth of 3.5% — confirm the stability of the operating business. The reduction in debt and the raise in Core FFO guidance are positive signals. However, investors should watch whether the perimeter reduction becomes systemic and whether the company can resume organic revenue growth. At the current valuation and with improving forecasts, the shares look attractive.
Open the company's financial profile EXR →
See also: market overview · valuation map · stock screeners