EXTREME NETWORKS INC: reported profit tripled, but the market saw only a reason to sell

On 5 August EXTREME NETWORKS INC released results for the fourth quarter of fiscal 2026. Revenue came in at $338.6 million, GAAP net income at $18.0 million, adjusted EBITDA at $25.3 million. On paper this is the strongest quarter in the available history: a sixth consecutive quarter of double-digit revenue growth and a ninth consecutive quarter of sequential product revenue growth. Yet the stock fell 19.0% on the release day and has lost 33.6% since, and that divergence is the central fact of the report. At an LTM EV/EBITDA of 34.7 and an LTM P/E of 66.9, the shares are valued above their own history, while the portal's model implies only +12% upside to fair value. The verdict is neutral: the growth is real, but it is already paid for in the price, and the market's disappointment shows investors expected more.
Key takeaways
— Revenue grew 10.3% year-on-year, and the entire increase came from the product segment
— The margin expanded on lower operating expenses, not on gross profit
— The quarter's profit includes $5.7 million of one-off charges; without them the picture is more modest
— Free cash flow for the quarter was $65.3 million, but the full-year figure fell 25%
— Debt was reduced to net cash, but this is a one-off effect of refinancing
— Multiples are above their own history, and the portal's model implies only 12% upside
Attractiveness
Key figures, USD bn
| Metric | — | Q4 2026 | Change |
|---|---|---|---|
| Revenue | — | 0.34 | — |
| EBITDA | — | 0.03 | — |
| Operating profit | — | 0.02 | — |
| Net profit | — | 0.02 | — |
| Operating cash flow | — | 0.07 | — |
| Capex | — | 0.01 | — |
| EBITDA margin | — | 7.5% | — |
| Net margin | — | 5.3% | — |
Revenue grew 10.3% year-on-year, and the entire increase came from the product segment
Revenue for the fourth quarter of fiscal 2026 was $338.6 million, up 10.3% year-on-year and 6.8% quarter-on-quarter. This is the sixth consecutive quarter of double-digit year-on-year growth and the ninth consecutive quarter of sequential product revenue growth. The company attributes this to accelerating demand for the Extreme Platform ONE platform and improved product availability.
Product revenue increased by $26.6 million to $218.5 million, while subscription and support revenue added only $5.0 million to $120.1 million. The entire increase therefore came from the product segment, while the subscription component grew much more slowly. This matters because subscriptions are positioned as the foundation of future revenue.
SaaS ARR for the year reached $244.3 million, up 17.7% year-on-year and 3.4% quarter-on-quarter. ARR growth outpaces subscription revenue growth, indicating a building base, but it does not yet convert into comparable cash flow. The company notes that Extreme Platform ONE exceeded 30% of subscription bookings in its first year and doubled quarter-on-quarter, though absolute figures for this platform are not disclosed.
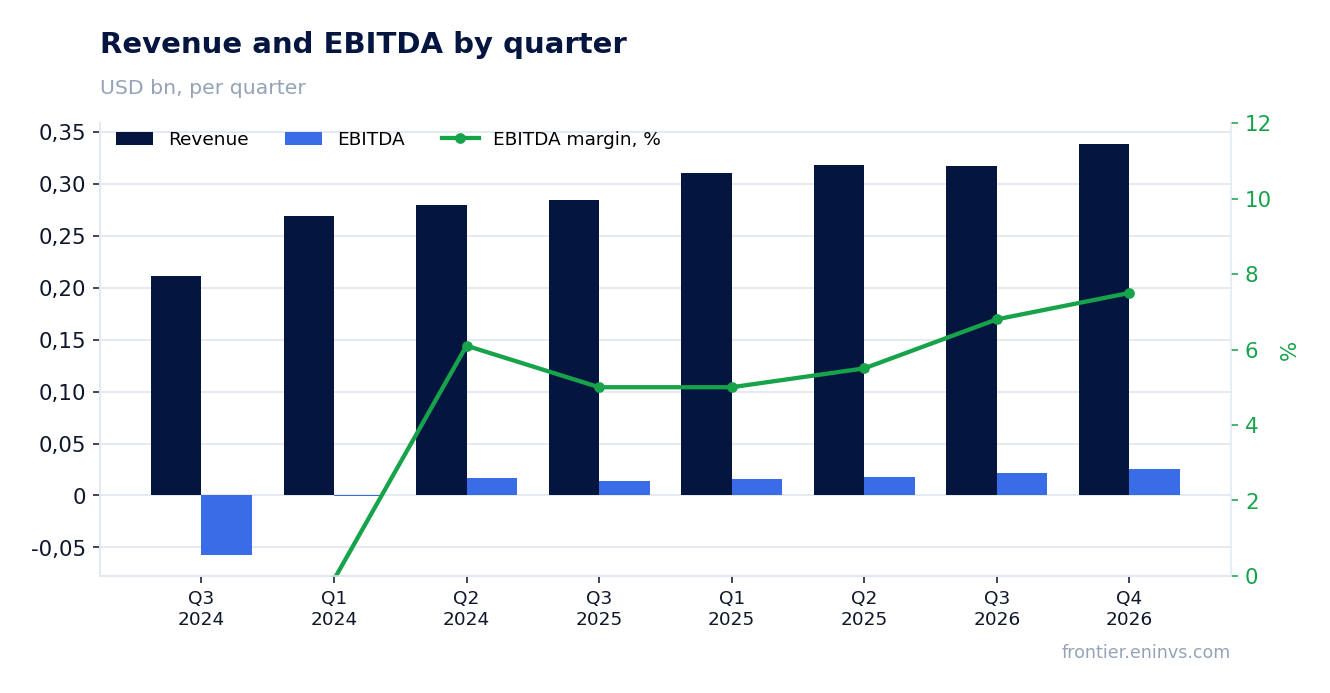
The margin expanded on lower operating expenses, not on gross profit
GAAP gross margin in the fourth quarter was 62.2% versus 61.6% a year earlier and 61.7% in the prior quarter. This is the third consecutive quarter of gross margin improvement. However, the main contribution to operating margin growth came not from gross profit but from lower operating expenses: total operating expenses fell by $1.0 million to $189.4 million, while revenue grew by $31.6 million.
Within operating expenses, research and development rose 5.2% and sales and marketing rose 12.2%, in line with business growth. But general and administrative expenses fell by $15.6 million to $31.9 million, which provided the operating leverage. The company does not explain the reason for this decline, but it may be related to one-off factors.
GAAP operating margin rose to 6.2% from negative 0.4% a year earlier. Non-GAAP operating margin reached 15.7% versus 15.2% a year earlier. The margin expansion led to GAAP net income of $18.0 million versus a loss of $7.8 million a year earlier. This is the first quarter with positive net income in several years.
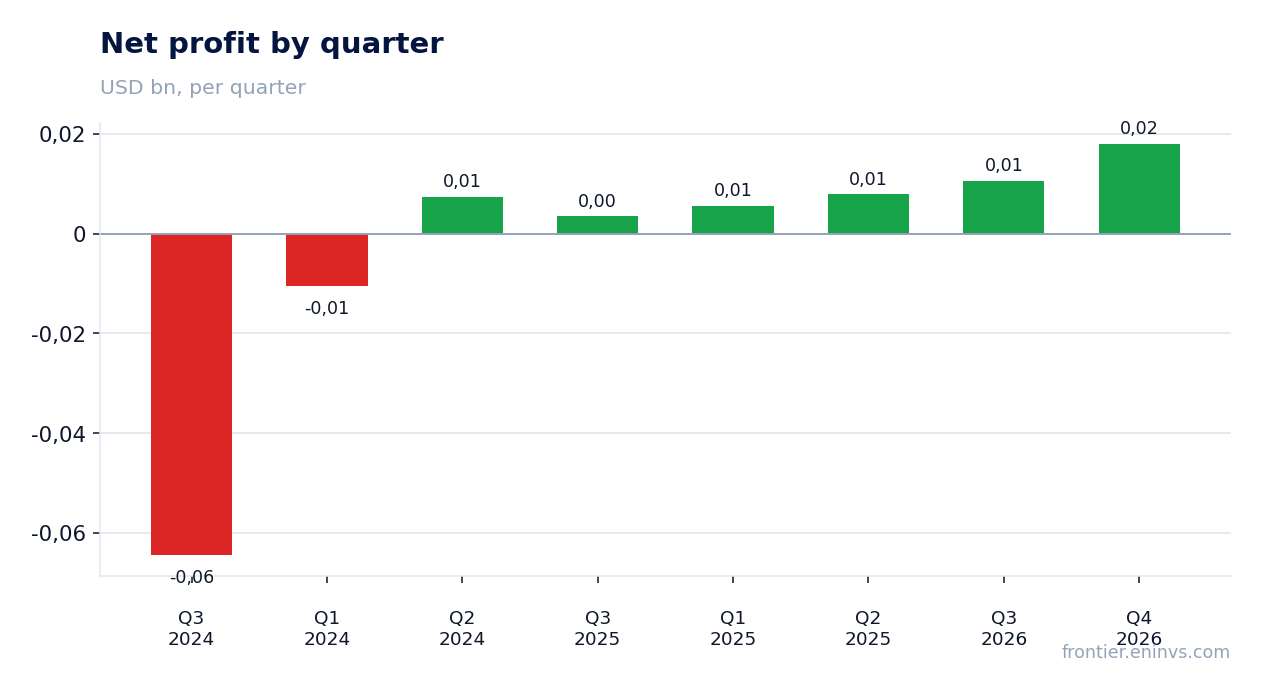
The quarter's profit includes $5.7 million of one-off charges; without them the picture is more modest
GAAP net income in the fourth quarter was $18.0 million, but it includes one-off items that the company excludes from adjusted figures. In particular, litigation charges were $5.7 million, system transition costs $3.4 million, and restructuring $0.7 million. Without these items profit would be higher, but they still reduce cash flow.
Non-GAAP net income was $43.4 million, or $0.32 per share, versus $33.5 million and $0.25 a year earlier. The gap between GAAP and non-GAAP profit is mainly explained by share-based compensation ($21.8 million) and the aforementioned one-off items. The company expects one-off items to persist in the first quarter of fiscal 2027: guidance includes litigation charges of 3.4–3.5% of revenue.
Importantly, full-year GAAP net income was $42.1 million versus a loss of $7.5 million a year earlier. This is the first profitable year in a long time. However, full-year non-GAAP profit was $143.1 million, more than three times the GAAP figure. Such a gap is typical for a company with a high share of stock-based compensation, but it means real profitability is lower than non-GAAP suggests.
Free cash flow for the quarter was $65.3 million, but the full-year figure fell 25%
Operating cash flow in the fourth quarter was $72.9 million, significantly higher than $14.2 million in the prior quarter. Free cash flow reached $65.3 million after deducting capital expenditures of $7.6 million. This is a strong quarterly result, which the company attributes to improved working capital management and revenue growth.
However, for the full fiscal year 2026, operating cash flow was $123.2 million versus $152.0 million a year earlier, and free cash flow was $95.3 million versus $127.3 million. The 25% decline was due to higher capital expenditures of $27.9 million and an increased outflow on prepaid expenses and other assets of $53.6 million. The company does not comment on this decline, but it contrasts with revenue and profit growth.
Capital expenditures in the fourth quarter were moderate at $7.6 million, or 2.2% of revenue. For the year they rose to $27.9 million, also 2.2% of revenue. This is a low level, but it is growing. The company does not disclose capital expenditure plans for fiscal 2027, but forecasts further revenue and profit growth.
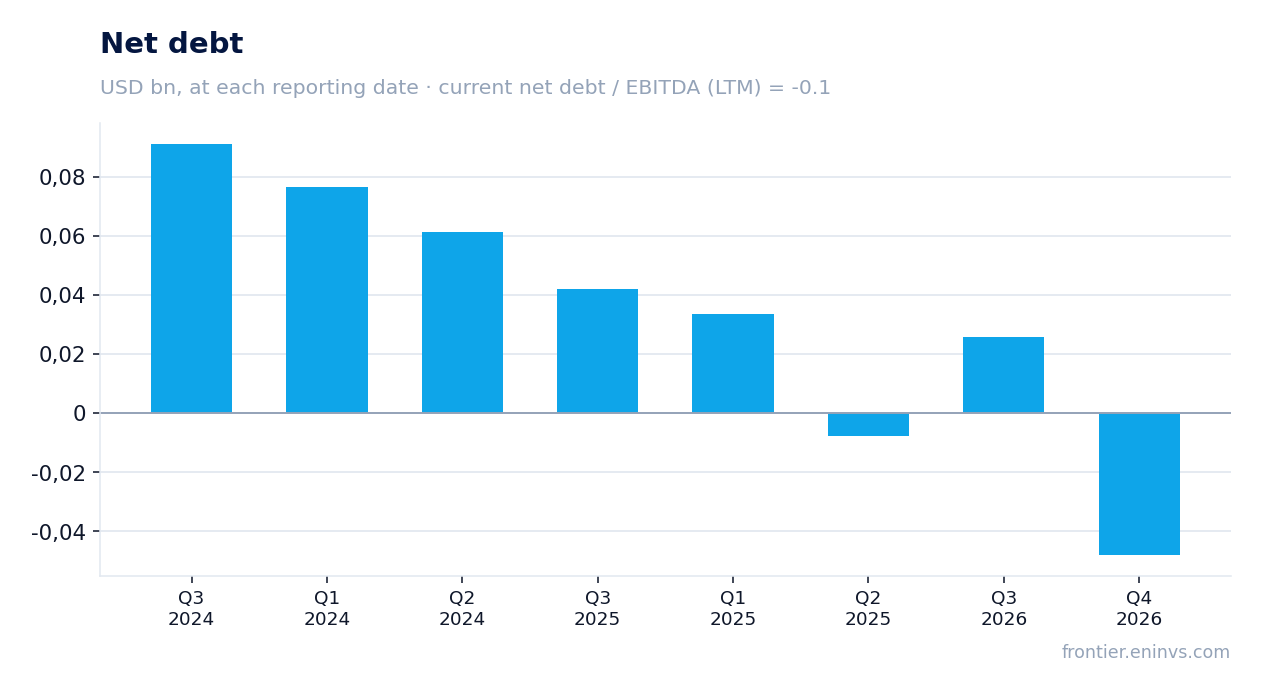
Debt was reduced to net cash, but this is a one-off effect of refinancing
At the end of the fourth quarter, the company's net debt was -$8.3 million, meaning it had net cash. This is a sharp improvement from the prior quarter, when net debt was $25.6 million. However, this change was mainly due to refinancing: on 29 July 2026, the company entered into a new $500 million revolving credit facility and repaid its existing term loan. The balance sheet shows $165.0 million of debt and $211.8 million of cash.
The net debt to LTM EBITDA ratio is -0.1, reflecting a net cash position. This is a very low level of leverage, giving the company financial flexibility. However, it is important to understand that this is a one-off effect of refinancing, not the result of organic debt reduction. In previous quarters, net debt fluctuated: in the third quarter of 2026 it was $25.6 million, in the second quarter of 2025 it was negative (-$7.7 million).
Interest expense for the year was $13.8 million versus $15.9 million a year earlier. The decline is due to partial debt repayment. The new facility has improved terms, which may reduce the cost of debt service in the future. The company does not disclose the interest rate on the new facility, but notes that it provides additional working capital for growth.
Multiples are above their own history, and the portal's model implies only 12% upside
At the time of the report, the company's market capitalisation was $2,815.9 million. With LTM EBITDA of $81.0 million and net debt of -$8.3 million, the LTM EV/EBITDA is 34.7. This is a high multiple, reflecting market expectations. For comparison, the company has historically traded at much lower multiples, but precise three-year data are not available in the FACTS. The LTM P/E is 66.9, also above historical levels.
The portal's model, based on EBITDA growth and a target multiple, implies +12% upside to fair value. This is our own estimate, not a market consensus. It assumes that current EBITDA growth continues but does not accelerate. If growth slows or margins decline, the upside could be smaller.
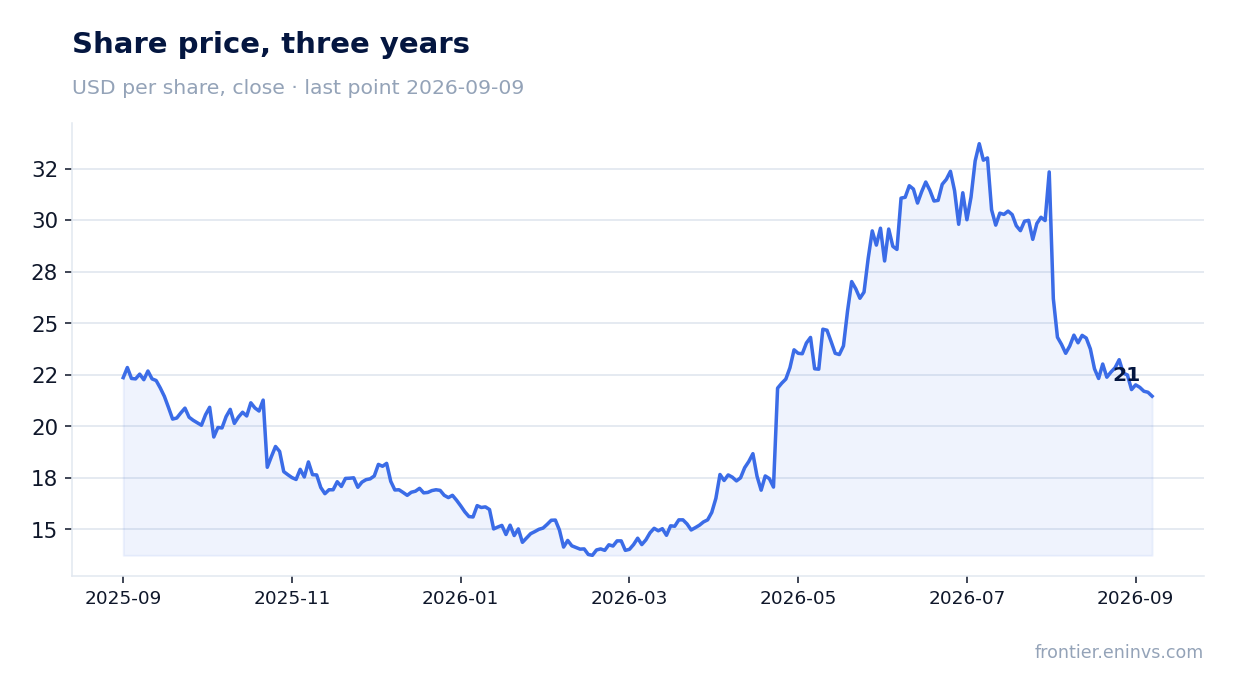
The market reaction to the report was sharply negative: the stock fell 19.0% on the release day and 33.6% from the report to 9 September 2026. This suggests the market expected stronger results or a more optimistic outlook. The company provided guidance for fiscal 2027: revenue of $1,380–1,400 million, implying growth of 7.5–9.1% year-on-year, and non-GAAP EPS of $1.28–1.33. This is below current growth rates, which may have disappointed investors.
Valuation on the latest reported figures
| Metric | Value |
|---|---|
| Market cap | 2.82 bn USD |
| P/E (LTM) | 66.9 |
| EV/EBITDA (LTM) | 34.7 |
| P/B | 42.94 |
| Net debt / EBITDA (LTM) | -0.10 |
| Operating cash flow (LTM) | 0.12 bn |
| ROE | 85.9% |
Bottom line
The report showed a strong quarter: revenue grew 10.3%, net income reached $18.0 million, and free cash flow was $65.3 million. However, the market reacted with a 19.0% decline, and the stock has lost 33.6% since the report. The reason lies in the fiscal 2027 guidance: revenue growth will slow to 7.5–9.1%, and one-off charges will persist. Multiples of 34.7 EV/EBITDA and 66.9 P/E are above their own history, and the portal's model implies only 12% upside. The verdict is neutral: the growth is real, but it is already in the price, and a re-rating would require either stronger guidance or lower multiples.
Open the company's financial profile EXTR →
See also: market overview · valuation map · stock screeners