HUBBELL INC: 15% revenue growth eaten by NSI deal costs, debt jumps to $5.2bn

28 июля HUBBELL INC раскрыла результаты за второй квартал 2026 года: выручка выросла на 15,3% до 1 711,8 млн долл., но чистая прибыль снизилась на 1,6% до 240,4 млн из-за затрат на интеграцию и рост процентных расходов. Акции на релизе упали на 2,9%, а с момента публикации до 9 сентября потеряли ещё 8,6%. При текущей цене бумага выглядит скорее непривлекательно: мультипликаторы выше собственной истории, а долг после покупки NSI Industries вырос до 5,2 млрд долл.
Key takeaways
— Revenue +15.3% driven by 10% organic growth and 5% M&A contribution
— Net profit fell 1.6% due to higher interest expense and NSI deal costs
— EBITDA margin contracted from 25.9% to 24.0% under inflation and tariff pressure
— Debt rose to $5.2bn after NSI acquisition, but Net Debt/EBITDA stayed at 1.5
— Dividend yield of 1.25% is below historical, and payouts may suffer from debt load
— Shares trade at a premium to own history: EV/EBITDA 19.7 vs 18.6 3-year average
— Portal model values fair price 7% below current
Attractiveness
Key figures, USD bn
| Metric | Q2 2025 | Q2 2026 | Change |
|---|---|---|---|
| Revenue | 1.48 | 1.71 | +15.3% |
| EBITDA | 0.38 | 0.41 | +6.7% |
| Operating profit | 0.34 | 0.35 | +3.7% |
| Net profit | 0.24 | 0.24 | -1.6% |
| Operating cash flow | 0.26 | 0.25 | -4.1% |
| Capex | 0.04 | 0.04 | -7.3% |
| EBITDA margin | 25.9% | 24.0% | -1.9 pp |
| Net margin | 16.5% | 14.0% | -2.5 pp |
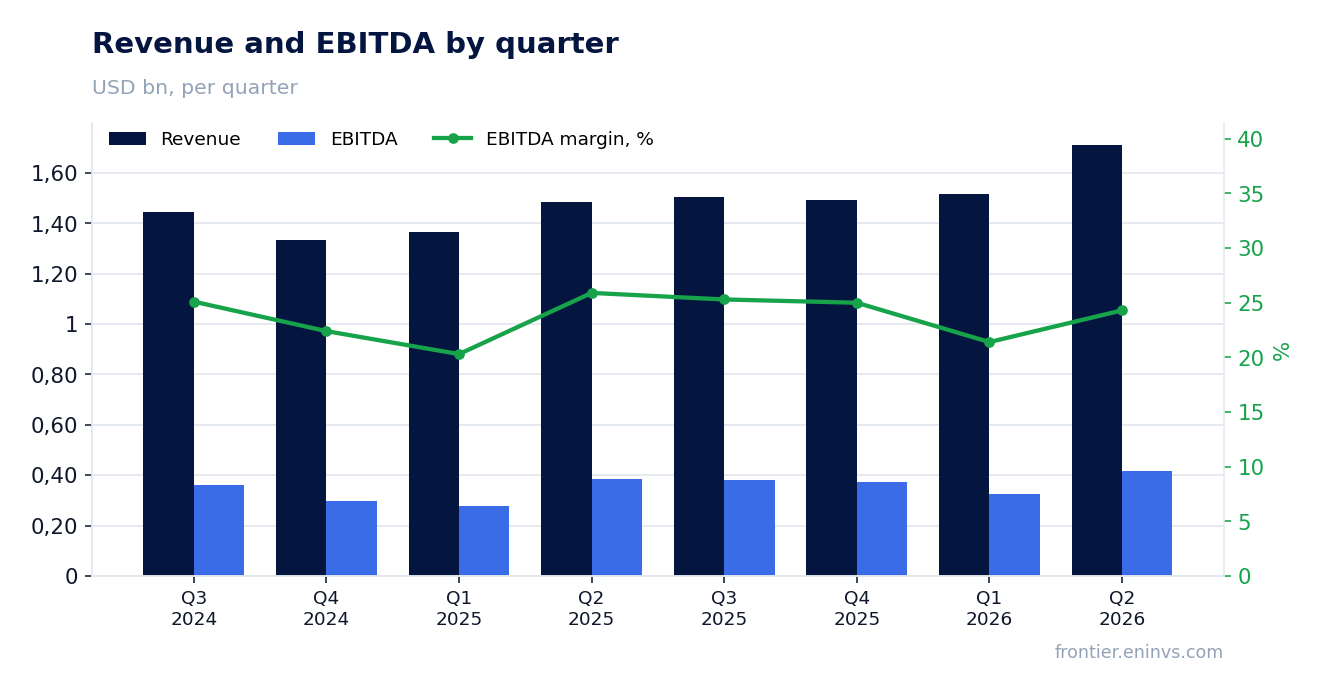
Revenue +15.3% driven by 10% organic growth and 5% M&A contribution
In Q2 2026, HUBBELL INC revenue grew 15.3% YoY to $1,711.8 million. Organic growth was 10.2%, with acquisitions adding 4.8%, primarily the NSI Industries purchase for $3.0 billion closed in April. The company cites megatrends supporting demand: grid modernization, load growth, and datacenter investment.
The Utility Solutions segment increased sales 10% to $1,025.8 million, with organic growth of about 6%. Within the segment, Grid Infrastructure grew 12%, while Grid Automation rose only 1%. The Electrical Solutions segment showed stronger dynamics: sales jumped 25% to $686.0 million, with organic growth of 18.3% and acquisitions contributing 6.5%.
For the first half, revenue reached $3,228.5 million, up 13.2% from the same period last year. Organic growth for the half was 9.2%.
Net profit fell 1.6% due to higher interest expense and NSI deal costs
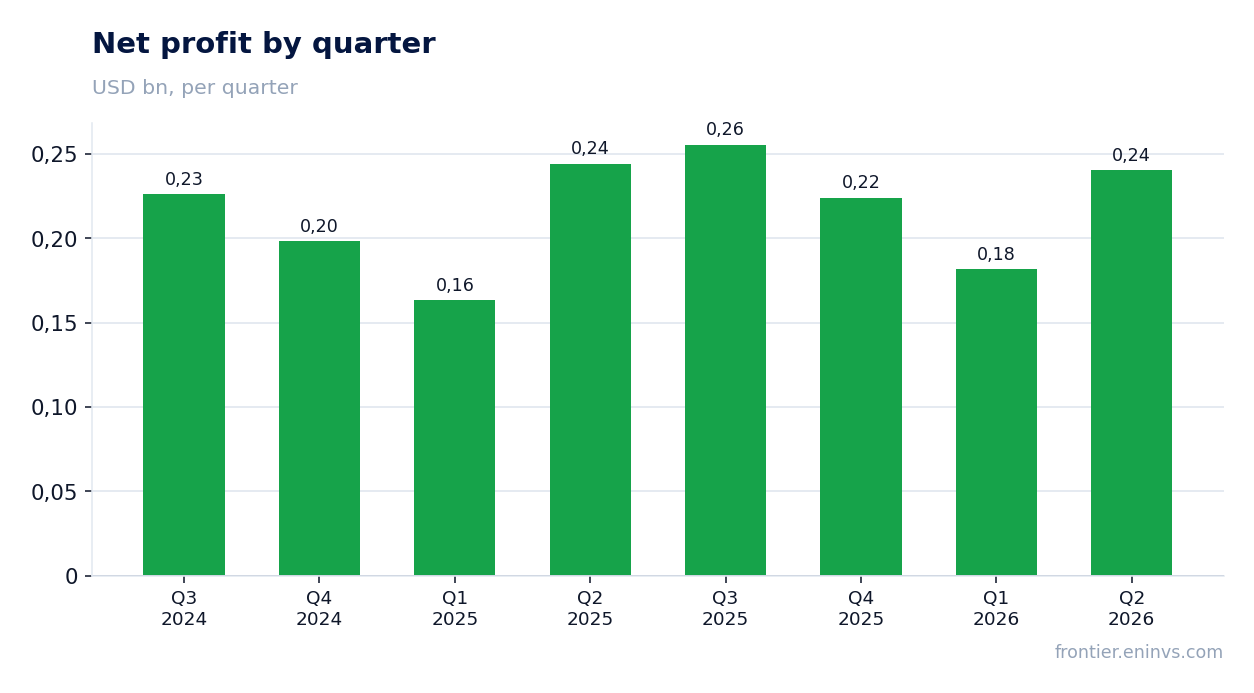
Net profit in Q2 2026 was $240.4 million, down 1.6% from $244.2 million a year earlier. Operating profit rose 4% to $348.6 million, but the bottom line was hurt by a sharp increase in interest expense, which jumped from $14.5 million to $39.1 million, a consequence of financing the NSI acquisition.
Additionally, the report reflects transaction and integration costs of $28.0 million (versus $0.7 million a year ago) and amortization of acquired intangibles of $39.1 million. Adjusted net profit rose 11% to $293.7 million, and adjusted EPS was $5.52, up 12% YoY.
For the first half, net profit rose 4% to $422.2 million, but this is also below revenue growth due to the same factors.
EBITDA margin contracted from 25.9% to 24.0% under inflation and tariff pressure
In Q2 2026, EBITDA rose 6.7% to $416.2 million, but slower than revenue, so EBITDA margin fell from 25.9% to 24.0%. Similarly, net margin dropped from 16.5% to 14.0%. The company cites pressure from cost inflation, raw material prices, and tariffs, only partially offset by price increases and productivity.
GAAP operating margin contracted 230 bps to 20.4%, and adjusted operating margin fell 50 bps to 23.9%. In the Electrical Solutions segment, the decline was particularly sharp: GAAP operating margin fell from 21.5% to 16.7% due to restructuring and NSI integration costs.
For the trailing twelve months, EBITDA was $1,332.1 million on revenue of $6,200.0 million, implying a margin of about 21.5% — below the reported quarter's level.
Debt rose to $5.2bn after NSI acquisition, but Net Debt/EBITDA stayed at 1.5
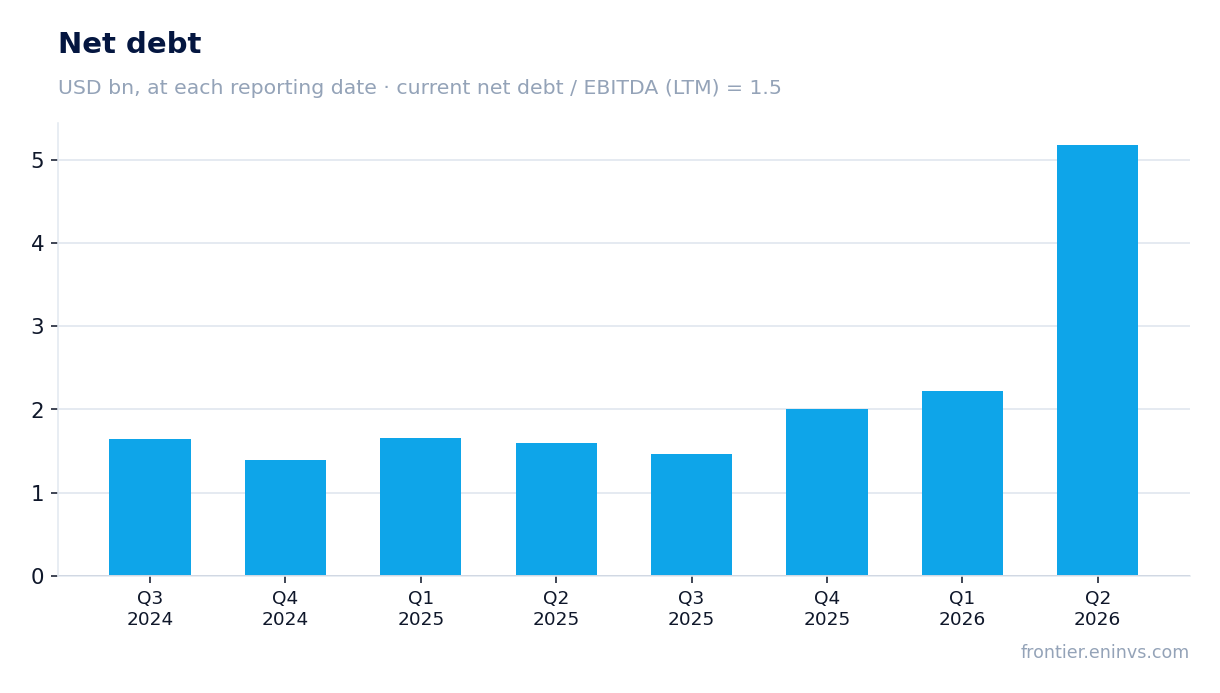
On the balance sheet as of June 30, 2026, total debt was $5,372.6 million versus $2,325.4 million at the end of 2025. The increase is due to financing the NSI Industries acquisition: the company raised a new unsecured term loan of $900 million, issued $1.9 billion of senior notes, and used commercial paper.
Net debt (less cash and investments) reached $4,874.2 million, up about $3.0 billion over the quarter. Net Debt/EBITDA for the trailing twelve months was 1.5 — this is a level, not a direction, as the earlier value is not provided in the report.
Operating cash flow in Q2 was $250.0 million, slightly below last year's $260.6 million. Free cash flow (OCF minus capex) was $213 million versus $221 million a year ago. Interest expense more than doubled, which will pressure earnings in coming quarters.
Dividend yield of 1.25% is below historical, and payouts may suffer from debt load
Over the trailing twelve months, HUBBELL INC paid dividends totaling about $150 million (based on half-year data), corresponding to a yield of 1.25% at the current price. This is a modest level for an industrial company, especially given the high debt load after the NSI acquisition.
The company maintains its dividend policy, but the priority now is debt service and integration of the acquired business. If free cash flow remains at $213 million per quarter, payouts are well covered, but higher interest expense and potential additional integration costs may limit the ability to increase dividends.
We estimate that, with current profitability maintained, the dividend for 2026 could be around $2.8 per share (assuming a payout of about 30% of adjusted earnings), implying a yield of about 0.6% — below the current. However, this is only our estimate and depends on the board's decision.
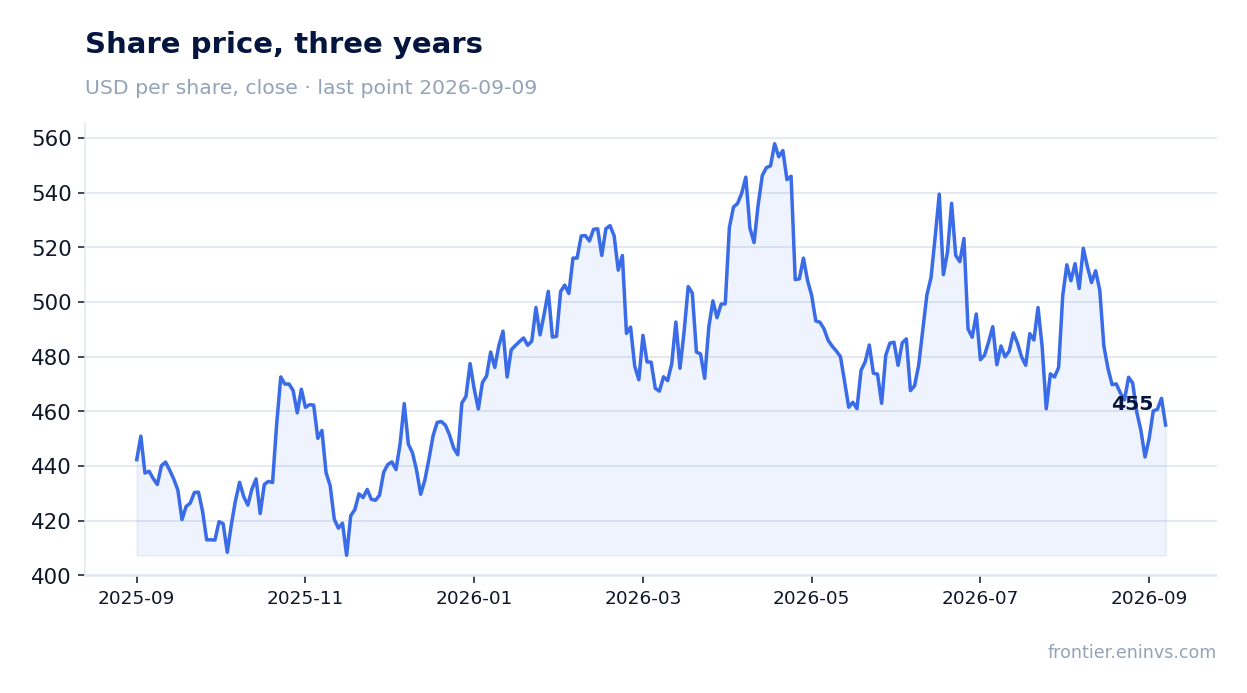
Shares trade at a premium to own history: EV/EBITDA 19.7 vs 18.6 3-year average
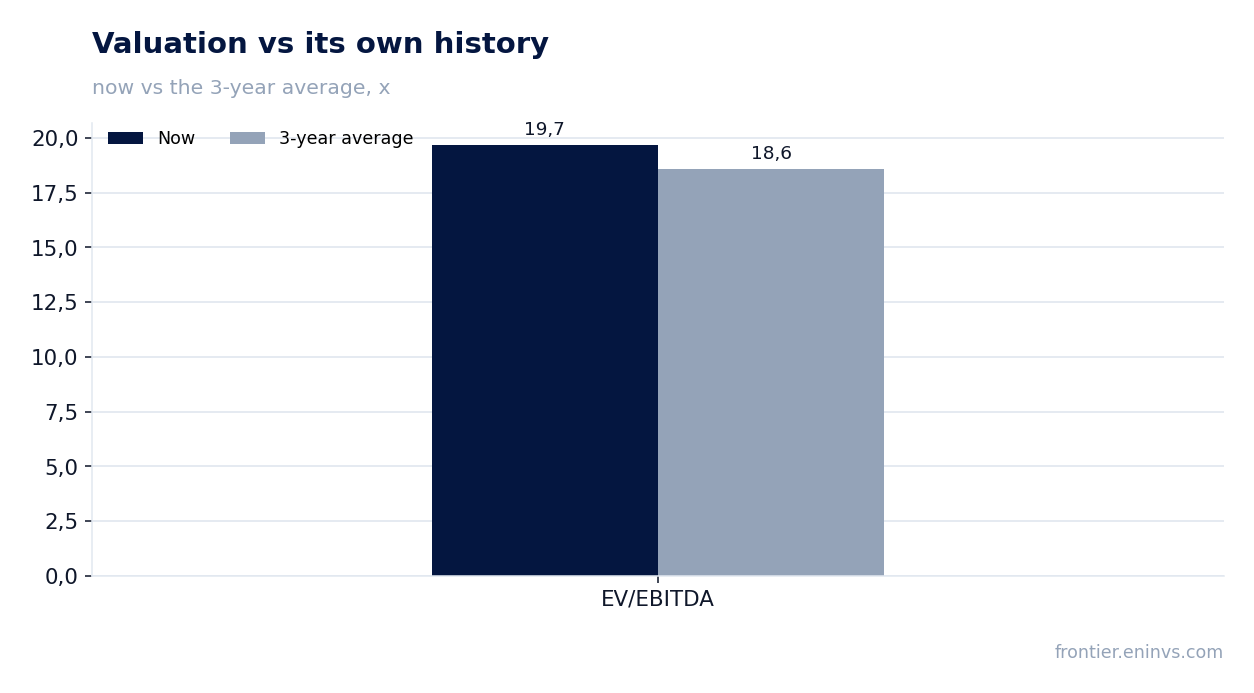
The current EV/EBITDA multiple for the trailing twelve months is 19.7, above the three-year average of 18.6. P/E LTM is 26.9 — this also suggests the market is pricing in continued high growth.
The company's market capitalization is $24,228.9 million. With EBITDA of $1,332.1 million over the last twelve months and net debt of $4,874.2 million (per the latest balance sheet), the enterprise is valued at $29,103 million (EV). The premium to its own history looks justified only if organic growth remains double-digit and margins recover.
Since the report, shares have lost 8.6%, partially reducing the overvaluation, but multiples are still above average.
Portal model values fair price 7% below current
According to the portal's model, based on EBITDA growth and a target multiple, the upside of the share to its fair value is minus 7%. This means the current price is somewhat above the valuation our model gives.
The model accounts for EBITDA over the last twelve months rising to $1,332.1 million, but the target multiple is likely below the current one due to elevated debt and uncertainty around NSI integration. If the company shows margin recovery and debt reduction, the valuation could improve.
It is important to emphasize that this is not a market consensus or a target price, but an internal portal estimate.
Valuation on the latest reported figures
| Metric | Value |
|---|---|
| Market cap | 24.2 bn USD |
| P/E (LTM) | 26.9 |
| EV/EBITDA (LTM) | 19.7 |
| P/B | 6.30 |
| Net debt / EBITDA (LTM) | 1.50 |
| Operating cash flow (LTM) | 1.00 bn |
| ROE | 25.0% |
| Dividend yield (12m) | 1.2% |
| EV/EBITDA, 3-year average | 18.6 |
Bottom line
The report showed strong organic growth of 10% in Q2, confirming robust demand in the electrical sector. However, net profit declined, margins contracted, and debt rose to $5.2 billion due to the NSI acquisition. Shares trade at a premium to their own history, and the portal model gives negative upside. Verdict: rather unattractive — until the company shows margin recovery and debt reduction, the current price looks stretched.
Open the company's financial profile HUBB →
See also: market overview · valuation map · stock screeners