ICHOR HOLDINGS, LTD. returned to profit, but cash went into inventory and receivables, not the till
On August 3, ICHOR HOLDINGS, LTD. released its second-quarter 2026 results. Revenue rose 22.7% year on year to $294.8 million, EBITDA jumped 355.7% to $14.4 million, and net income turned positive for the first time in three years at $1.0 million. Yet operating cash flow stayed negative at -$15.9 million and free cash flow at -$23.6 million. In our view the share looks neutral: the profit turnaround is real, but cash flow and a valuation of 222.6x LTM EBITDA leave no margin of safety.
Key takeaways
— Revenue rose 22.7% year on year to $294.8 million, the best quarterly result in three years
— EBITDA margin rose to 4.9% from 1.3% a year earlier, but remains far from levels that would justify the current valuation
— Net income of $1.0 million was the first positive in three years, but $12.2 million non-GAAP profit relies on one-off adjustments
— Operating cash flow remained negative at -$15.9 million, and free cash flow at -$23.6 million
— Leverage at 6.8x LTM EBITDA remains high despite raising $195.4 million from an equity offering
— A valuation of 222.6x LTM EBITDA and 6.8x debt leaves no room for error, even with third-quarter guidance
— Third-quarter guidance implies revenue of $315–345 million and non-GAAP EPS of $0.40–0.50, confirming accelerating growth
Attractiveness
Key figures, USD bn
| Metric | Q2 2025 | Q2 2026 | Change |
|---|---|---|---|
| Revenue | 0.24 | 0.29 | +22.7% |
| EBITDA | 0.00 | 0.01 | +355.7% |
| Operating profit | -0.00 | 0.01 | to profit |
| Net profit | -0.01 | 0.00 | to profit |
| Operating cash flow | -0.01 | -0.02 | — |
| Capex | 0.01 | 0.01 | +7.0% |
| EBITDA margin | 1.3% | 4.9% | +3.6 pp |
| Net margin | -3.9% | 0.3% | +4.2 pp |
Revenue rose 22.7% year on year to $294.8 million, the best quarterly result in three years
In the second quarter of 2026, ICHOR HOLDINGS, LTD.'s revenue reached $294.8 million, up 22.7% year on year. This is the highest quarterly figure in three years and a marked reversal from the 4.2% decline in the fourth quarter of 2025. Sequential growth from the first quarter of 2026 was 15%.
The acceleration coincided with an improving environment in the semiconductor equipment segment. The company notes that customer order visibility now extends into 2027, and third-quarter guidance implies further sequential revenue growth to $315–345 million. This suggests the current quarter could be another record.
For an investor, the sustainability of growth matters more than the fact of it. The company announced a strategy to strengthen its operating model three quarters ago, and these results are the first confirmation that it is working. However, the comparison base remains low: revenue was falling a year ago, so such a high percentage growth is partly explained by the low-base effect.
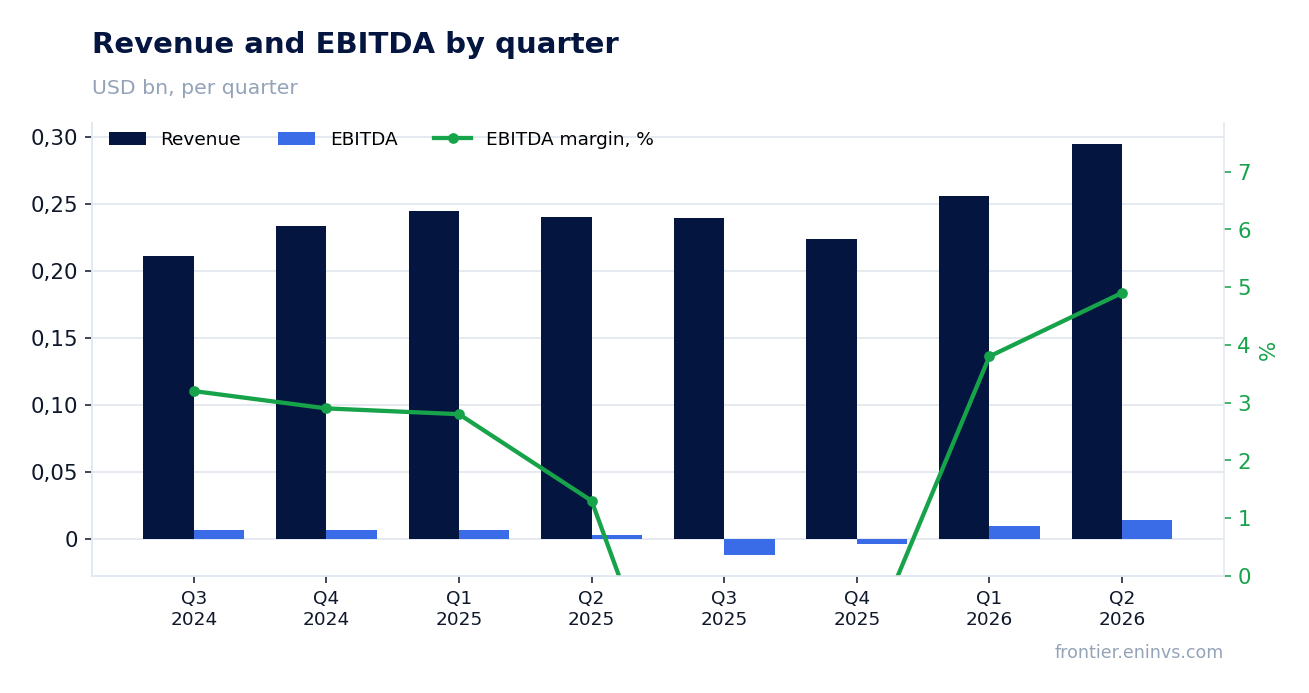
EBITDA margin rose to 4.9% from 1.3% a year earlier, but remains far from levels that would justify the current valuation
EBITDA in the second quarter of 2026 was $14.4 million, with a margin of 4.9%. A year earlier, EBITDA was $3.2 million and the margin 1.3%. This margin expansion is the result not only of higher revenue but also of a lower share of fixed costs. GAAP gross margin rose to 13.9% from 11.3%, and non-GAAP gross margin to 14.1% from 11.8%.
The company attributes the gross margin improvement to operational enhancements and higher capacity utilisation. Operating expenses grew moderately: research and development to $7.8 million from $5.7 million, while selling, general and administrative expenses fell to $24.1 million from $24.3 million. Lower SG&A against rising revenue provided additional leverage.
Nevertheless, a 4.9% margin remains low for a company with a market capitalisation of nearly $2 billion. Even with third-quarter guidance implying non-GAAP EPS of $0.40–0.50, profitability remains far from historical peaks. This is a key constraint for a re-rating of the stock.
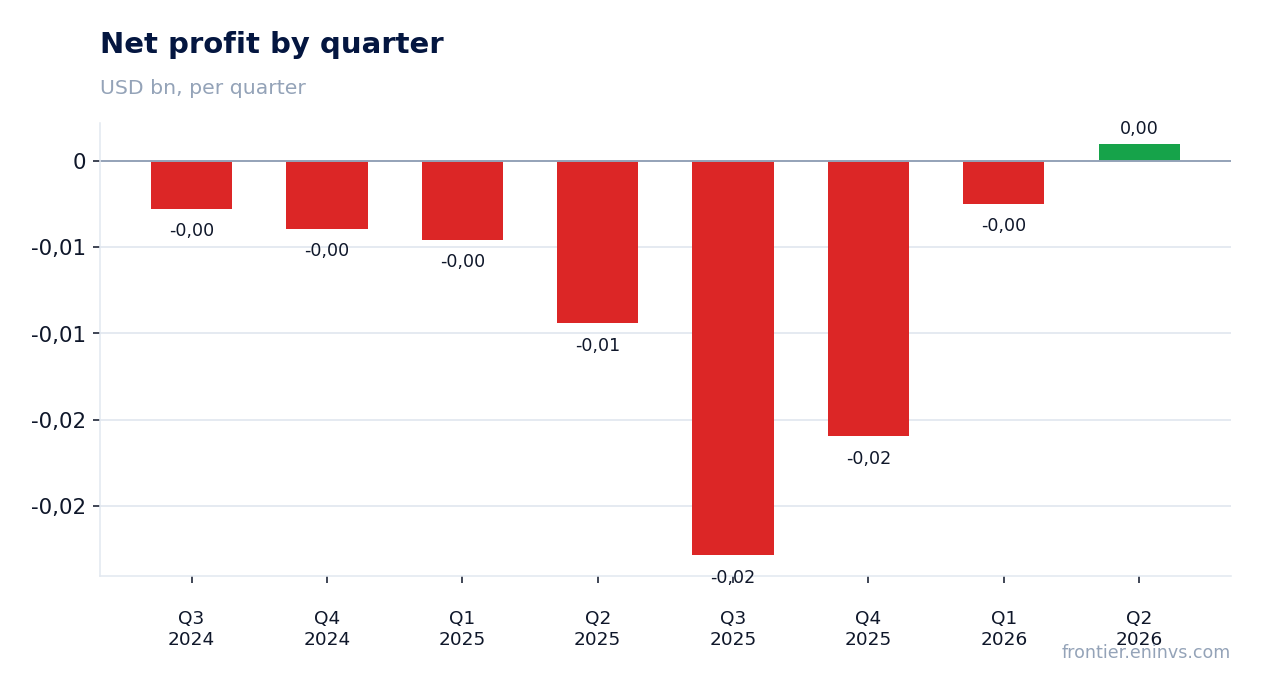
Net income of $1.0 million was the first positive in three years, but $12.2 million non-GAAP profit relies on one-off adjustments
GAAP net income in the second quarter of 2026 was $1.0 million, or $0.03 per share. This is the first positive quarterly result in three years. A year earlier, the loss was $9.4 million, and in the first quarter of 2026 it was $2.5 million. The turnaround came from higher revenue and improved gross margin.
However, non-GAAP net income reached $12.2 million, or $0.34 per share. The $11.2 million difference is explained by adjustments: share-based compensation of $4.5 million, amortisation of intangibles of $1.9 million, restructuring costs of $2.7 million, and tax effects. These items are non-cash or one-off, but excluding them paints a more attractive profitability picture.
For an investor, it is important that sustainable profitability is not yet confirmed. The company still relies on one-off adjustments to show meaningful profit. Excluding them, profit remains symbolic. This limits the stock's upside potential, even despite strong guidance.
Operating cash flow remained negative at -$15.9 million, and free cash flow at -$23.6 million
In the second quarter of 2026, operating cash flow was negative at -$15.9 million. This is worse than a year earlier, when the outflow was $7.5 million. The main reason was working capital growth: inventories rose by $38.4 million, accounts receivable by $11.6 million, partially offset by a $15.7 million increase in accounts payable.
Free cash flow, after capital expenditures of $7.8 million, was -$23.6 million. This means the company is not yet generating cash despite profit growth. The negative cash flow was financed by raising $195.4 million from an equity offering, which increased the cash cushion to $256.5 million.
The build-up in inventories and receivables may signal preparation for expected demand growth in the third quarter. However, if revenue does not accelerate, this could backfire – tying up funds and pressuring liquidity. Investors should monitor working capital dynamics in the next report.
Leverage at 6.8x LTM EBITDA remains high despite raising $195.4 million from an equity offering
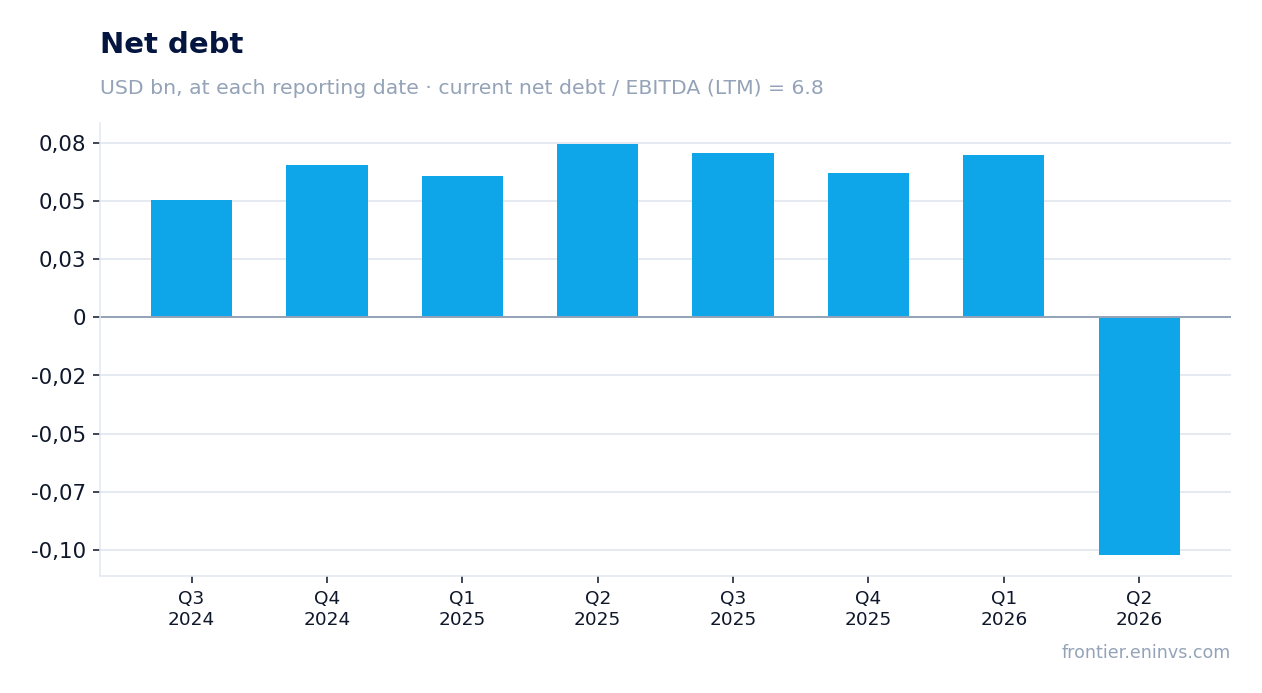
Net debt at the end of the second quarter of 2026 was $61.9 million, and the ratio of net debt to LTM EBITDA was 6.8x. This is a high level, reflecting both significant debt and a low LTM EBITDA base. For comparison, the company's market capitalisation is $1.96 billion, and EV/LTM EBITDA is 222.6x.
The company raised $195.4 million from an offering of 2.5 million shares at an average price of $80.70. This significantly strengthened the balance sheet: cash rose to $256.5 million, and net debt decreased. However, the 6.8x ratio still indicates elevated risk, especially if EBITDA growth slows.
Interest expense for the quarter was $1.5 million, comparable to net income. This means that even a small decline in operating profit could lead to a loss again. The balance sheet improvement buys time but does not fully solve the high leverage problem.
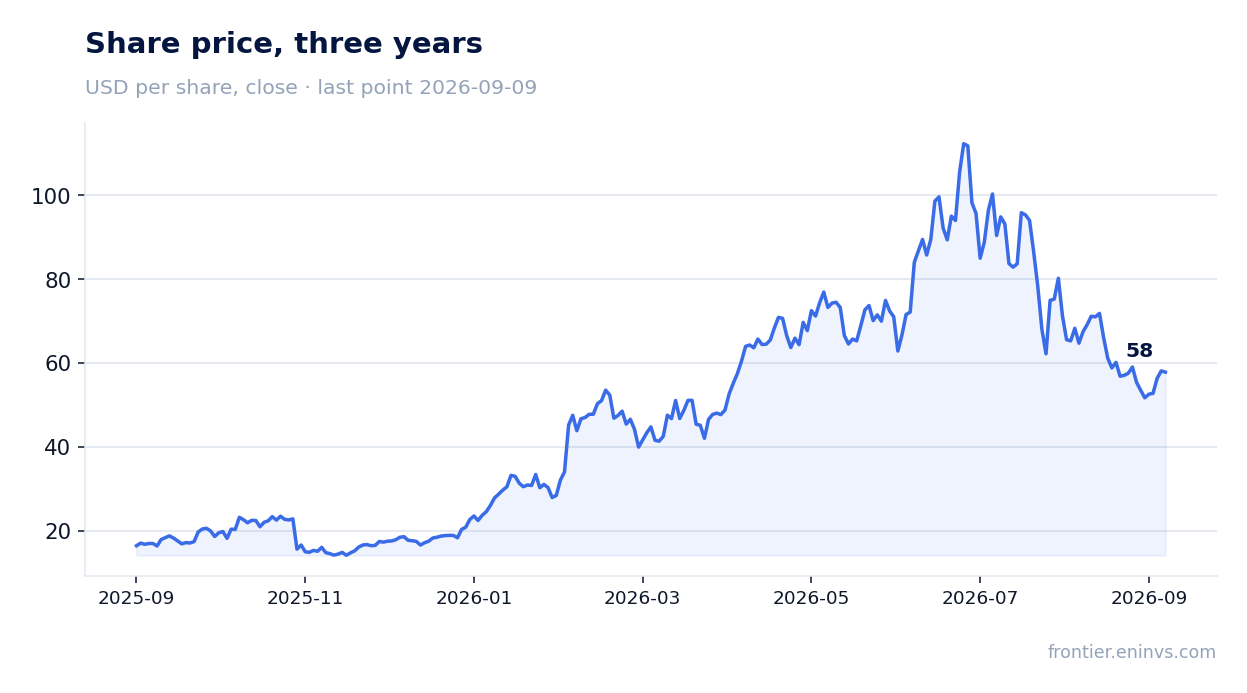
A valuation of 222.6x LTM EBITDA and 6.8x debt leaves no room for error, even with third-quarter guidance
EV/LTM EBITDA is 222.6x – an extremely high level, reflecting both the low LTM EBITDA base and market optimism about future growth. Market capitalisation is $1.96 billion, and net debt is $61.9 million. Even with third-quarter guidance of $315–345 million in revenue and non-GAAP EPS of $0.40–0.50, the current valuation implies very rapid profit growth ahead.
According to the portal's model, the fair value of the share implies only 6% upside from the current price. This means the market has already priced in significant financial improvement. For the stock to rise further, the company must not just meet guidance but exceed it.
Comparison with its own history is difficult, as the FACTS do not provide a three-year average multiple. However, a level of 222.6x looks extreme even for a highly cyclical company. Investors should understand that the current valuation leaves no margin of safety.
Third-quarter guidance implies revenue of $315–345 million and non-GAAP EPS of $0.40–0.50, confirming accelerating growth
The company provided third-quarter 2026 guidance: revenue of $315–345 million, GAAP EPS of $0.25–0.35, and non-GAAP EPS of $0.40–0.50. The midpoint revenue of $330 million is 12% above the second-quarter result. This confirms expectations of further sequential growth.
The non-GAAP EPS guidance implies significant profitability improvement. If the company hits the midpoint of $0.45, that would be more than double the second-quarter level of $0.34. Such guidance supports optimism about operating leverage.
However, it should be noted that the guidance excludes certain one-off items such as amortisation of intangibles and share-based compensation. Additionally, the company notes that second-half growth will be significantly higher than expected a quarter ago. This creates a risk that guidance could prove conservative, but also a risk that market expectations are already inflated.
Valuation on the latest reported figures
| Metric | Value |
|---|---|
| Market cap | 1.96 bn USD |
| EV/EBITDA (LTM) | 222.6 |
| P/B | 2.95 |
| Net debt / EBITDA (LTM) | 6.80 |
| Operating cash flow (LTM) | 0.03 bn |
| ROE | 0.5% |
Bottom line
In the second quarter of 2026, ICHOR HOLDINGS, LTD. showed a strong turnaround: revenue rose 22.7%, EBITDA margin reached 4.9%, and net income turned positive for the first time in three years. However, behind this facade are weak cash flow (-$15.9 million operating and -$23.6 million free), high leverage (6.8x LTM EBITDA), and a valuation that already prices in significant growth. Third-quarter guidance confirms acceleration, but the market expects more. In our view, the share looks neutral: the portal model's upside is only 6%, and risks related to cash flow and debt limit its attractiveness.
Open the company's financial profile ICHR →
See also: market overview · valuation map · stock screeners