US_MAA: revenue almost flat, net debt up 5.3 bn over the year — despite stable cash flow

On July 29, 2026, US_MAA reported Q2 2026 results. Revenue grew 1.0% YoY to 555.1 million, EBITDA rose 11.7% to 303.5 million, and net profit increased 11.8% to 120.8 million. However, net debt increased by 5.3 billion over the year, making the stock rather attractive but with caveats.
Key takeaways
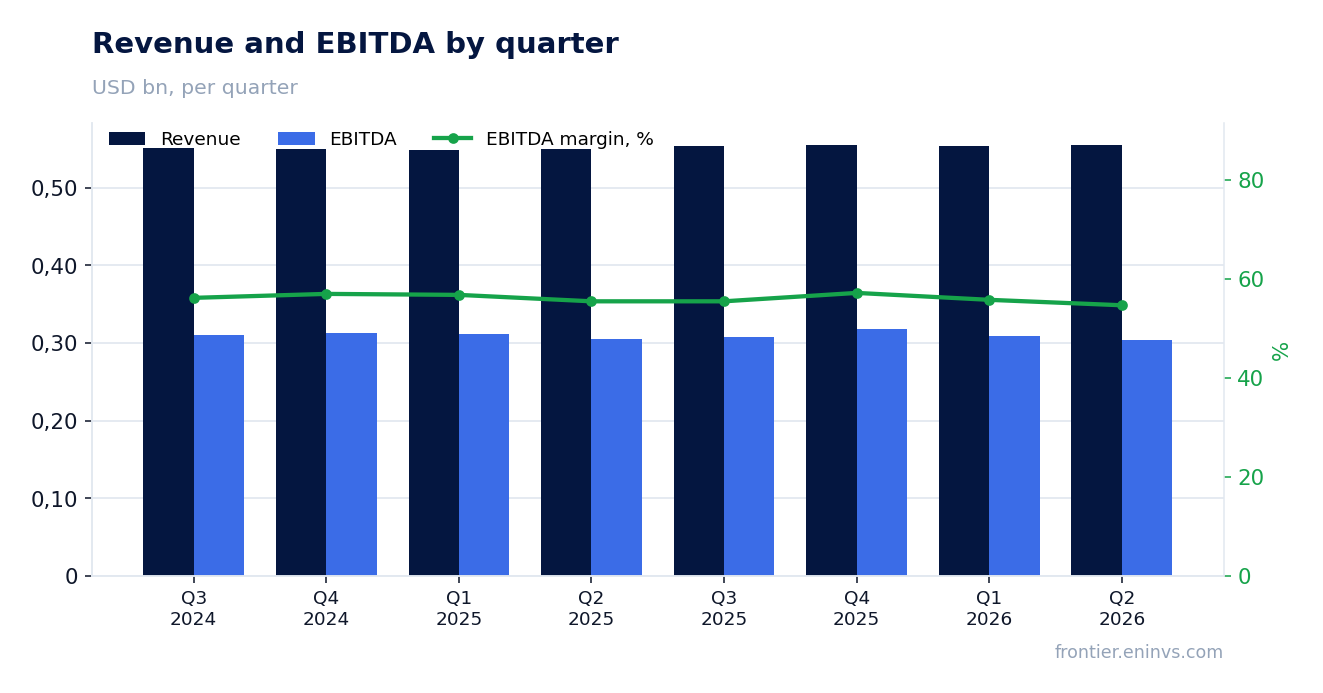
— Revenue barely grows: +1.0% YoY in Q2, to 555.1 million
— EBITDA margin expanded to 61.4% from 55.5% a year ago — driven by lower operating expenses
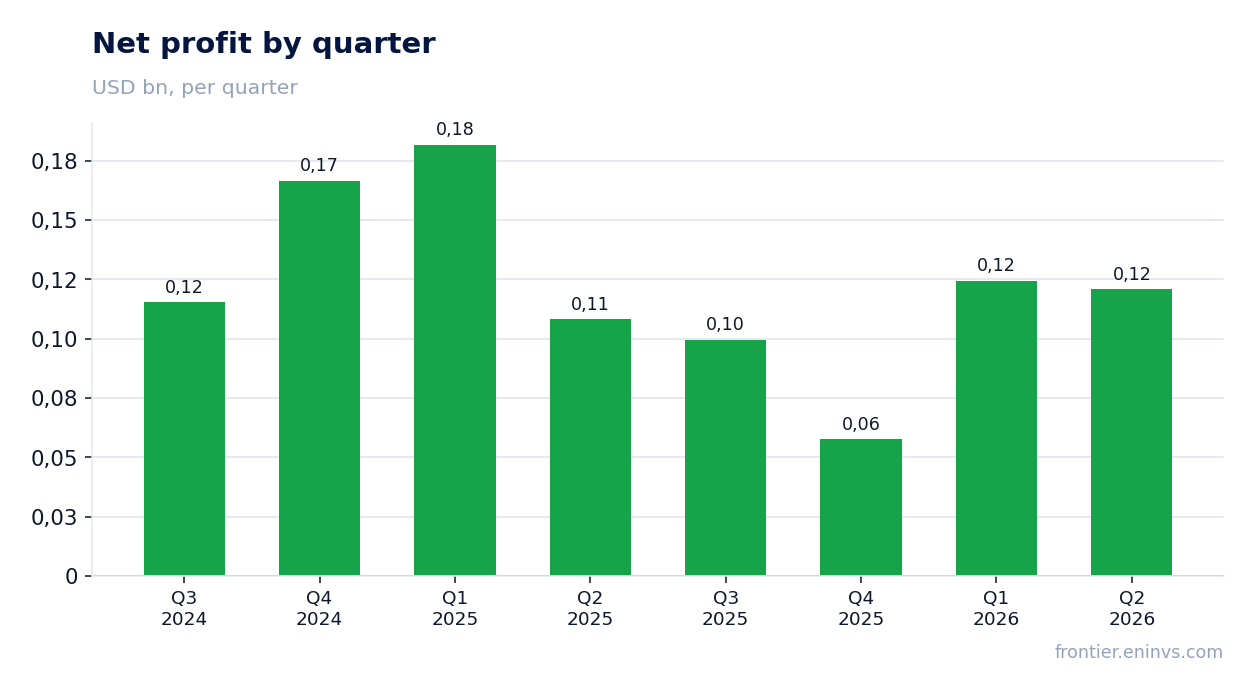
— Net profit +11.8% YoY, but largely due to one-off items
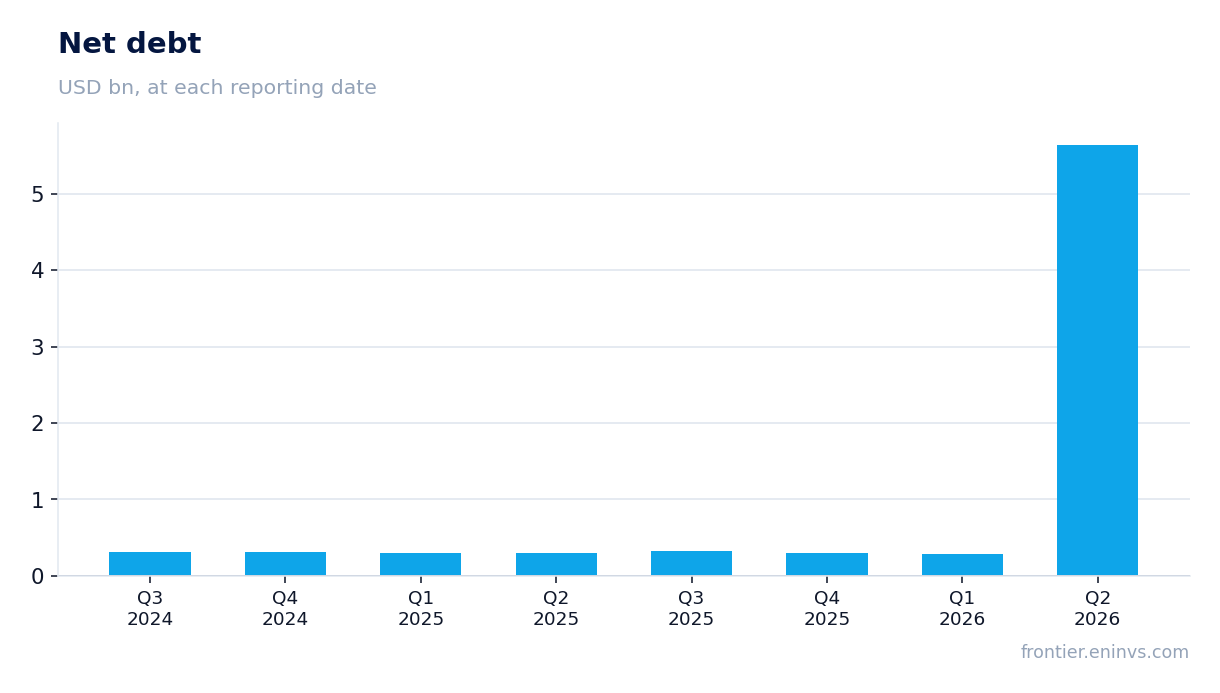
— Net debt increased by 5.3 billion over the year, to 5,640.1 million — despite stable operating cash flow
— Operating cash flow for the quarter was 332.9 million, but capex rose to 109.0 million
— Dividends are stable, but cash flow after investments barely covers them
Attractiveness
Key figures, USD bn
| Metric | Q2 2025 | Q2 2026 | Change |
|---|---|---|---|
| Revenue | 0.55 | 0.56 | +1.0% |
| EBITDA | 0.31 | 0.34 | +11.7% |
| Operating profit | 0.15 | 0.14 | -7.0% |
| Net profit | 0.11 | 0.12 | +11.8% |
| Operating cash flow | 0.35 | 0.33 | -5.8% |
| Capex | 0.00 | 0.11 | — |
| EBITDA margin | 55.5% | 61.4% | +5.9 pp |
| Net margin | 19.7% | 21.8% | +2.1 pp |
Revenue barely grows: +1.0% YoY in Q2, to 555.1 million
In Q2 2026, US_MAA's revenue reached 555.1 million USD, up 1.0% YoY. Growth slowed compared to previous quarters: in Q1 2026 it was 0.8%, and in Q4 2025 it was 1.1%. Thus, the top-line dynamics remain in a narrow range of 0.6–1.1% over the last six quarters.
The main contribution comes from a stable portfolio: same-store revenue declined 0.3% YoY to 517.4 million, but growth was driven by new and lease-up properties. Average effective rent per unit across the portfolio fell 0.2% YoY to 1,688 USD per month, reflecting rental market pressure in several regions, especially Austin and Denver.
EBITDA margin expanded to 61.4% from 55.5% a year ago — driven by lower operating expenses
EBITDA in Q2 2026 grew 11.7% YoY to 303.5 million, while revenue increased only 1.0%. As a result, EBITDA margin expanded from 55.5% to 61.4%. The main driver was lower operating expenses: same-store expenses rose only 0.8% YoY, with insurance costs down 8.0% and repairs down 0.5%.
Operating profit, in contrast, declined 7.0% YoY to 140.8 million, due to higher depreciation and other items. Nevertheless, the EBITDA margin expansion reflects improved operational efficiency, particularly in managing personnel and utility costs.
Net profit +11.8% YoY, but largely due to one-off items
Net profit in Q2 2026 was 120.8 million USD, up 11.8% YoY. However, operating profit declined 7.0%, so the net profit growth was driven not by core operations but likely by one-off items, such as gains from asset sales or revaluation. The report mentions two community dispositions in 2026 (316 and 194 units), which could have generated one-time income.
Net margin rose to 21.8% from 19.7% a year ago, but this increase is not supported by operational dynamics. Excluding one-offs, profit would likely have declined, which is important when assessing the sustainability of results.
Net debt increased by 5.3 billion over the year, to 5,640.1 million — despite stable operating cash flow
At the end of Q2 2026, US_MAA's net debt stood at 5,640.1 million USD, up 5.3 billion from a year ago (305.8 million at the end of Q2 2025). The sharp increase was mainly due to raising funds to finance the investment program: over the last 12 months, capex totaled about 270 million, and land parcels and development properties were also acquired.
Operating cash flow for the trailing twelve months was 1,100.0 million, providing comfortable coverage of interest expenses: the average effective interest rate is 3.9%, and covenants are met with a large margin (total debt to adjusted total assets — 31.2% vs. 60% limit). Nevertheless, rising debt amid stagnant revenue increases financial leverage.
Operating cash flow for the quarter was 332.9 million, but capex rose to 109.0 million
In Q2 2026, operating cash flow was 332.9 million USD, significantly above the average of previous quarters (e.g., 149.6 million in Q1 2026). Capex in the reported quarter rose to 109.0 million, related to development properties and renovation programs.
Free cash flow after capex was about 223.9 million for the quarter, covering dividend payments (approximately 1.53 USD per share per quarter, or about 182 million with 119 million shares). However, over the last 12 months, free cash flow was lower, given the volatility of operating cash flow and high capex in some quarters.
Dividends are stable, but cash flow after investments barely covers them
US_MAA maintains dividends at 1.53 USD per share per quarter, corresponding to an annual dividend of about 6.12 USD. Over the last 12 months, operating cash flow was 1,100.0 million, and capex was about 270 million, resulting in free cash flow of approximately 830 million. This is sufficient to cover dividends (about 730 million with 119 million shares), but after accounting for development investments and acquisitions, the free flow shrinks.
The company allocates significant funds to development: expected investment volume in 2026 is 300–400 million, plus acquisitions of 150–250 million. This means that after paying dividends and financing investments, free cash flow may turn negative, explaining the debt increase.
Valuation on the latest reported figures
| Metric | Value |
|---|---|
| Operating cash flow (LTM) | 1.10 bn |
| ROE | 8.8% |
Bottom line
In Q2 2026, US_MAA showed EBITDA margin expansion to 61.4% and stable operating cash flow, but revenue is barely growing and operating profit is declining. Net profit rose due to one-off items that are unlikely to repeat. The key question for holders is whether the company can generate sufficient free cash flow to cover dividends and investments without further debt growth. At the current valuation, the stock looks rather attractive, but only if the investment program starts to drive revenue growth in the coming quarters.
Open the company's financial profile MAA →
See also: market overview · valuation map · stock screeners