Magnolia Oil & Gas: profit more than doubled, but the gain came from oil prices, not volumes

On 5 August Magnolia Oil & Gas Corporation reported second-quarter 2026 results. Revenue rose 50.1% year on year to USD 478.8 million, EBITDA by 65.5% to 359.2 million, and net income by 132.7% to 181.8 million. The gain came mainly from prices: the average oil price rose from 62.20 to 98.13 dollars per barrel, while production added only 8%. With an EV/EBITDA of 5.12 against its own three-year average of 4.79 and the portal model pointing to downside versus fair value, the share looks rather unattractive.
Key takeaways
— Revenue rose 50.1% on oil prices, not volumes: production added only 8%
— EBITDA margin reached 74.3% because costs barely moved with the price
— Net income more than doubled, and 3.2 million of one-off deal costs did not spoil it
— Free cash flow for the quarter was 234.6 million on capex of 125.0 million
— Leverage of 0.15 EBITDA LTM is a level, not an improvement: no prior figure exists to compare
— The dividend was raised 9% to 0.18 per quarter, but the 2.37% yield is below the key rate
— EV/EBITDA of 5.12 against its own three-year average of 4.79 – the share is above its history
Attractiveness
Key figures, USD bn
| Metric | Q2 2025 | Q2 2026 | Change |
|---|---|---|---|
| Revenue | 0.32 | 0.48 | +50.1% |
| EBITDA | 0.21 | 0.36 | +65.5% |
| Operating profit | 0.11 | 0.24 | +125.1% |
| Net profit | 0.08 | 0.18 | +132.7% |
| Operating cash flow | 0.20 | 0.38 | +93.3% |
| Capex | 0.10 | 0.13 | +24.8% |
| EBITDA margin | 67.4% | 74.3% | +6.9 pp |
| Net margin | 24.5% | 38.0% | +13.5 pp |
Revenue rose 50.1% on oil prices, not volumes: production added only 8%
Second-quarter 2026 revenue was 478.8 million dollars against 319.0 million a year earlier – up 50.1%. The average oil price rose from 62.20 to 98.13 dollars per barrel, while production grew only 8% to 106.1 thousand barrels of oil equivalent per day. Almost the entire revenue gain came from price, not volume.
Oil revenue rose to 373.8 million from 226.3 million, while gas revenue actually fell to 39.7 million from 42.9 million. The gas price dropped from 2.55 to 2.18 dollars per thousand cubic feet. NGL revenue added to 65.4 million from 49.8 million.
Production in Giddings, the core asset, rose 10% year on year to 85.5 thousand barrels of oil equivalent per day and accounted for 81% of total volume. The company raised its full-year 2026 production growth guidance to 6% from 5%. That is moderate growth, and it does not explain the doubling of profit.
EBITDA margin reached 74.3% because costs barely moved with the price
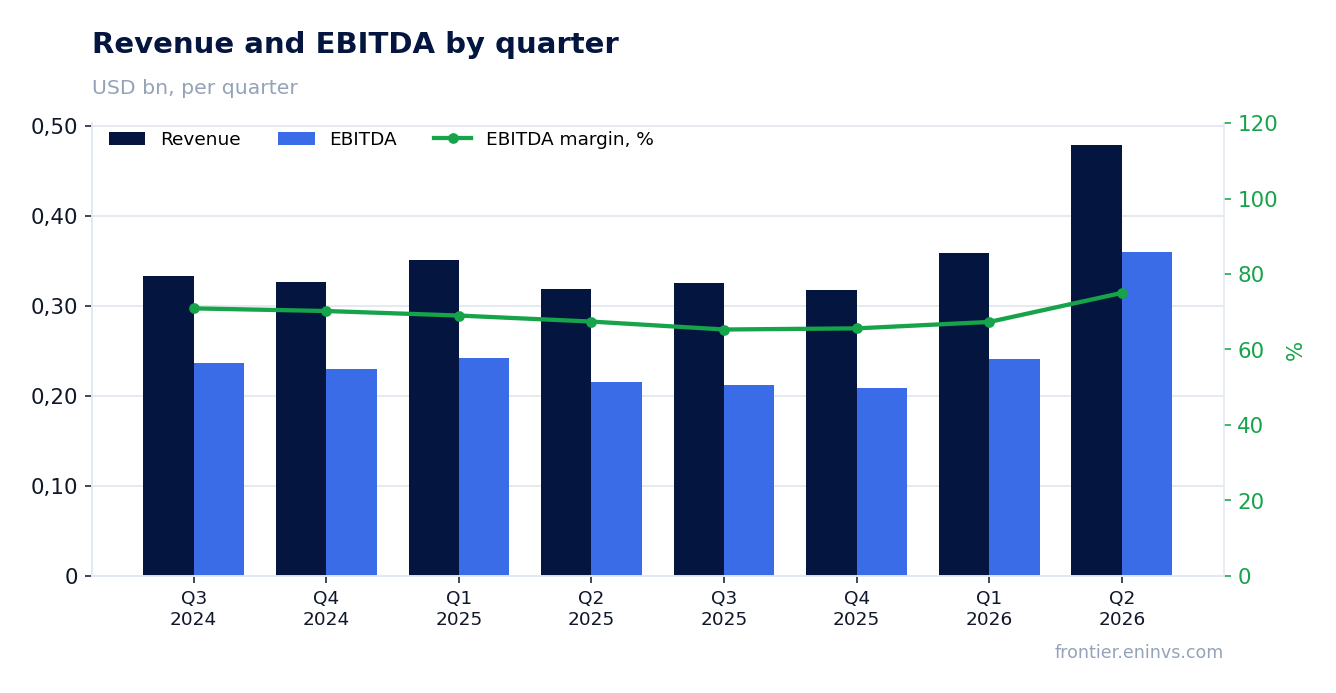
Second-quarter 2026 EBITDA was 359.2 million dollars, a 74.3% margin against 67.4% a year earlier. Revenue per barrel rose from 35.68 to 49.60 dollars, while total cash costs per barrel rose only from 10.70 to 11.55 dollars. That gap produced the margin gain.
Operating costs per barrel barely changed: lease operating expenses at 5.01 dollars against 4.88, gathering and processing at 1.78 against 1.84. Taxes other than income rose to 2.36 from 2.10. The main cost increase came from G&A – 2.14 per barrel against 1.94 – and from one-off deal costs of 0.33 per barrel.
Adjusted operating margin, excluding one-off costs, was 51% against 34% a year earlier. This reflects the strength of the price, not better cost control: per-barrel costs stayed roughly flat.
Net income more than doubled, and 3.2 million of one-off deal costs did not spoil it
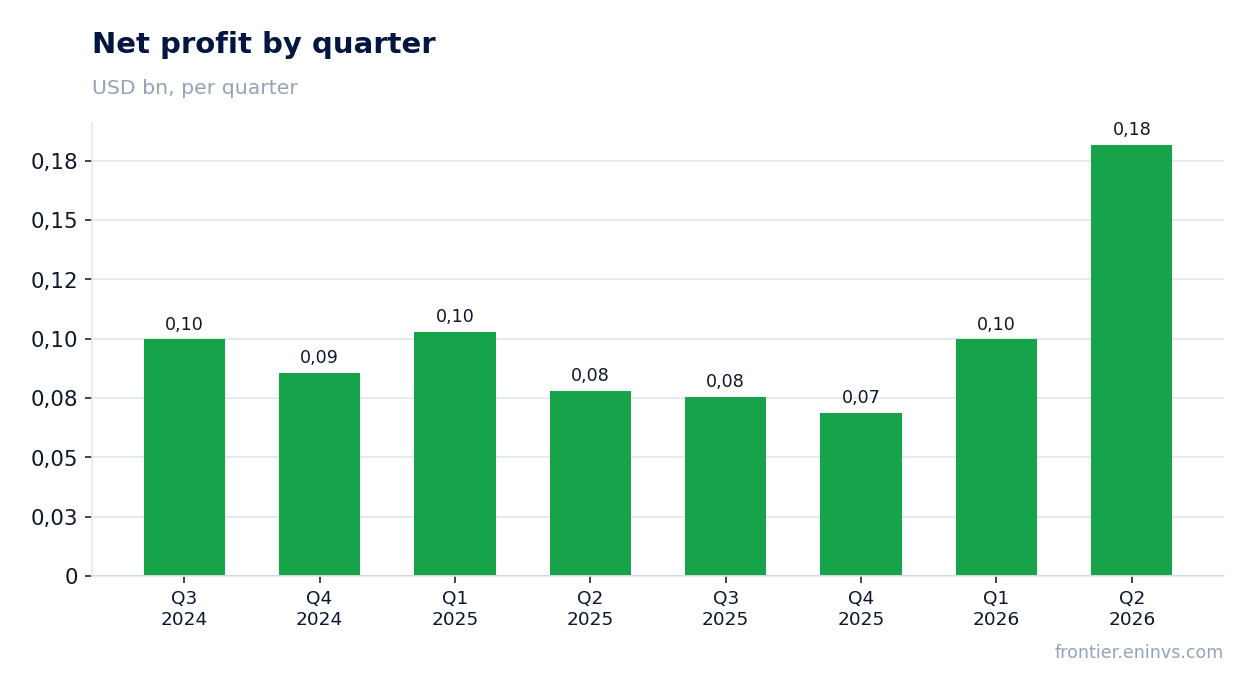
Second-quarter 2026 net income was 181.8 million dollars against 78.1 million a year earlier – up 132.7%. Diluted earnings per share were 0.97 against 0.41. Adjusted net income was 184.3 million, or 0.99 per share.
There are one-off items in the report: transaction costs for the WildFire Energy acquisition of 3.2 million dollars, absent a year earlier. Without them profit would have been higher by that amount. The prior-year quarter also included a one-off gain of 2.7 million from revaluation of contingent consideration.
The profit growth rests on the oil price and on a lower share count: diluted weighted average shares fell 4% to 184.6 million. The company repurchased 1.7 million shares for 49.3 million dollars during the quarter.
Free cash flow for the quarter was 234.6 million on capex of 125.0 million
Second-quarter 2026 operating cash flow was 384.0 million dollars against 198.7 million a year earlier. Free cash flow was 234.6 million against 107.5 million. Drilling and completion capex was 125.0 million, or 34% of adjusted EBITDAX.
The company returned 80.1 million dollars, or 34% of free cash flow, to shareholders through buybacks and dividends. At quarter-end it held 295.9 million in cash and an undrawn 450 million credit facility.
Third-quarter 2026 capex is planned at about 115 million, with the full-year guidance reiterated at 440–480 million. That means if prices hold, the reinvestment rate stays low and free cash flow significant.
Leverage of 0.15 EBITDA LTM is a level, not an improvement: no prior figure exists to compare
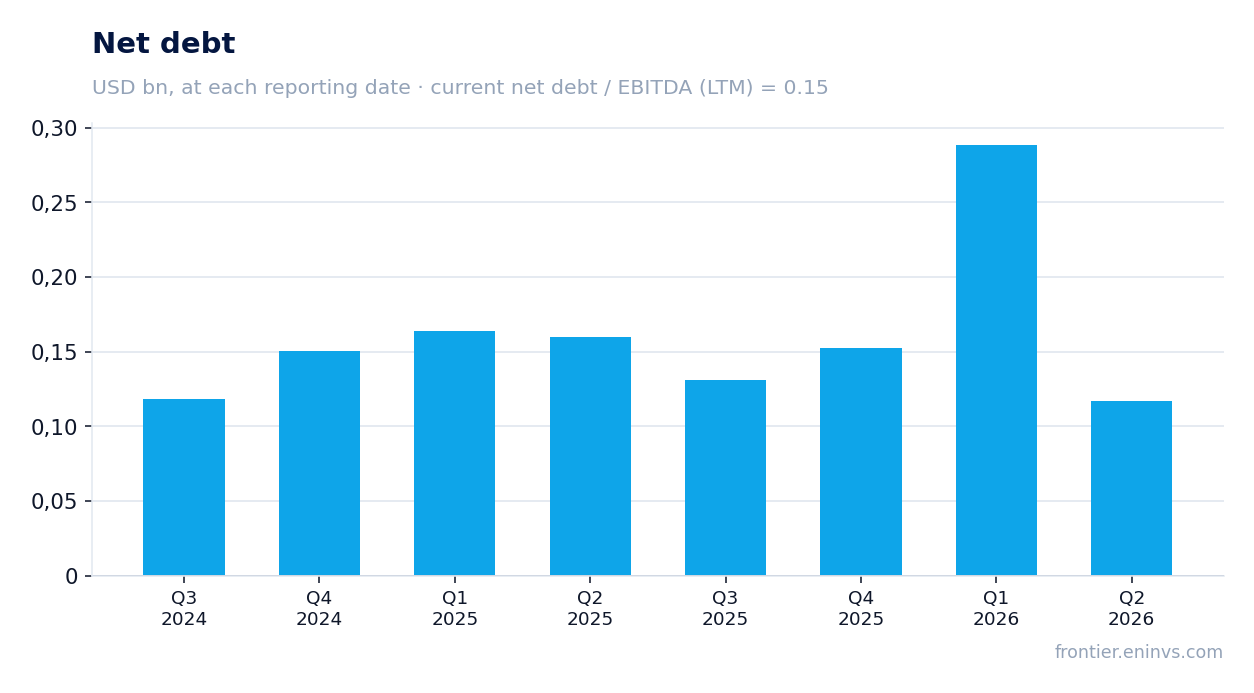
Net debt at the latest reporting date was 152.8 million dollars, with net debt to LTM EBITDA at 0.15. That is a very low level. It cannot be compared with a prior figure: none is in the facts, so claiming leverage fell or rose would be wrong.
Debt on the balance sheet is 393.6 million in long-term liabilities, with interest expense of 6.7 million for the quarter. Against quarterly EBITDA of 359.2 million, interest is covered many times over.
After the reporting date the company raised financing for the acquisition: it issued 53.3 million new shares for 1.23 billion dollars and placed 500 million dollars of senior notes at 6.625% due 2034. The WildFire Energy acquisition will be funded roughly half debt and half equity and is expected to close late in the third quarter of 2026. This will materially change the balance sheet but is not yet reflected in the second-quarter report.
The dividend was raised 9% to 0.18 per quarter, but the 2.37% yield is below the key rate
The board declared a quarterly dividend of 0.18 per share, payable on 1 September 2026. That is 9% above the previous rate, giving an annualised dividend of 0.72 per share. The increase was announced alongside the WildFire Energy acquisition.
The yield on the current price is 2.37% trailing twelve months. That is below the key rate and a moderate level for the company's history. The dividend is covered by profit and free cash flow: free cash flow for the quarter was 234.6 million, while dividends and buybacks took 80.1 million.
Our estimate: with current oil prices and production volumes, the annual dividend of 0.72 remains sustainable. The risk to the payout is a fall in oil prices or a rise in debt after the acquisition closes, if it is funded with more debt than expected. The company has already issued 500 million of notes at 6.625%, which will increase interest expense.
EV/EBITDA of 5.12 against its own three-year average of 4.79 – the share is above its history
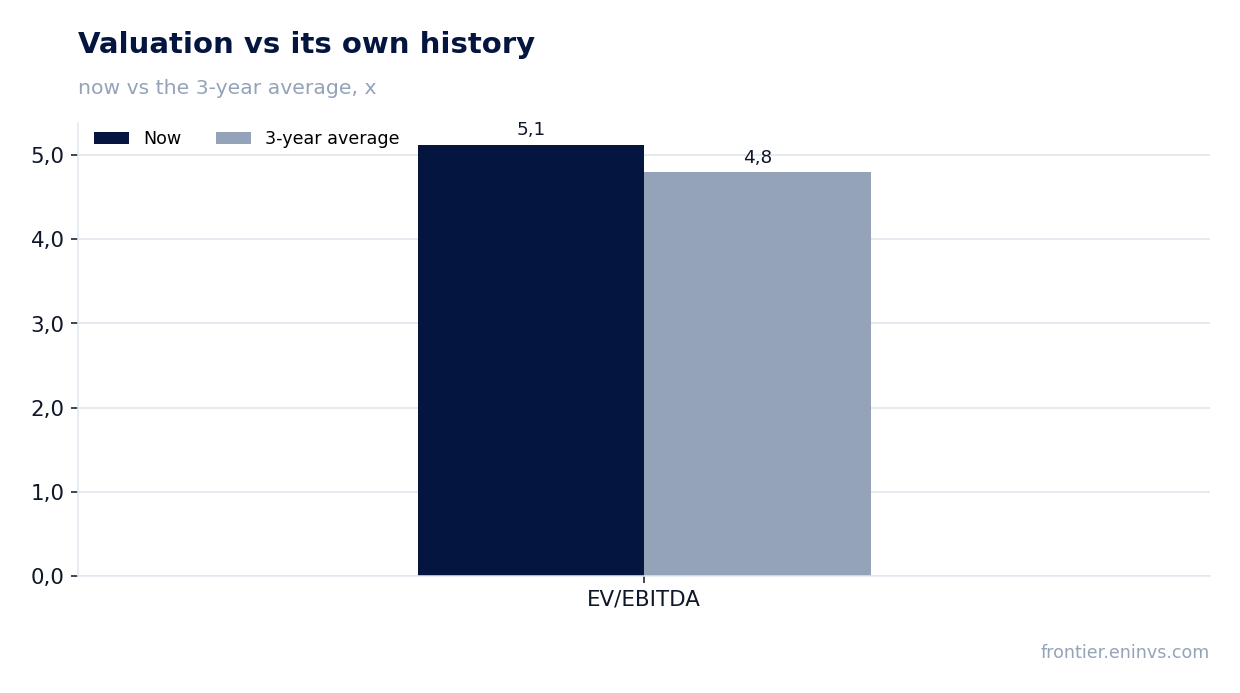
The current EV/EBITDA is 5.12 against its own three-year average of 4.79. The share trades above its history on this multiple. The LTM P/E is 12.0, which also does not look cheap for a company with per-share production growth that is modest.
Market capitalisation is 5.11 billion dollars. On the portal's model, repricing EBITDA to current commodity prices at the target EV/EBITDA implies downside to fair value of 55%. This is our own estimate, not a market consensus.
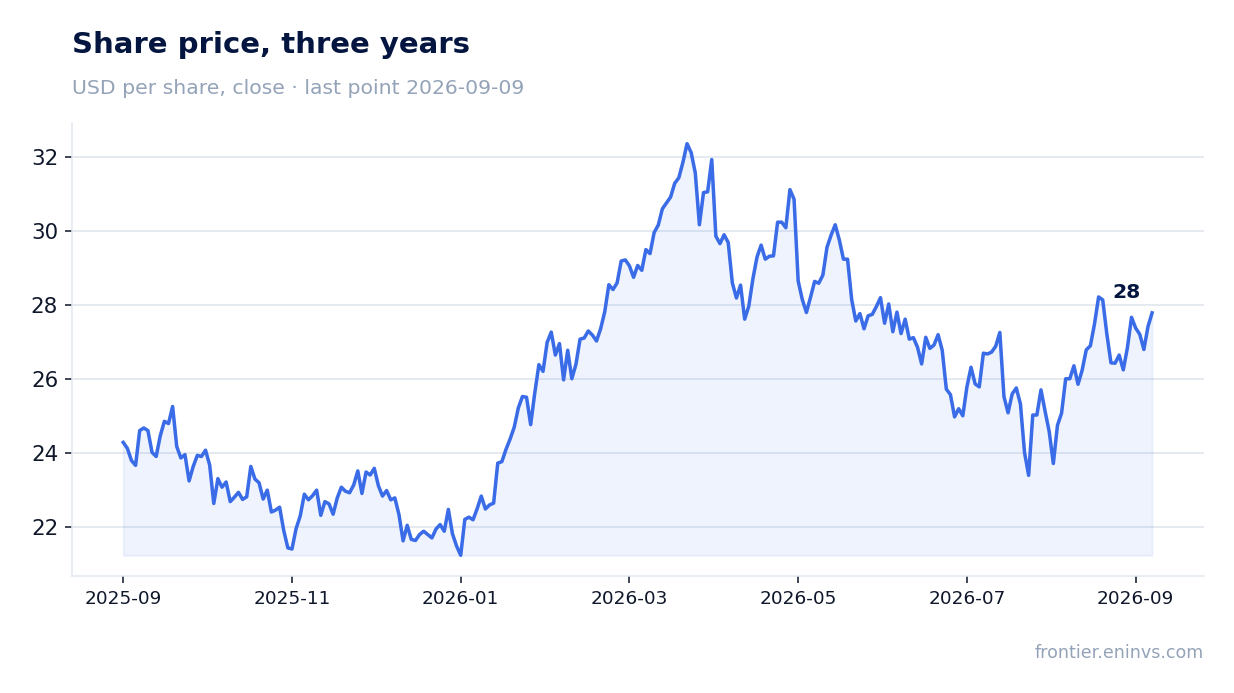
The share price before the release was 24.58 dollars; on the release day it fell 3.5%, and from the release to 9 September it rose 13.1%. The market first reacted to one-off costs and the scale of the upcoming acquisition, then to rising oil prices. With a multiple above its own average and limited production growth, the share looks rather unattractive.
Valuation on the latest reported figures
| Metric | Value |
|---|---|
| Market cap | 5.11 bn USD |
| P/E (LTM) | 12.0 |
| EV/EBITDA (LTM) | 5.1 |
| P/B | 2.56 |
| Net debt / EBITDA (LTM) | 0.15 |
| Operating cash flow (LTM) | 0.88 bn |
| ROE | 34.8% |
| Dividend yield (12m) | 2.4% |
| EV/EBITDA, 3-year average | 4.8 |
Bottom line
The strong point of the report is the company's ability to generate free cash flow: 234.6 million dollars for the quarter on capex of 125.0 million and low leverage of 0.15 EBITDA LTM. However, the 132.7% profit growth is almost entirely due to the oil price, not volumes, and with an EV/EBITDA of 5.12 against its own three-year average of 4.79 the share is valued above its history. The dividend was raised 9%, but the 2.37% yield is below the key rate. The main question for a holder is whether oil prices hold and whether debt after the WildFire Energy deal eats into free cash flow. The verdict is rather unattractive.
Open the company's financial profile MGY →
See also: market overview · valuation map · stock screeners