nVent Electric plc: Revenue doubled in a year, but EBITDA margin fell to 11.4% – the market focuses on adjusted metrics

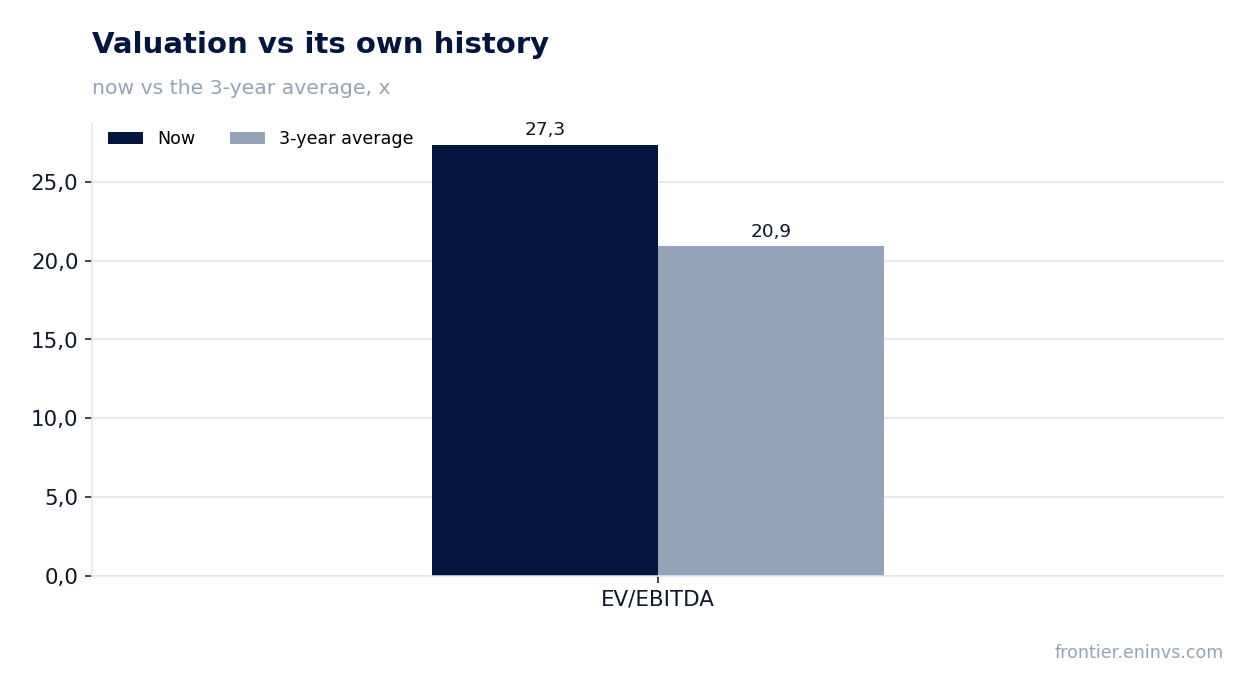
On July 31, nVent Electric plc reported Q2 2026 results: revenue grew 52.8% to $1,471.3 million, net profit rose 97.2% to $215.9 million, but EBITDA margin fell from 21.5% to 11.4% due to one-off items. At the current price, the share looks rather attractive: the portal's model implies upside of +28%, and while EV/EBITDA of 27.3 remains above its own three-year average of 20.9, the market is already pricing in continued strong organic growth.
Key takeaways
— Revenue grew 53% in the quarter, with organic growth of 47% – data centers were the main driver
— EBITDA margin fell to 11.4% from 21.5% a year earlier due to one-off items, including IEEPA tariff reimbursements
— Adjusted EPS rose 69% to $1.45, reflecting the strength of the underlying business
— Operating cash flow in Q2 was $189 million, up 107% year-over-year
— The company raised its 2026 revenue growth guidance to 37–39% from 26–28% previously
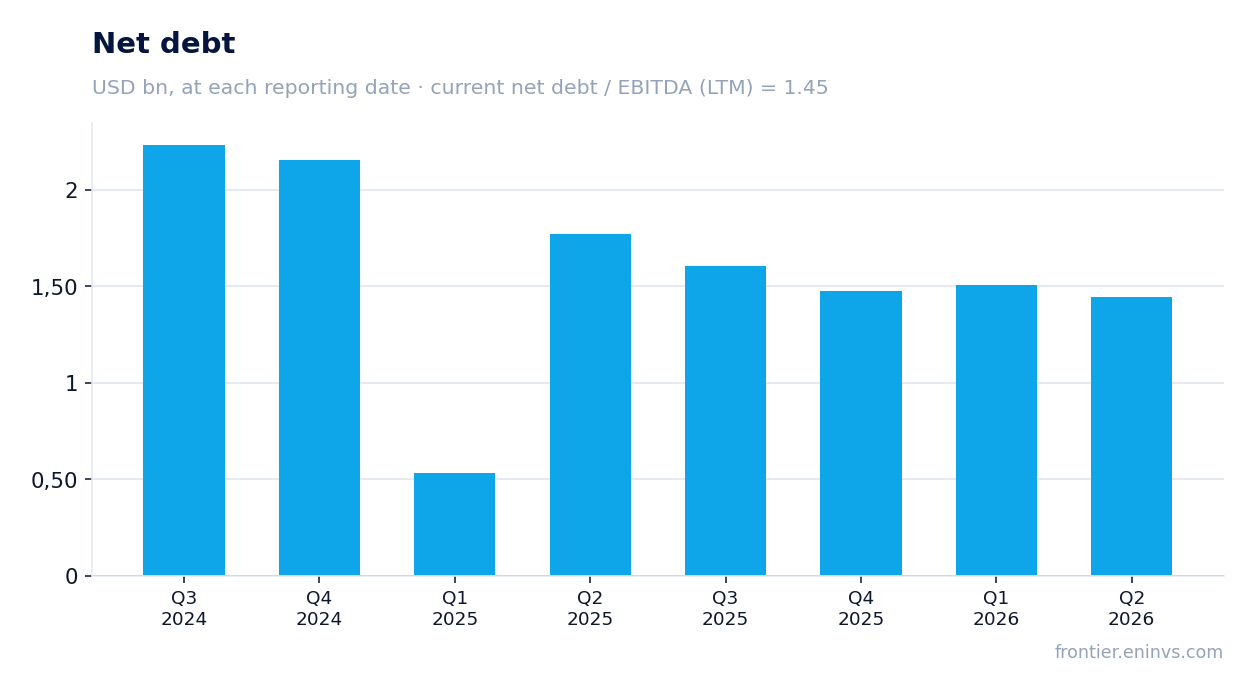
— Net debt stood at $1,475.4 million, with a net debt/EBITDA ratio of 1.45 over the last twelve months
— Systems Protection sales grew 70%, while Electrical Connections grew 21%
Attractiveness
Key figures, USD bn
| Metric | Q2 2025 | Q2 2026 | Change |
|---|---|---|---|
| Revenue | 0.96 | 1.47 | +52.8% |
| EBITDA | 0.21 | 0.17 | -19.1% |
| Operating profit | 0.16 | 0.30 | +91.9% |
| Net profit | 0.11 | 0.22 | +97.2% |
| Operating cash flow | -0.02 | 0.18 | to profit |
| Capex | 0.02 | 0.02 | +27.2% |
| EBITDA margin | 21.5% | 11.4% | -10.1 pp |
| Net margin | 11.4% | 14.7% | +3.3 pp |
Revenue grew 53% in the quarter, with organic growth of 47% – data centers were the main driver
In Q2 2026, nVent Electric plc's sales reached $1,471.3 million, up 52.8% year-over-year. Organic growth, excluding currency effects and acquisitions, was 47% – the company continues to receive significant orders from data center operators, as evidenced by the expansion of liquid cooling manufacturing.
The Systems Protection segment, which includes system protection and cooling solutions, grew sales 70% to $1,072.1 million, while Electrical Connections grew only 21% to $399.2 million. The difference in growth rates highlights where demand is concentrated – in data center infrastructure, not traditional electrical products.
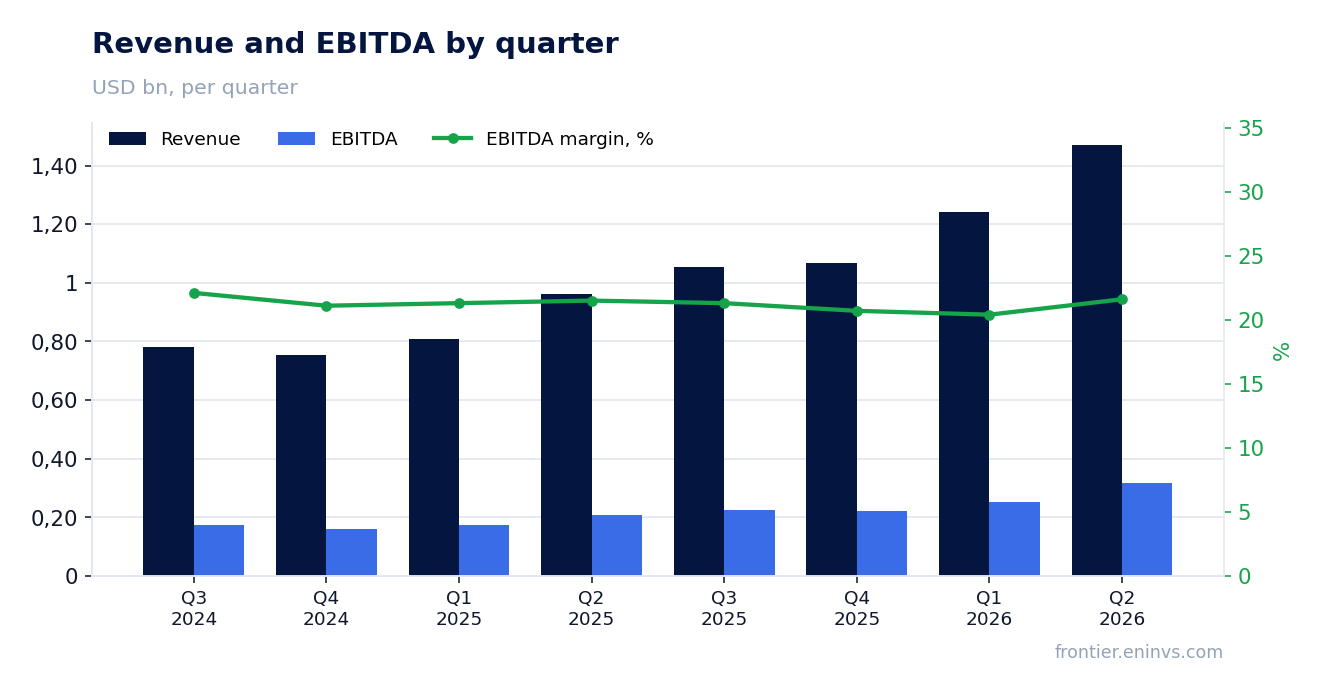
EBITDA margin fell to 11.4% from 21.5% a year earlier due to one-off items, including IEEPA tariff reimbursements
Reported EBITDA for the quarter was $318.1 million, down 19.1% year-over-year, with margin falling from 21.5% to 11.4%. The reason lies in one-off adjustments: the company recorded a reimbursement of previously paid IEEPA tariffs of $25.8 million, as well as restructuring and acquisition integration costs.
Excluding these items, adjusted operating income rose 61% to $322.7 million, and adjusted operating margin was 21.9% versus 20.8% a year earlier. Thus, operations remain healthy, and the EBITDA margin decline is an accounting artifact, not a deterioration of the business.
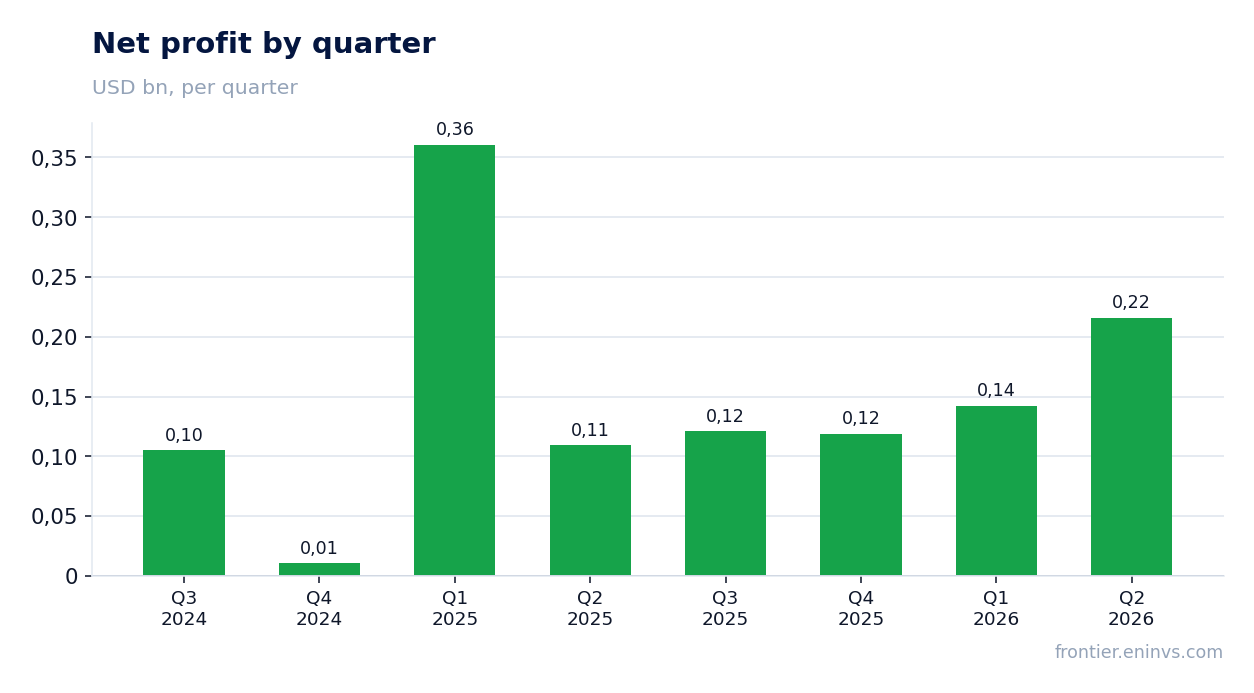
Adjusted EPS rose 69% to $1.45, reflecting the strength of the underlying business
GAAP net profit for the quarter was $215.9 million, or $1.32 per diluted share, up 103% year-over-year. However, excluding one-off items and amortization of acquired intangibles, adjusted EPS reached $1.45, up 69%.
Adjusted profit growth outpaces organic revenue growth, indicating operating leverage: the company is growing sales faster than expenses, which is reflected in the bottom line. Investors should focus on adjusted metrics, as they better reflect recurring profitability.
Operating cash flow in Q2 was $189 million, up 107% year-over-year
In Q2 2026, operating cash flow reached $188.8 million versus $91.0 million a year earlier – up 107%. Free cash flow after capital expenditures of $21.5 million was $167.3 million, up 125% from Q2 2025.
The improvement in cash flow is driven by higher profit and working capital control. In H1, operating cash flow was $278.7 million and free cash flow $221.1 million, allowing the company to fund dividends and reduce debt.
The company raised its 2026 revenue growth guidance to 37–39% from 26–28% previously
Management significantly improved its full-year 2026 guidance: reported revenue growth is now expected at 37–39% (previously 26–28%), with organic growth of 32–34%. GAAP EPS guidance was raised to $4.29–$4.39, and adjusted EPS to $5.00–$5.10.
The guidance raise reflects confidence in sustained data center demand and successful integration of recent acquisitions. For Q3, the company expects organic sales growth of 32–35%, only slightly below current levels.
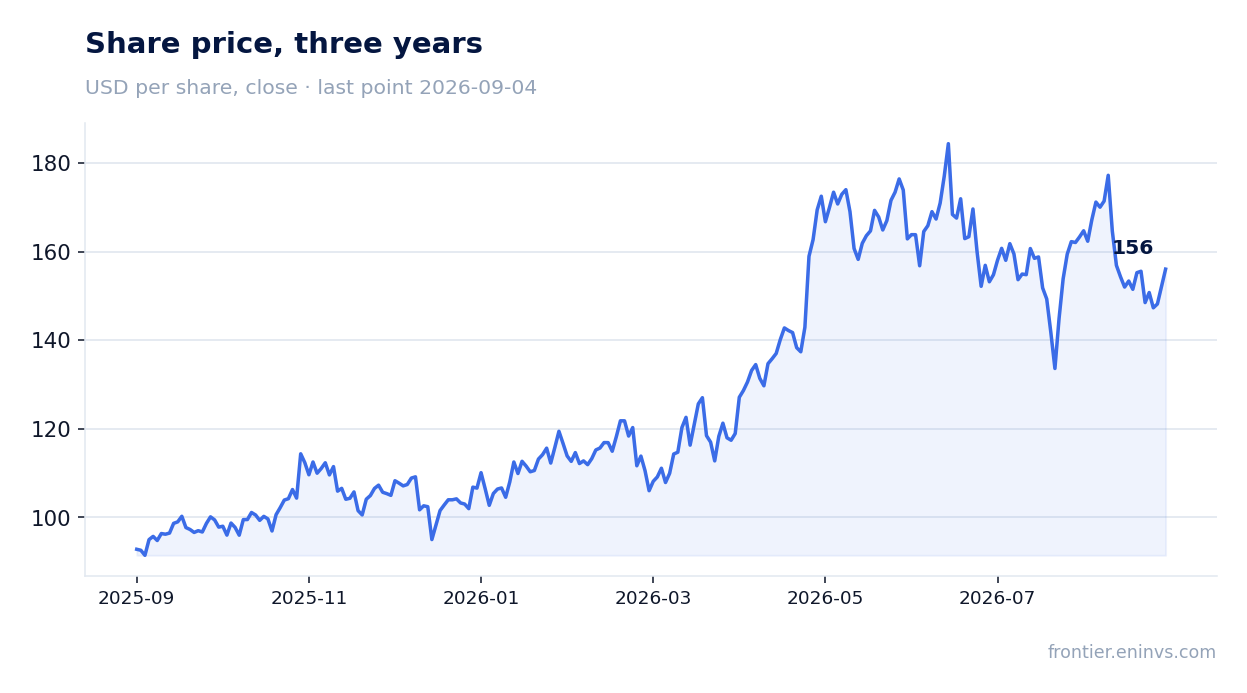
Net debt stood at $1,475.4 million, with a net debt/EBITDA ratio of 1.45 over the last twelve months
At the end of Q2, nVent Electric plc's net debt stood at $1,475.4 million, slightly below the level of a year earlier ($1,772.8 million in Q2 2025). The net debt/EBITDA ratio over the last twelve months is 1.45, a moderate level for a company with growing cash flow.
Debt reduction is driven by strong free cash flow generation: in H1, the company allocated $68.2 million to dividends and $50.4 million to share buybacks, while net debt decreased by $64.5 million from the start of the year.
Systems Protection sales grew 70%, while Electrical Connections grew 21%
The Systems Protection segment, which includes cooling and electrical protection solutions, grew sales 70% to $1,072.1 million, with organic growth of 62%. Segment adjusted operating margin rose 150 basis points to 23.2%.
Electrical Connections grew only 21% to $399.2 million, and its margin fell 140 basis points to 27.3%. The company attributes this to demand structure: major investments are currently directed to data centers, favoring Systems Protection.
Valuation on the latest reported figures
| Metric | Value |
|---|---|
| Market cap | 26.4 bn USD |
| P/E (LTM) | 44.1 |
| EV/EBITDA (LTM) | 27.3 |
| P/B | 7.07 |
| Net debt / EBITDA (LTM) | 1.45 |
| Operating cash flow (LTM) | 0.47 bn |
| ROE | 22.2% |
| Dividend yield (12m) | 0.5% |
| EV/EBITDA, 3-year average | 20.9 |
Bottom line
nVent Electric plc's Q2 2026 report is strong across all operational metrics: revenue grew 53%, adjusted EPS rose 69%, and free cash flow doubled. The EBITDA margin decline to 11.4% is due to one-off items, as confirmed by adjusted metrics. The company raised its full-year guidance, indicating management's confidence in sustained demand. However, the current valuation – EV/EBITDA of 27.3 versus the three-year average of 20.9 – already prices in much of the optimism. At the same time, the portal's model implies upside of +28%, making the share rather attractive for investors with a one-year horizon. The key question is whether organic growth above 30% will persist in the coming quarters.
Open the company's financial profile NVT →
See also: market overview · valuation map · stock screeners