SentinelOne, Inc.: revenue up 21%, but GAAP loss widens and shares trade 5% above model value
On August 27, 2026, SentinelOne, Inc. reported results for the second quarter of fiscal year 2027 (ended July 31, 2026). Revenue grew 21% to $292 million, beating guidance, and ARR reached $1.218 billion (+22%). However, the GAAP loss widened to $93.4 million from $72.0 million a year earlier, and free cash flow remained negative. At the current price, the shares look rather unattractive: the portal model implies -5% upside, and the GAAP loss and negative FCF do not support management's optimism.
Key takeaways
— Revenue grew 21% to $292 million, beating guidance, but the GAAP loss widened to $93.4 million
— ARR reached $1.218 billion (+22%), and customers with ARR over $100k grew 13% to 1,715
— GAAP net loss margin was -32% versus -30% a year earlier, despite revenue growth
— Free cash flow remained negative: -$13.2 million for the quarter
— The company raised its revenue and non-GAAP operating income outlook for fiscal year 2027
— Shares rose 10.7% on the release day but then fell 3.1% by September 4
— On the portal's model, fair value is 5% below the current price
Attractiveness
Key figures, USD bn
| Metric | Q2 2025 | Q2 2026 | Change |
|---|---|---|---|
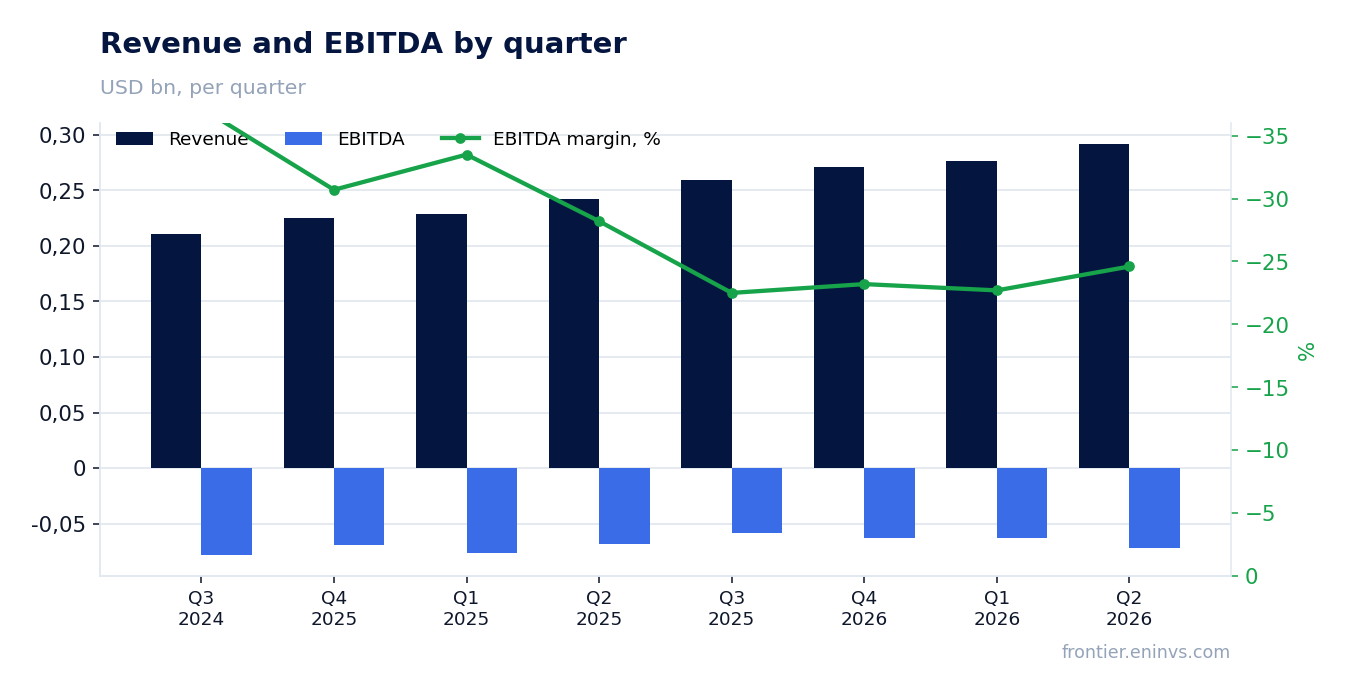
| Revenue | 0.24 | 0.29 | +20.6% |
| EBITDA | -0.07 | -0.07 | — |
| Operating profit | -0.08 | -0.09 | — |
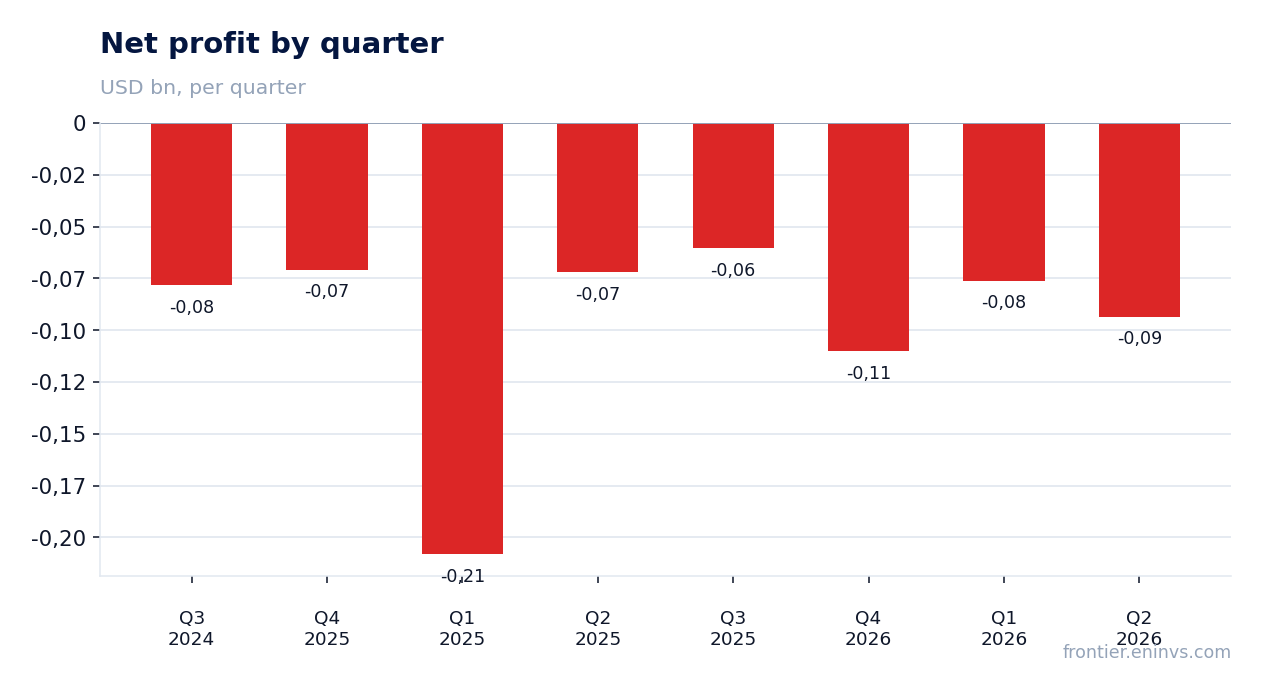
| Net profit | -0.07 | -0.09 | — |
| Operating cash flow | -0.00 | -0.01 | — |
| Capex | 0.00 | 0.00 | -73.5% |
| EBITDA margin | -28.2% | -24.6% | +3.6 pp |
| Net margin | -29.7% | -32.0% | -2.3 pp |
Revenue grew 21% to $292 million, beating guidance, but the GAAP loss widened to $93.4 million
In the second quarter of fiscal year 2027 (ended July 31, 2026), SentinelOne, Inc. revenue was $291.981 million, up 20.6% year over year. The company beat its own guidance of $285–287 million. Growth was driven by subscriptions and consumption, with ARR up 22% to $1.218 billion.
However, the GAAP loss for the quarter widened to -$93.4 million from -$72.0 million a year earlier. Net margin deteriorated from -29.7% to -32.0%. The main driver is the operating loss, which expanded to -$90.8 million from -$80.6 million despite revenue growth. Restructuring charges were $24.4 million, including $10.8 million of non-cash stock-based compensation.
ARR reached $1.218 billion (+22%), and customers with ARR over $100k grew 13% to 1,715
The key operating metric – annualized recurring revenue (ARR) – reached $1.218 billion as of July 31, 2026, up 22% year over year. This outpaces revenue growth (+20.6%), indicating that new contracts and expansions from existing customers continue to gain momentum.
The number of customers with ARR of $100,000 or more grew 13% to 1,715. The company notes that its platform model drives expansion, with customers adding Singularity modules, including AI runtime protection. This supports the cross-sell strategy, though average revenue per customer is not disclosed.
GAAP net loss margin was -32% versus -30% a year earlier, despite revenue growth
In the second quarter of fiscal year 2027, GAAP net margin deteriorated to -32.0% from -29.7% a year earlier. Operating margin also declined: from -33% to -31% on a GAAP basis, but this improvement did not offset higher other expenses. Notably, interest income fell from $12.2 million to $6.2 million, reflecting a shrinking cash cushion.
The non-GAAP picture looks better: non-GAAP operating margin rose to 10% from 2%, and non-GAAP net margin to 10% from 5%. However, these measures exclude stock-based compensation ($92.1 million for the quarter) and restructuring. The GAAP loss is real: the company spends more than it earns, and the gap is widening.
Free cash flow remained negative: -$13.2 million for the quarter
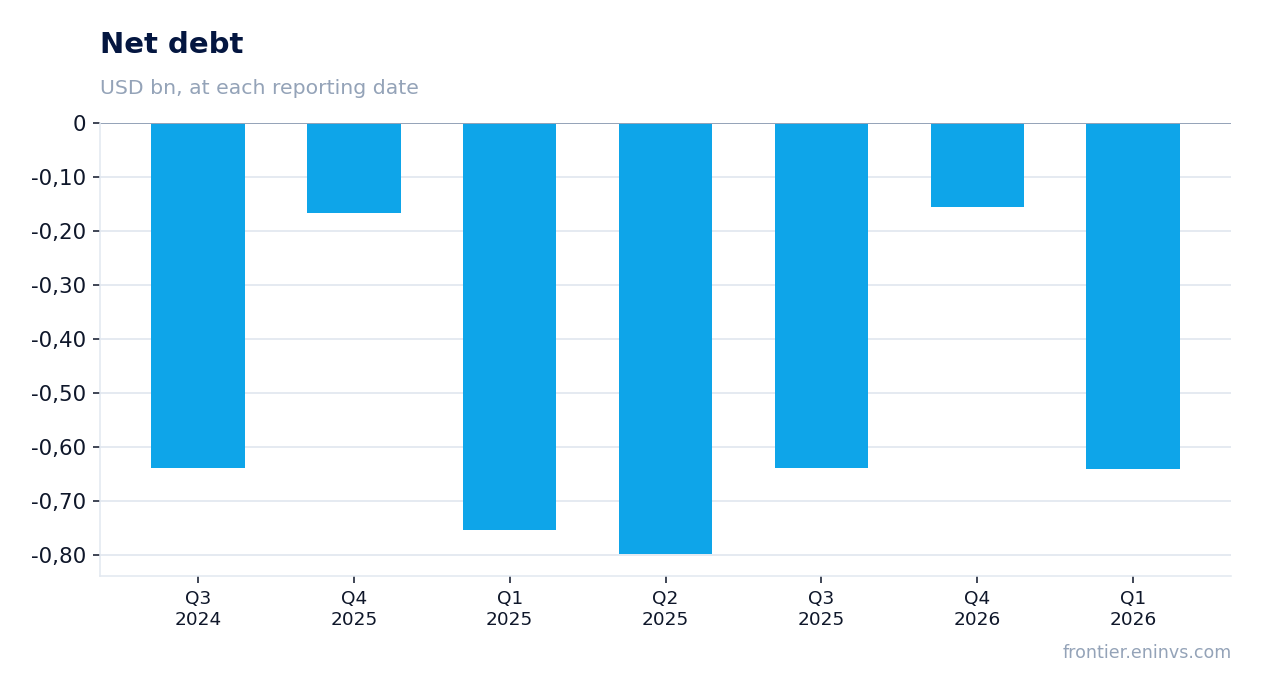
In the second quarter, operating cash flow was -$6.545 million, and capital expenditures were $0.07 million. Free cash flow (FCF) came in at -$13.2 million (including $6.6 million of capitalized internal-use software). A year earlier, FCF was -$7.1 million, so the negative gap widened.
For the first half of fiscal year 2027, FCF is positive at $17.5 million, but that is thanks to a strong first quarter ($30.7 million). The company attributes seasonality to billing cycles, but the second consecutive quarter shows that cash generation remains volatile. The balance sheet holds $813 million in cash and investments, providing a cushion but not solving the profitability problem.
The company raised its revenue and non-GAAP operating income outlook for fiscal year 2027
SentinelOne, Inc. raised its fiscal year 2027 guidance: revenue is expected at $1.202–1.207 billion (previously $1.185–1.190 billion), and non-GAAP operating income at $124–128 million (previously $115–120 million). For the third quarter, the company expects revenue of $309–311 million and non-GAAP operating income of $38–40 million.
The raised guidance reflects management's confidence in continued growth, particularly in AI security. However, non-GAAP operating income excludes significant non-cash expenses: stock-based compensation was $167 million in the first half. The GAAP operating loss for the first half was $170.5 million, only slightly better than $168.1 million a year earlier.
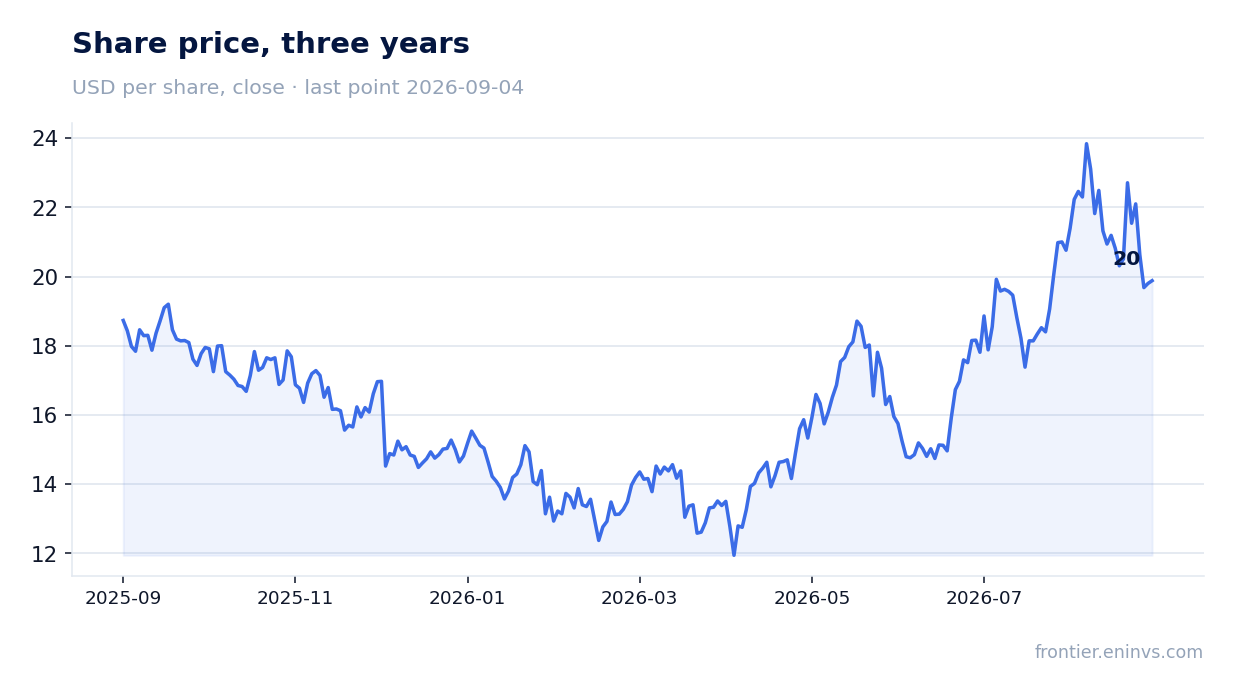
Shares rose 10.7% on the release day but then fell 3.1% by September 4
On the release day, August 27, shares rose 10.7% – the market reacted positively to the beat and raised guidance. However, by September 4 they had fallen 3.1% from the post-release level, indicating a partial reversal of the initial optimism.
The current market cap is $6.43 billion. With LTM revenue of $1.1 billion, the EV/Sales multiple (net of cash) is around 5.8x – below historical peaks but still expensive for a company with a GAAP loss and negative FCF. The market is pricing in continued high growth, but any miss on guidance could trigger a correction.
On the portal's model, fair value is 5% below the current price
Our fundamental value-creation model, based on EBITDA growth and a target multiple, shows that shares trade 5% above fair value. This means the current price already reflects a significant portion of the expected margin improvement.
The shares are held in the 'US AI infrastructure' strategy on the portal, but this is not an argument for the assessment – portfolio membership follows each strategy's own screen. To change the verdict toward attractiveness, we would need either a lower price or visible progress in GAAP profitability and sustainable positive free cash flow.
Valuation on the latest reported figures
| Metric | Value |
|---|---|
| Market cap | 6.43 bn USD |
| P/B | 4.47 |
| Operating cash flow (LTM) | 0.08 bn |
| ROE | -25.9% |
Bottom line
The strong side of the report is the acceleration of ARR to +22% and the raised guidance: the company confirms its status as a fast-growing player in AI security. However, the GAAP loss widened, free cash flow remained negative, and non-GAAP profit is achieved by excluding stock-based compensation and restructuring. At the current price, shares are valued 5% above fair value on the portal's model, making them rather unattractive. To change the assessment, we need either a lower price or sustainable progress in GAAP profitability and positive FCF.
Open the company's financial profile S →
See also: market overview · valuation map · stock screeners