SM Energy Company: profit up 5.3x, but almost all of it came from a production rebound after a disastrous first quarter

SM Energy Company reported second-quarter 2026 results. Revenue rose 215.3% year on year to $2.5 billion, EBITDA grew 255.2% to $2.088 billion, and net profit jumped 431.1% to $1.071 billion. The EBITDA margin reached 83.5% versus 74.1% a year earlier, while net debt fell to minus $620 million. At the same time, the stock trades at EV/EBITDA of 2.55 against its own three-year average of 4.0, which makes it attractive at the current level.
Key takeaways
— Revenue tripled, but this is a rebound from a first-quarter collapse, not sustainable growth
— The 83.5% EBITDA margin reflects a low base and one-offs, not a new normal
— Net profit of $1.071 billion came almost entirely from the recovery in operating results
— Net debt turned negative at minus $620 million, but this is more a cash effect than a durable improvement
— Free cash flow remains under pressure: capex of $754 million consumes almost the entire operating cash flow
— The 2.79% dividend yield looks modest against the key rate and does not cover commodity price volatility risk
— The 2.55 EV/EBITDA versus the three-year average of 4.0 leaves room, but the portal model points to minus 85% to fair value
Attractiveness
Key figures, USD bn
| Metric | Q2 2025 | Q2 2026 | Change |
|---|---|---|---|
| Revenue | 0.79 | 2.50 | +215.3% |
| EBITDA | 0.59 | 2.09 | +255.2% |
| Operating profit | 0.29 | 1.50 | +407.3% |
| Net profit | 0.20 | 1.07 | +431.1% |
| Operating cash flow | 0.57 | 1.10 | +93.1% |
| Capex | 0.41 | 0.75 | +83.9% |
| EBITDA margin | 74.1% | 83.5% | +9.4 pp |
| Net margin | 25.4% | 42.8% | +17.4 pp |
Revenue tripled, but this is a rebound from a first-quarter collapse, not sustainable growth
In the second quarter of 2026, revenue reached $2.5 billion, up 215.3% year on year. This looks impressive, but it is almost entirely explained by a low base: in the first quarter of 2026, revenue was $1.479 billion, and a quarter earlier it was just $704.5 million. So the current level is a recovery from a collapse, not organic expansion.
Year-on-year revenue also grew in previous quarters: 75.0% in Q1 2026 and 25.0% in Q2 2025. However, Q4 2025 saw a 17.3% decline. Such mixed dynamics indicate that the business is highly dependent on one-off factors rather than a sustainable trend.
The revenue structure is not disclosed in the report, but the growth is likely tied to a recovery in production volumes or hydrocarbon prices. Without these details, one cannot claim the company has reached a new level. For an investor, the key point is that the current quarterly result is a peak, not a plateau.
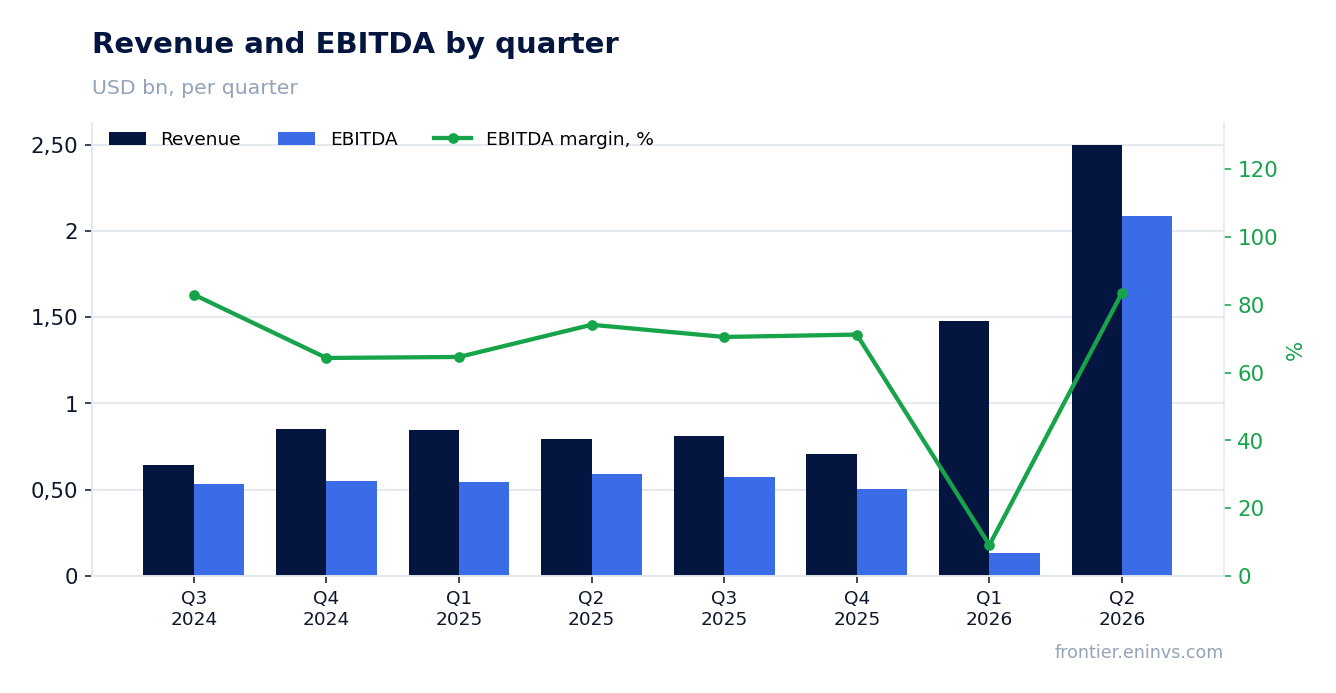
The 83.5% EBITDA margin reflects a low base and one-offs, not a new normal
EBITDA in Q2 2026 was $2.088 billion, with a margin of 83.5%. A year earlier, the margin was 74.1%, an increase of 9.4 percentage points. Such a margin level is atypical for the oil and gas industry and requires explanation.
Operating profit in Q2 2026 was $1.496 billion, significantly higher than in previous quarters. For example, Q1 2026 saw an operating loss of $298 million, and Q4 2025 had a profit of only $182.6 million. The sharp jump suggests either one-off write-offs or a recovery after them in the reporting period.
Cost of goods sold and operating expenses are not disclosed in detail, but such a high margin could be related to asset sales or inventory revaluation. Without this data, the sustainability of the margin is questionable. An investor should focus on average values over several quarters rather than the peak.
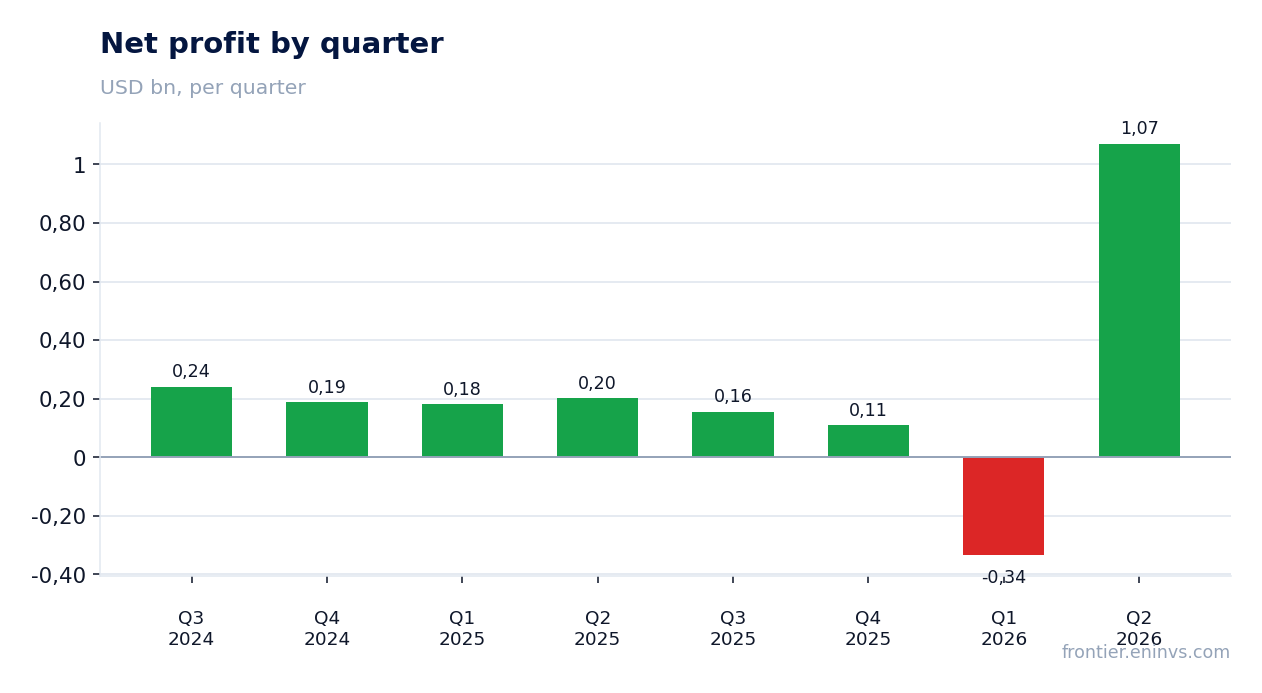
Net profit of $1.071 billion came almost entirely from the recovery in operating results
Net profit in Q2 2026 was $1.071 billion, up 431.1% year on year. For comparison: Q1 2026 had a loss of $335 million, and Q4 2025 had a profit of only $109.2 million. Thus, the current quarter is a sharp reversal after a loss.
The net margin reached 42.8% versus 25.4% a year earlier. This margin growth is explained not only by higher revenue but also by lower relative costs. However, given that operating profit was negative in the previous quarter, the current result looks like a recovery rather than a sustainable improvement.
One-off items are not disclosed in the report, but such strong quarter-to-quarter volatility in profit indicates that the business is highly dependent on external factors. For an investor, it is important that the current quarter's profit may not repeat in the next one.
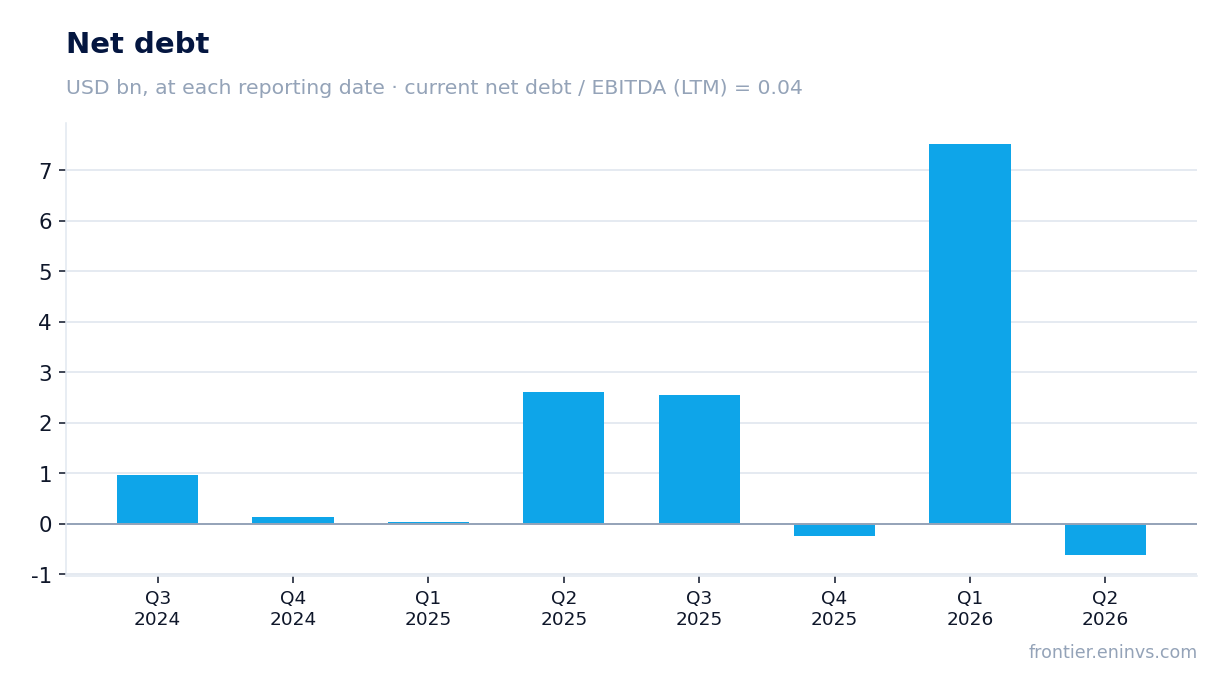
Net debt turned negative at minus $620 million, but this is more a cash effect than a durable improvement
At the end of Q2 2026, the company's net debt was minus $620 million, meaning cash exceeds debt obligations. This is a sharp change from Q1, when net debt was $7.527 billion. Such a reduction in debt is likely related to asset sales or financing raised.
The net debt to EBITDA ratio for the trailing twelve months is 0.04. This is a very low level, indicating high debt sustainability. However, it is worth noting that the trailing twelve-month EBITDA includes both the loss-making Q1 2026 and the record Q2 2026, which distorts the metric.
Operating cash flow in Q2 2026 was $1.103 billion, significantly higher than in previous quarters. This helped reduce debt. But the sustainability of such cash flow is questionable given the volatility of revenue.
Free cash flow remains under pressure: capex of $754 million consumes almost the entire operating cash flow
Operating cash flow in Q2 2026 was $1.103 billion, while capex was $754 million. Thus, free cash flow before dividends was about $349 million. This is modest compared to net profit of $1.071 billion, indicating that profit does not fully convert into cash.
For comparison: in Q1 2026, operating cash flow was $640 million and capex was $555 million, resulting in free cash flow of only $85 million. In Q4 2025, operating cash flow was $451.9 million and capex was $228.8 million, giving free cash flow of $223.1 million. The current quarter is better than previous ones but still far from covering dividends and debt.
High capital expenditures may be related to field development or asset acquisitions. Without these details, it is difficult to assess how justified they are. For an investor, it is important that free cash flow remains volatile and dependent on commodity prices.
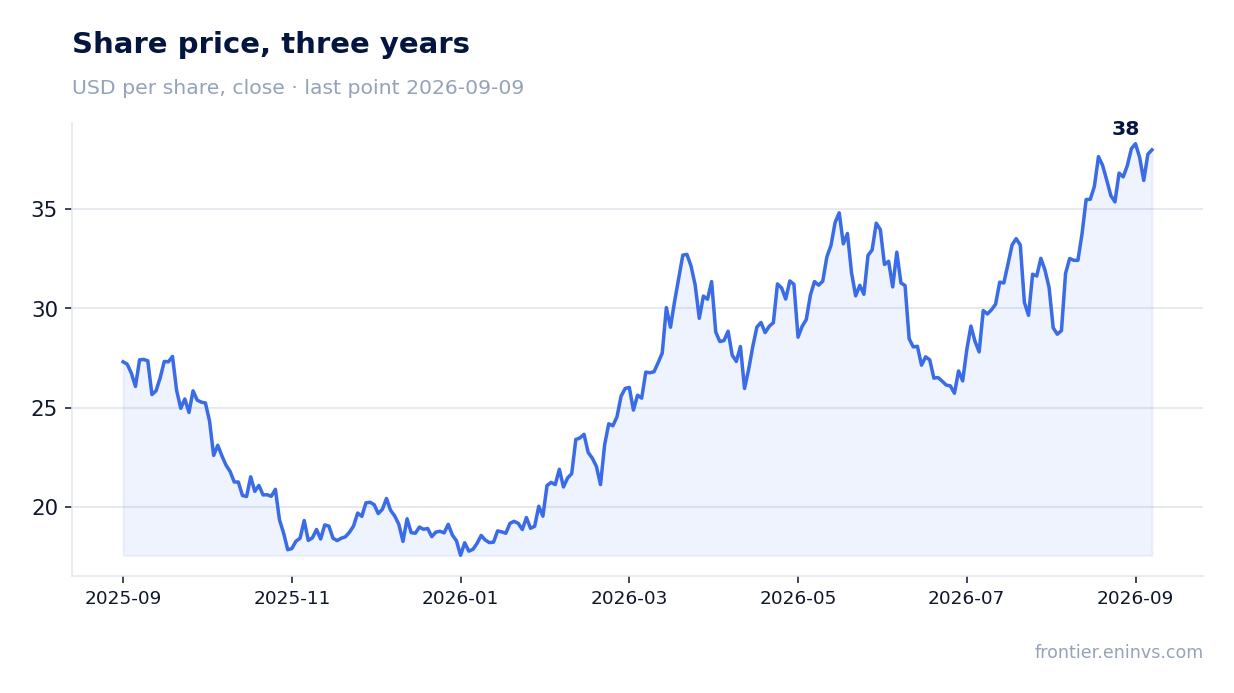
The 2.79% dividend yield looks modest against the key rate and does not cover commodity price volatility risk
SM Energy Company's dividend yield over the trailing twelve months is 2.79%. This is lower than the yield on many other instruments and does not compensate for the risks associated with oil and gas price volatility. The company did not disclose the size of the last dividend or the year for which it was paid, but the yield indicates that payments are modest.
Our estimate of the dividend for the current year is based on trailing twelve-month profit of $1.0003 billion and a payout ratio the company does not disclose. Assuming the payout ratio remains at the level of previous years, the dividend could be in the range of $0.5–0.7 per share. However, this is only our estimate and depends on profit volatility.
The key rate in the US remains high, making a 2.79% dividend yield less attractive. For comparison, the yield on 10-year Treasury bonds exceeds 4%. Thus, the dividend is not the main factor for investing in this stock.
What could make the payout smaller: a further drop in hydrocarbon prices, rising capital expenditures, or the need to repay debt. Given that free cash flow in Q2 was only $349 million, the dividend could be at risk if prices fall.
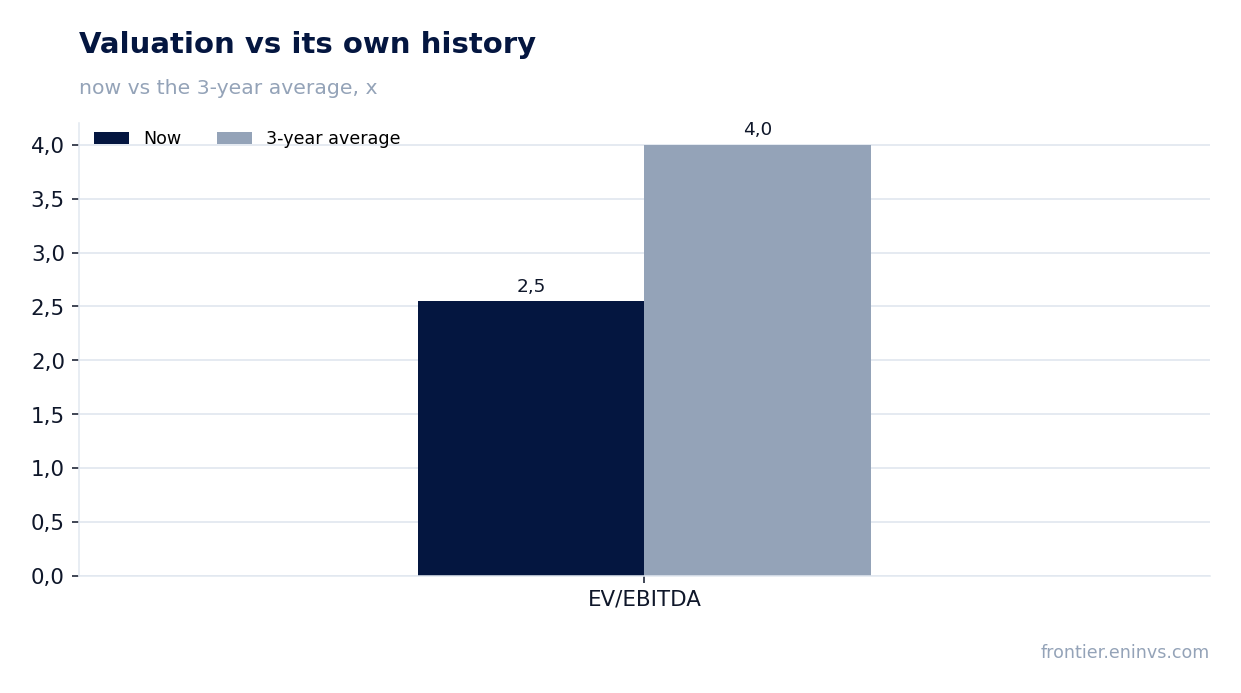
The 2.55 EV/EBITDA versus the three-year average of 4.0 leaves room, but the portal model points to minus 85% to fair value
The current EV/EBITDA multiple is 2.55, significantly below the three-year average of 4.0. This means the market values the company cheaper than on average over the past three years. Such a valuation could be attractive if earnings are sustainable, but given the volatility, the market is pricing in risk.
The trailing twelve-month P/E is 9.02, which is also low. However, trailing twelve-month profit includes the Q1 2026 loss, which distorts the metric. Excluding that quarter, the P/E would be even lower, but this does not automatically make the valuation attractive.
The portal model, which re-prices EBITDA at current commodity prices at the target EV/EBITDA, shows a potential downside to fair value of 85%. This is our own estimate, and it reflects the high risk that current commodity prices are not sustainable. Thus, even with a low multiple, the stock may be overvalued relative to fair value.
Valuation on the latest reported figures
| Metric | Value |
|---|---|
| Market cap | 9.02 bn USD |
| P/E (LTM) | 9.0 |
| EV/EBITDA (LTM) | 2.5 |
| P/B | 2.13 |
| Net debt / EBITDA (LTM) | 0.04 |
| Operating cash flow (LTM) | 2.00 bn |
| ROE | 58.4% |
| Dividend yield (12m) | 2.8% |
| EV/EBITDA, 3-year average | 4.0 |
Bottom line
Bottom line: in Q2 2026, SM Energy Company showed sharp growth in revenue, EBITDA, and net profit, but this growth is almost entirely explained by a recovery from a loss-making Q1 and a low base a year earlier. The 83.5% EBITDA margin looks abnormally high and is unlikely to be sustainable. Net debt turned negative, but this is more a cash effect than a long-term improvement. The 2.79% dividend yield is modest and does not compensate for risks. The EV/EBITDA of 2.55 is below the three-year average of 4.0, but the portal model points to an 85% downside to fair value. Verdict: the stock looks attractive at the current level due to the low multiple, but high commodity price volatility risk and weak free cash flow require caution.
Open the company's financial profile SM →
See also: market overview · valuation map · stock screeners