Talen Energy: Adjusted EBITDA rose to $374 million, but a GAAP loss and $9.3 billion of debt decide the outcome
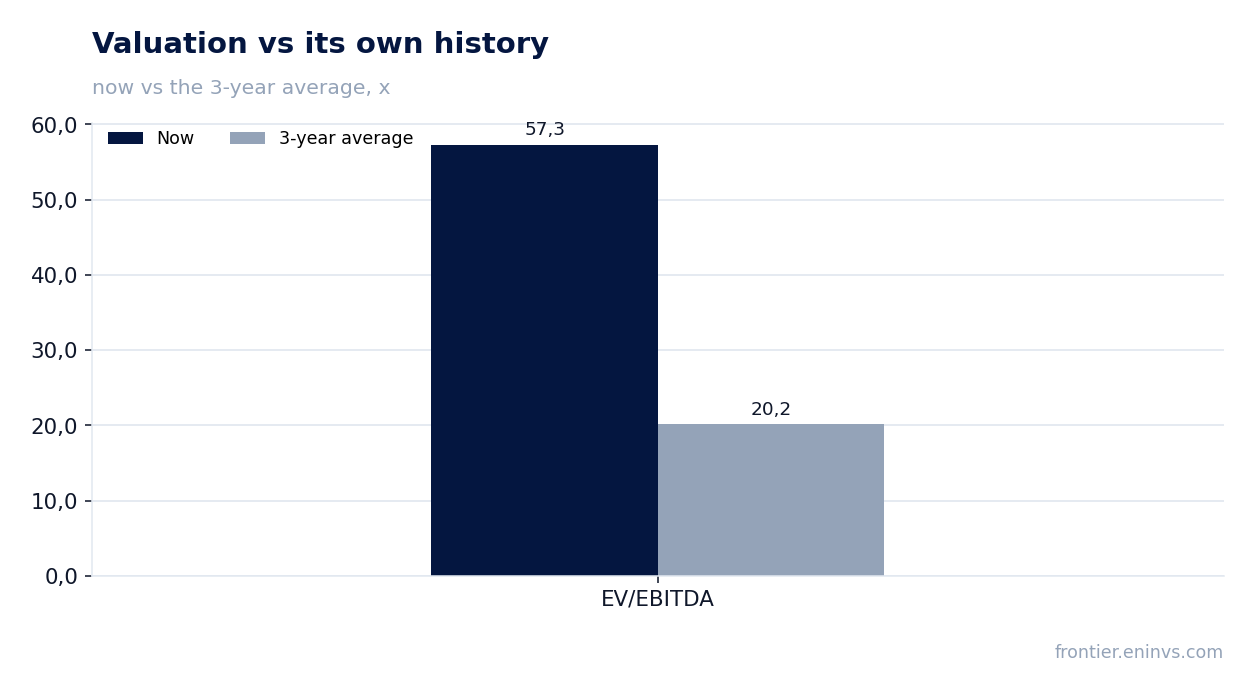
On August 5, Talen Energy Corporation released its second-quarter 2026 results. Revenue rose 41.9% year on year to $894 million, Adjusted EBITDA reached $374 million against $90 million a year earlier, but the GAAP loss was $92 million and net debt on the balance sheet stood at $9,341 million. The share looks unattractive: EV/EBITDA for the trailing twelve months is 57.3 against its own three-year average of 20.2, and leverage of 16.92 times LTM EBITDA leaves no room for error.
Key takeaways
— Revenue rose 41.9% year on year to $894 million, but almost all of the gain came from one-off items rather than organic demand
— Adjusted EBITDA of $374 million is four times last year's figure and rests on a return to normal plant utilisation
— The $92 million GAAP loss stems from unrealised derivative losses and higher interest expense
— Net debt rose to $9,341 million after the Cornerstone acquisition, and the ratio of debt to LTM EBITDA stands at 16.92
— Operating cash flow for the half-year was just $27 million because $495 million went to settle stock-based awards
— EV/EBITDA LTM of 57.3 against a three-year average of 20.2 — the market is paying for growth not yet confirmed by cash flow
Attractiveness
Key figures, USD bn
| Metric | Q2 2025 | Q2 2026 | Change |
|---|---|---|---|
| Revenue | 0.63 | 0.89 | +41.9% |
| EBITDA | 0.14 | 0.03 | -77.2% |
| Operating profit | 0.07 | -0.07 | -209.1% |
| Net profit | 0.07 | -0.09 | -227.8% |
| Operating cash flow | -0.18 | -0.43 | — |
| Capex | 0.03 | 0.14 | +321.2% |
| EBITDA margin | 21.6% | 3.5% | -18.1 pp |
| Net margin | 11.4% | -10.3% | -21.7 pp |
Revenue rose 41.9% year on year to $894 million, but almost all of the gain came from one-off items rather than organic demand
In the second quarter of 2026, Talen Energy Corporation's revenue reached $894 million, up 41.9% from a year earlier. For comparison, growth in the first quarter was even higher at 189.5%, and in the fourth quarter of 2025 it was 60.4%. The deceleration reflects the fact that the main effect of the Cornerstone acquisition, closed in June 2026, will fall in subsequent periods.
Within revenue, energy and other revenues reached $722 million against $366 million a year earlier, while capacity revenues were $237 million against $88 million. This growth was driven primarily by higher generation volumes: 14.1 TWh were produced in the quarter against 7.3 TWh a year earlier, and the capacity factor rose from 31.8% to 47.6%.
However, a significant part of the revenue increase came from one-off factors. The report notes that growth in energy and capacity revenues was partly offset by unrealised derivative losses of $212 million recorded within operating revenues. Without this effect, revenue would have been even higher, but it is precisely this derivative volatility that makes quarterly results poorly predictable.
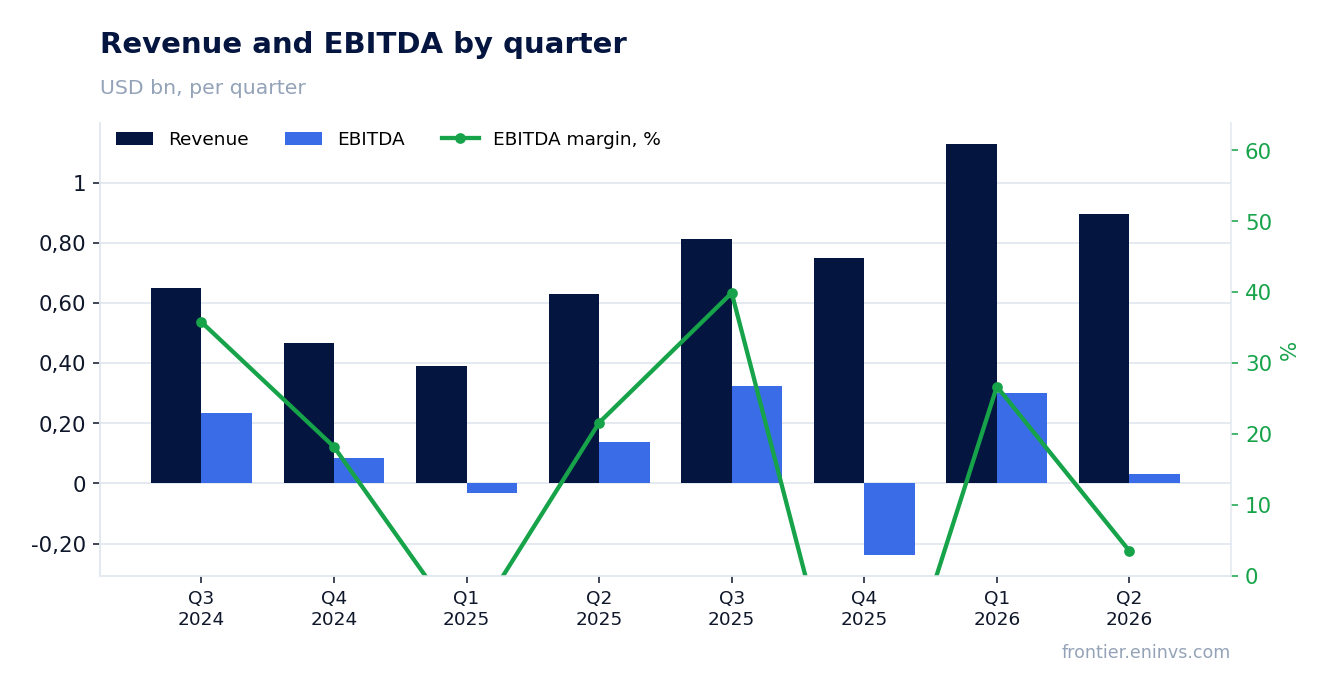
Adjusted EBITDA of $374 million is four times last year's figure and rests on a return to normal plant utilisation
Adjusted EBITDA in the second quarter of 2026 was $374 million against $90 million a year earlier. This company-defined measure excludes unrealised derivative losses, depreciation and several other items, so it looks significantly better than the GAAP result. The $284 million increase is attributed by the company to higher energy and capacity revenues and lower tax payments.
However, looking at reported EBITDA, which the FACTS state as $31 million for the quarter, the picture is different: it fell 77.2% year on year. The gap between the two measures — $343 million — is the portion the company considers one-off and unrelated to operating activity. For an investor, it is important to understand that it is adjusted EBITDA that underpins the company's 2026 guidance range of $2,025 million to $2,225 million.
The adjusted EBITDA margin is not disclosed, but the reported EBITDA margin was 3.5% against 21.6% a year earlier. This decline reflects higher operating expenses, including a rise in general and administrative expenses to $98 million from $41 million, linked to integration costs for acquired assets and employee compensation.
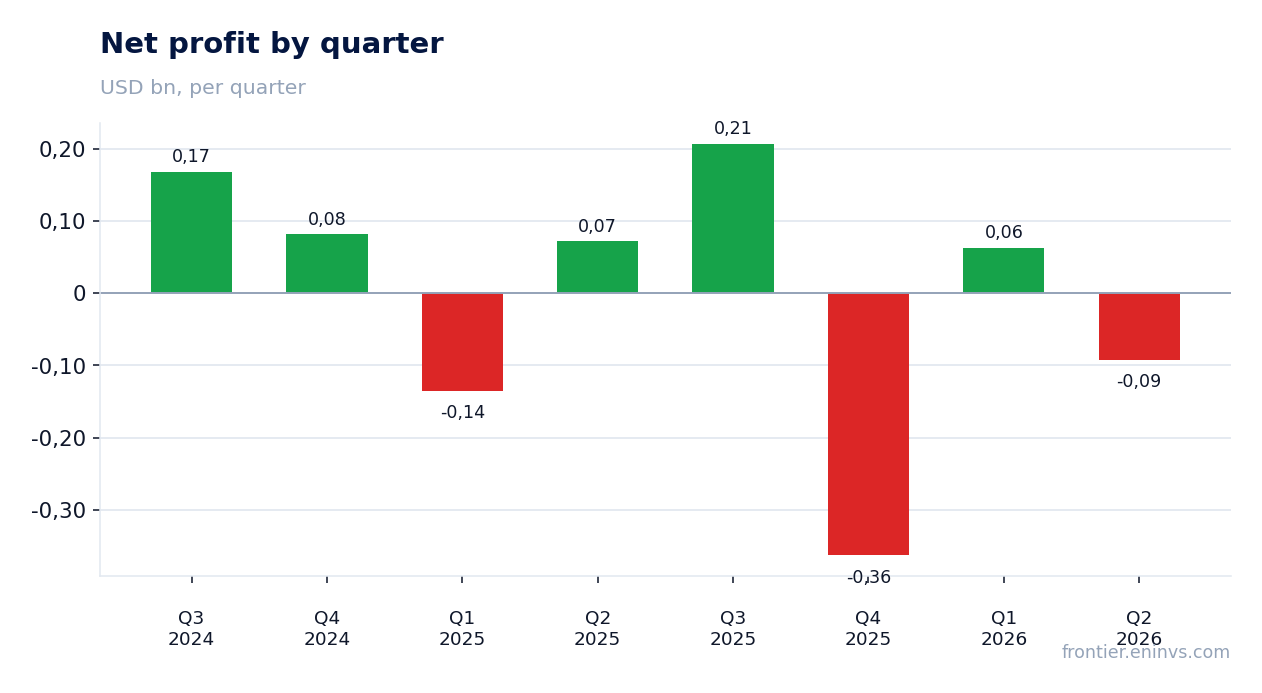
The $92 million GAAP loss stems from unrealised derivative losses and higher interest expense
Net loss attributable to stockholders in the second quarter of 2026 was $92 million against a profit of $72 million a year earlier. The company names two reasons directly: unrealised losses on derivative instruments and higher interest expense. Interest expense and other finance charges rose to $214 million from $62 million a year earlier — a consequence of issuing $4 billion of new bonds in April 2026 to finance the Cornerstone acquisition.
The unrealised derivative loss within operating revenues was $212 million, whereas a year earlier a gain of $176 million was recorded. This is not a cash movement but a revaluation of hedging contracts, which could reverse in the next quarter. That is why the company insists on using adjusted EBITDA, which excludes this effect.
Loss per share was $2.00 against a profit of $1.50 a year earlier. At the same time, for the first half of 2026 the loss was $29 million, better than last year's loss of $63 million. The difference between the quarterly and half-year results is explained by a strong first quarter, when profit reached $63 million.
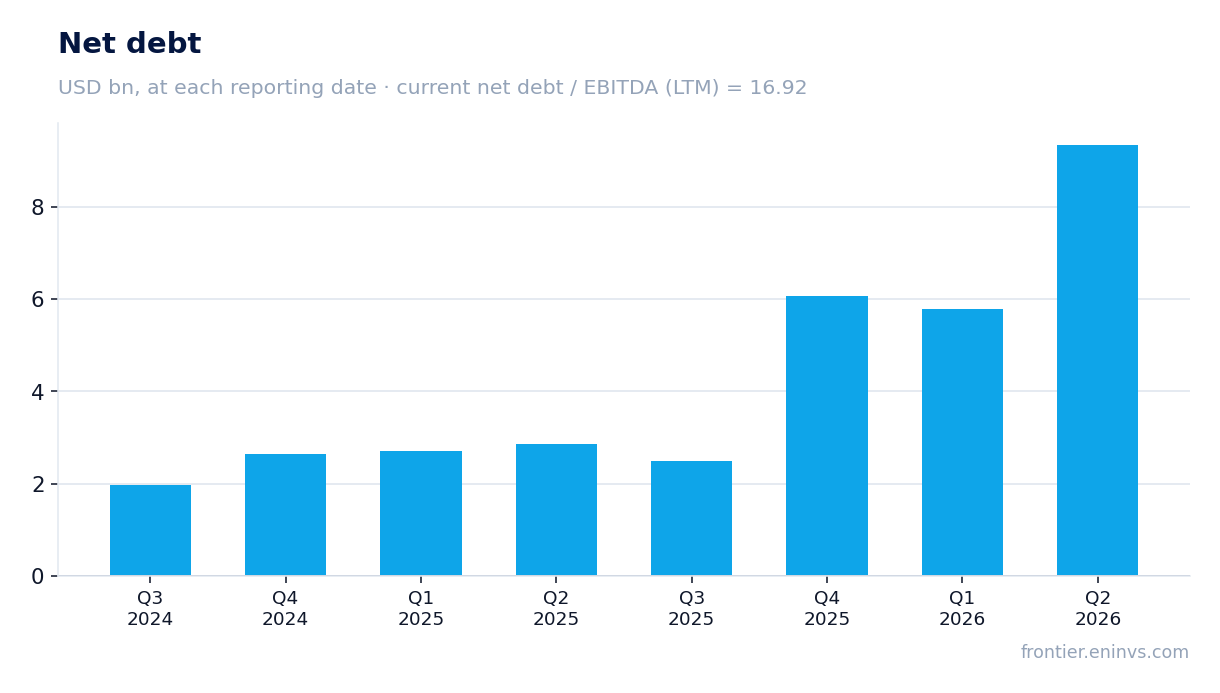
Net debt rose to $9,341 million after the Cornerstone acquisition, and the ratio of debt to LTM EBITDA stands at 16.92
Net debt at the end of the second quarter of 2026 was $9,341 million, up from $5,782 million at the end of the first quarter. The $3.6 billion increase is linked to the completion of the Cornerstone acquisition on June 15, 2026, which the company financed through bond issuance. The ratio of net debt to LTM EBITDA is 16.92 — a level significantly above the company's target of 3.5 times.
The company states it aims to keep net leverage below its 3.5x target. The current 16.92 level is a result of the denominator — LTM EBITDA — being only $361.8 million, as it includes quarters with negative EBITDA: minus $32 million in the first quarter of 2025 and minus $239 million in the fourth quarter of 2025. As these quarters roll out of the calculation and given the company's 2026 guidance of $2,025–$2,225 million, the ratio should decline, but for now it remains extremely high.
To service the debt, the company raised $1.5 billion at 6.125% due 2031 and $2.5 billion at 6.375% due 2033. At the same time, it redeemed $1.2 billion of secured notes at 8.625%. Interest expense for the quarter rose to $214 million, directly reducing the funds available to shareholders.
Operating cash flow for the half-year was just $27 million because $495 million went to settle stock-based awards
For the first half of 2026, operating cash flow was $27 million, whereas a year earlier it was negative at minus $65 million. The $92 million improvement looks modest against adjusted EBITDA of $847 million for the same period. The reason is a one-off outflow of $495 million to settle stock-based awards, which the company recorded under changes in assets and liabilities.
Without this payment, operating cash flow would have been significantly higher. However, its presence means that a substantial part of earned funds went not to development or debt reduction but to employee compensation. These are one-off payments linked to programme completion, but they directly reduced liquidity in the reporting period.
Capital expenditure for the half-year was $181 million on property, plant and equipment and $66 million on nuclear fuel. The company forecasts 2026 capital expenditure of $330–$340 million, implying an acceleration in the second half. Adjusted free cash flow, as defined by the company, was $562 million for the half-year, but it does not account for the $495 million in share-based payments.
EV/EBITDA LTM of 57.3 against a three-year average of 20.2 — the market is paying for growth not yet confirmed by cash flow
The current enterprise value (EV) to EBITDA for the trailing twelve months is 57.3. This is 2.8 times its own three-year average of 20.2. The gap is explained by the denominator — LTM EBITDA of $361.8 million — including two quarters with negative EBITDA that distort the base. Using the company's 2026 guidance of $2,025–$2,225 million, the multiple would fall to roughly 8–9, but that is a forward-looking figure, not an actual one.
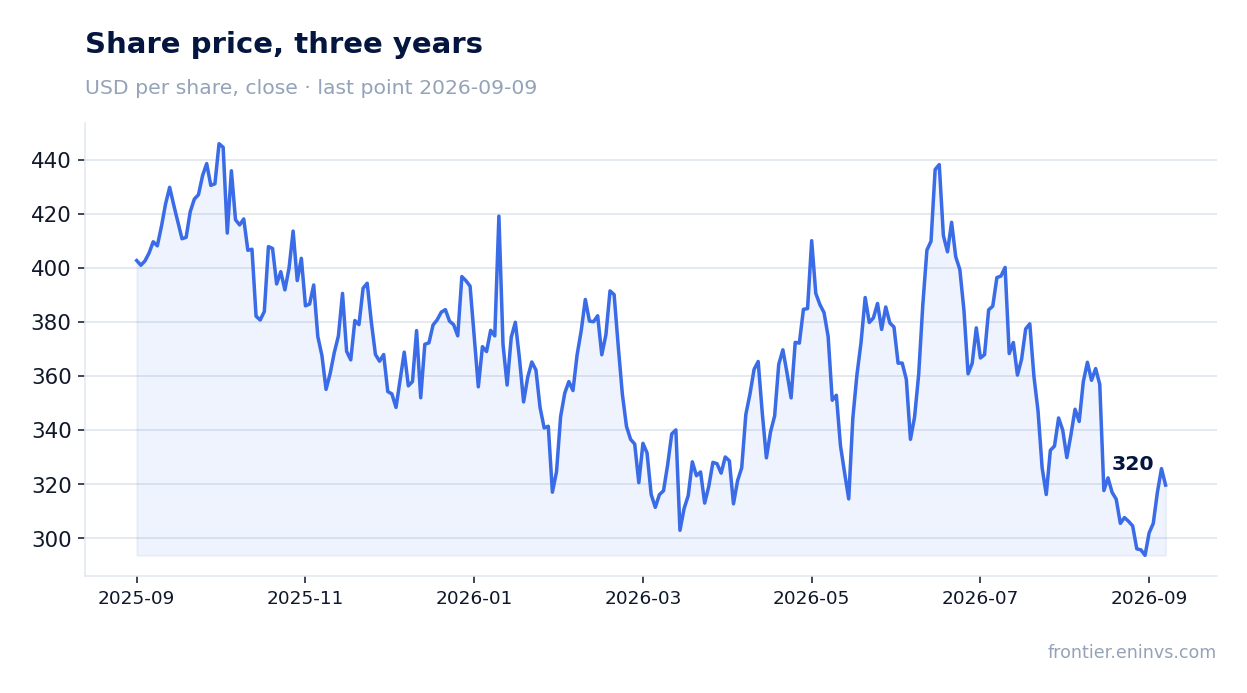
Market capitalisation at the time of the report was $14,605 million, and net debt was $9,341 million, giving an EV of about $23,946 million. The share reacted to the report with a decline: it lost 3.0% on the publication day and 6.0% from the release through September 9, 2026. The market did not believe in the sustainability of adjusted EBITDA without cash flow confirmation.
Return on equity is negative at minus 27.4% due to the loss over the trailing twelve months. This is a direct result of one-off write-downs and higher interest expense. To restore the metric, the company needs not only to grow EBITDA but also to reduce debt, which looks difficult given current capital expenditure and interest payments.
Valuation on the latest reported figures
| Metric | Value |
|---|---|
| Market cap | 14.6 bn USD |
| EV/EBITDA (LTM) | 57.3 |
| P/B | 13.36 |
| Net debt / EBITDA (LTM) | 16.92 |
| Operating cash flow (LTM) | 0.70 bn |
| ROE | -27.4% |
| EV/EBITDA, 3-year average | 20.2 |
Bottom line
The strong point of the report was adjusted EBITDA of $374 million, four times last year's figure, which allowed the company to raise its 2026 guidance. However, the $92 million GAAP loss, net debt rising to $9,341 million and operating cash flow of just $27 million for the half-year show that real money is not yet following operating improvements. The ratio of debt to LTM EBITDA of 16.92 and EV/EBITDA LTM of 57.3 against a three-year average of 20.2 indicate that the market values the share well above its historical norm. The question for a holder now is whether the company can convert growth in generation and capacity revenues into sustainable cash flow sufficient to reduce debt. Until this is confirmed in subsequent reports, the share looks unattractive.
Open the company's financial profile TLN →
See also: market overview · valuation map · stock screeners