Ultra Clean Holdings: revenue up a quarter, but almost none of the profit stayed with the company
On 3 August Ultra Clean Holdings, Inc. reported results for the second quarter of 2026. Revenue rose 24.3% year on year to $644.9 million, operating profit reached $29.5 million, net income was $8.7 million, and the EBITDA margin climbed to 6.5% from negative 25.1% a year earlier. Free cash flow is still negative, debt is rising, and on the portal's model the share trades 5% above fair value – at the current price the stock looks neutral.
Key takeaways
— Revenue added 24.3% year on year, and almost all of the increase came from the Products segment
— The margin improved on a base effect: a year earlier the accounts carried a goodwill impairment loss
— Net income of $8.7 million barely converts into cash: operating cash flow for the quarter was minus $41.1 million
— Debt rose to $520.0 million, and net debt to LTM EBITDA stands at 3.05
— At EV/LTM EBITDA of 33.2 the market is already pricing in strong growth that has to be confirmed
— Third-quarter guidance implies revenue of $700–750 million, above the second quarter
Attractiveness
Key figures, USD bn
| Metric | Q2 2025 | Q2 2026 | Change |
|---|---|---|---|
| Revenue | 0.52 | 0.64 | +24.3% |
| EBITDA | -0.13 | 0.04 | to profit |
| Operating profit | -0.14 | 0.03 | to profit |
| Net profit | -0.16 | 0.01 | to profit |
| Operating cash flow | 0.03 | -0.04 | -240.8% |
| Capex | 0.02 | 0.02 | -3.6% |
| EBITDA margin | -25.1% | 6.5% | +31.6 pp |
| Net margin | -31.2% | 1.3% | +32.5 pp |
Revenue added 24.3% year on year, and almost all of the increase came from the Products segment
In the second quarter of 2026 revenue reached $644.9 million, up 24.3% year on year. That is well above the pace of previous quarters: growth was 2.9% in the first quarter, while in the fourth quarter of 2025 revenue declined 10.0%. The acceleration reflects recovering demand for semiconductor manufacturing equipment, as CEO James Xiao noted.
The Products division made the main contribution: its revenue reached $572.7 million versus $454.9 million a year earlier. Services added $72.2 million versus $63.9 million. Products thus accounted for about 90% of the absolute increase, reflecting strong demand for subassemblies and components.
For the first half of 2026 revenue totalled $1,178.6 million versus $1,037.4 million a year earlier. The company expects third-quarter revenue of $700–750 million, implying further sequential growth.
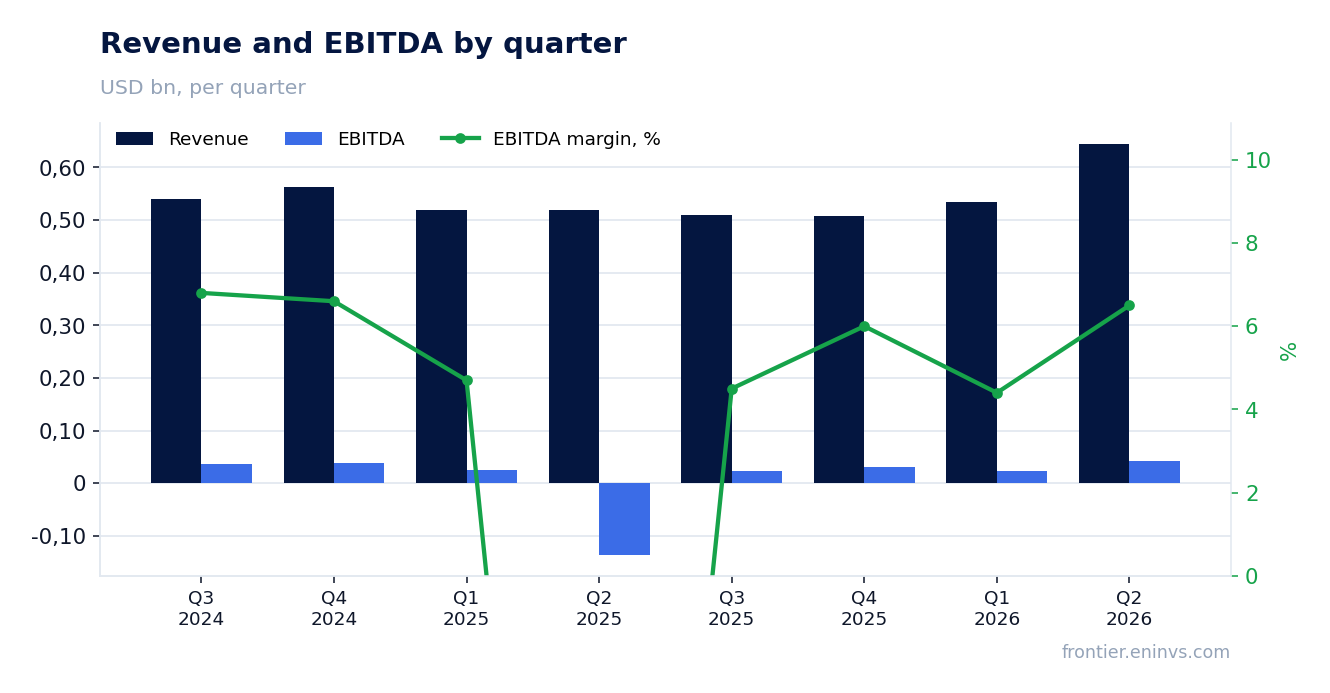
The margin improved on a base effect: a year earlier the accounts carried a goodwill impairment loss
The EBITDA margin in the second quarter of 2026 was 6.5% versus negative 25.1% a year earlier. However, last year's figure was distorted by a one-off charge: in the second quarter of 2025 the company recorded a goodwill impairment of $151.1 million, leading to an operating loss of $141.8 million and a net loss of $162.0 million.
Excluding that charge, the margin a year earlier would have been positive. A more comparable base is the first quarter of 2026, when the EBITDA margin was about 4.4% (calculated: $23.7 million EBITDA on revenue of $533.7 million). Thus there is sequential margin improvement, but it is more modest than the year-on-year comparison suggests.
The report also provides non-GAAP figures: adjusted gross margin 16.7%, adjusted operating margin 7.0%, and adjusted net income of $32.3 million. The difference from GAAP is due to amortisation of intangibles, stock-based compensation, and other one-off items.
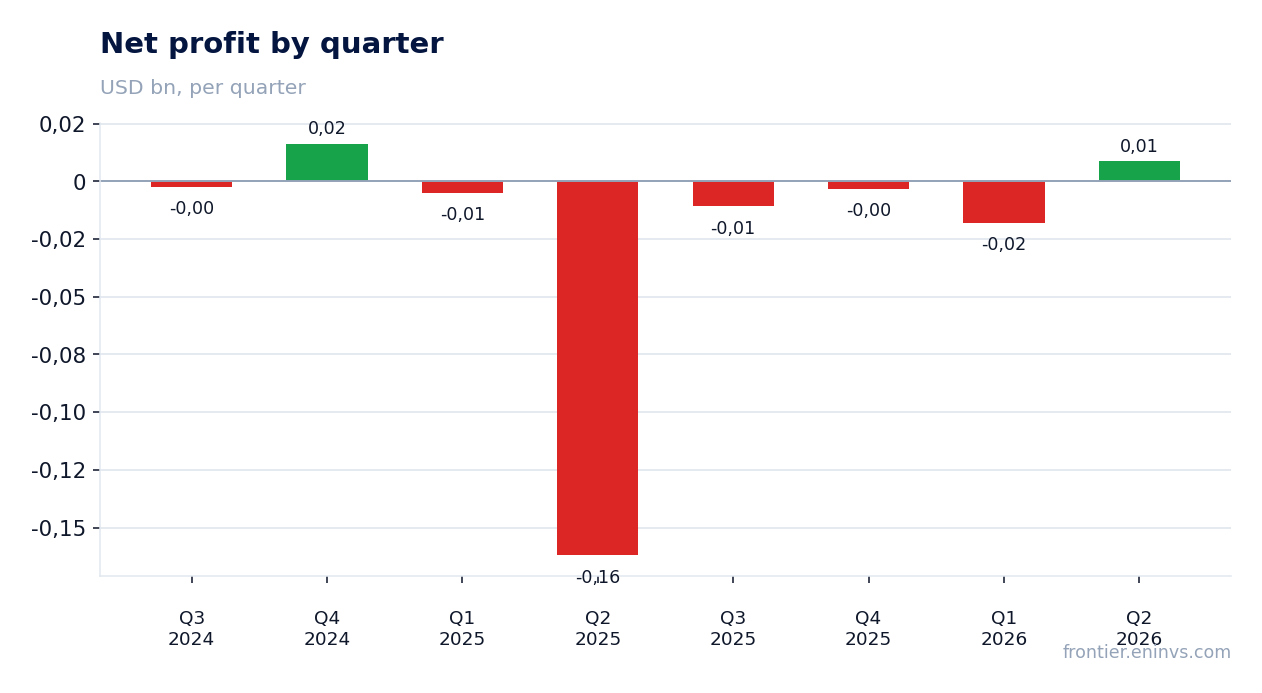
Net income of $8.7 million barely converts into cash: operating cash flow for the quarter was minus $41.1 million
Net income in the second quarter of 2026 was $8.7 million, a margin of 1.3%. A year earlier there was a loss of $162.0 million. However, operating cash flow for the quarter was negative at minus $41.1 million, while capital expenditure was $16.2 million. Free cash flow therefore remains negative.
The negative operating cash flow is explained by inventory growth: in the first half of 2026 inventories rose by $238.9 million (from $390.9 million at the end of 2025 to $629.9 million at the end of June 2026). This reflects production ramp-up for expected demand growth. At the same time, accounts payable increased by $104.4 million, partially financing this growth.
For the first half of 2026 operating cash flow was minus $74.4 million versus plus $57.4 million a year earlier. The company is not yet generating enough cash to self-finance, forcing it to raise debt.
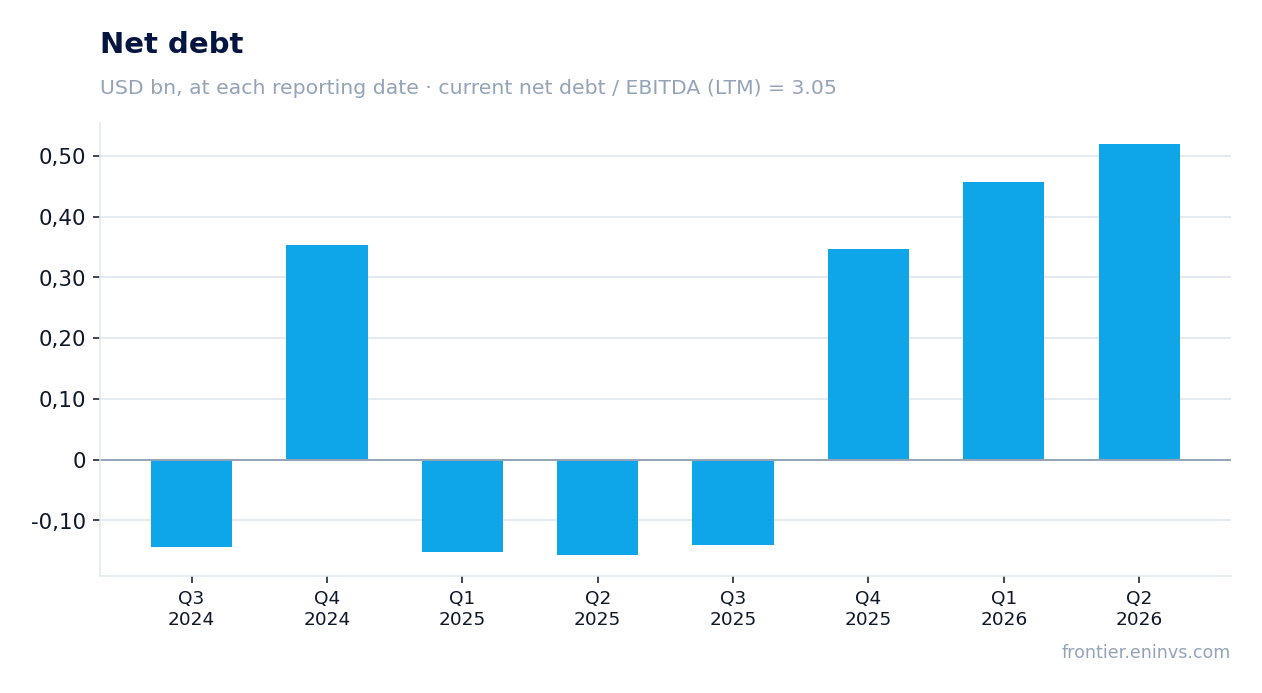
Debt rose to $520.0 million, and net debt to LTM EBITDA stands at 3.05
Net debt at the end of the second quarter of 2026 was $520.0 million versus $346.4 million at the end of 2025. The increase is due to the issuance of $600 million in convertible notes and repayment of bank borrowings of $481.5 million. The ratio of net debt to LTM EBITDA stands at 3.05.
The figure 3.05 is a level, not a direction: the previous value of this ratio is not in the provided data, so it cannot be said that leverage rose or fell. However, absolute debt increased, which matters for risk assessment.
Interest expense in the second quarter of 2026 was $1.1 million versus $10.1 million a year earlier. The decline reflects debt refinancing: the company repaid more expensive bank borrowings and issued convertible notes. This reduces the current debt burden on profit.
At EV/LTM EBITDA of 33.2 the market is already pricing in strong growth that has to be confirmed
EV/LTM EBITDA stands at 33.2. This is a high multiple, reflecting market expectations for future growth. For comparison, the FACTS do not provide a historical average for this multiple, so it cannot be said whether the current valuation is above or below its own history.
Market capitalisation at the time of the report was $3,412.5 million. According to the portal's model, fair value is 5% below the current price. This means the market has already priced in a significant portion of future growth, and further share price gains require the company to confirm its forecasts.
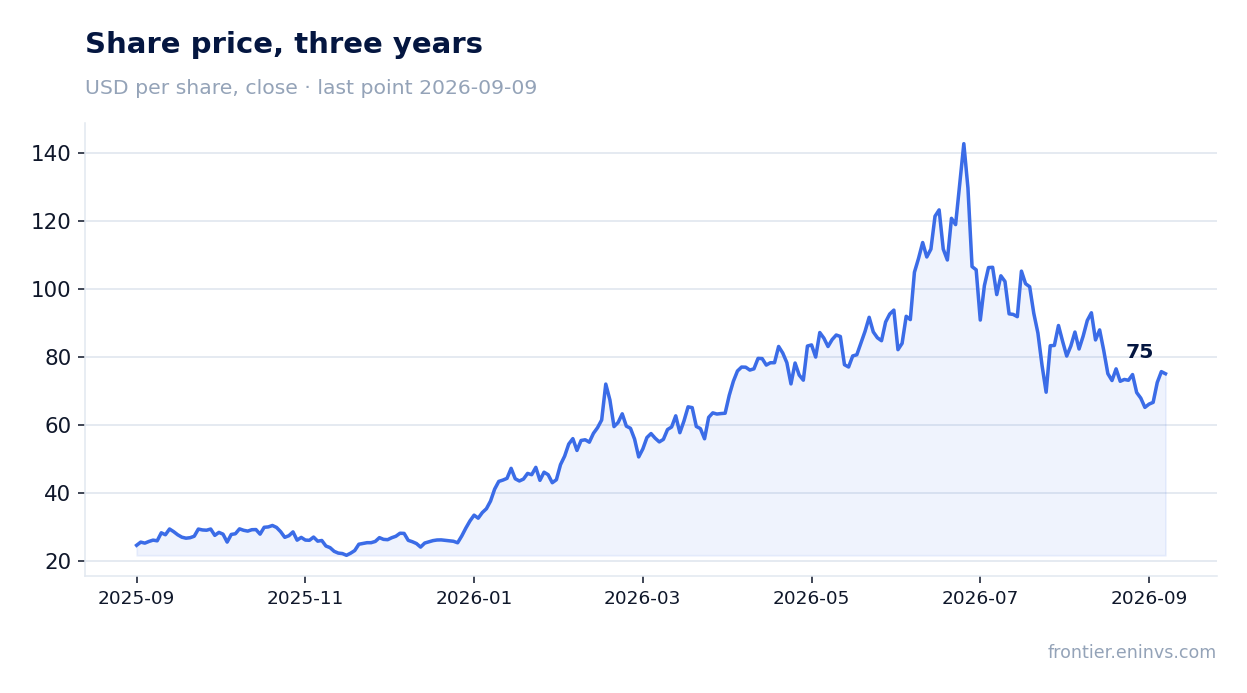
The share price rose 7.0% on the day the report was published, but from the release to 9 September 2026 it fell 10.0%. This suggests initial optimism gave way to caution.
Third-quarter guidance implies revenue of $700–750 million, above the second quarter
The company expects third-quarter 2026 revenue of $700–750 million. This is above the actual second-quarter result of $644.9 million. The guidance reflects expectations of further growth in demand for semiconductor equipment.
GAAP diluted earnings per share are expected in the range of $0.67–0.87, and non-GAAP in the range of $0.83–1.03. For comparison, in the second quarter GAAP EPS was $0.19, and non-GAAP EPS was $0.70. The guidance implies a substantial improvement in profitability.
The key question is whether the company can convert this growth into cash flow. In the first half, operating cash flow was negative, and if inventories continue to grow at the same pace, debt burden may increase.
Valuation on the latest reported figures
| Metric | Value |
|---|---|
| Market cap | 3.41 bn USD |
| EV/EBITDA (LTM) | 33.2 |
| P/B | 4.80 |
| Net debt / EBITDA (LTM) | 3.05 |
| Operating cash flow (LTM) | 0.07 bn |
| ROE | 5.5% |
Bottom line
The strong side of the report is the return to revenue growth of 24.3% and margin improvement, although the latter is largely explained by a base effect from last year's goodwill impairment. Net income of $8.7 million is not yet converting into cash: operating cash flow is negative, and debt has risen to $520.0 million. The EV/LTM EBITDA valuation of 33.2 implies the market is already pricing in significant growth, and on the portal's model the share trades 5% above fair value. For a holder, the key question is whether the company can confirm third-quarter guidance and improve the conversion of profit into cash flow.
Open the company's financial profile UCTT →
See also: market overview · valuation map · stock screeners