WESCO INTERNATIONAL INC: record sales and profit, but cash flow is half of last year's

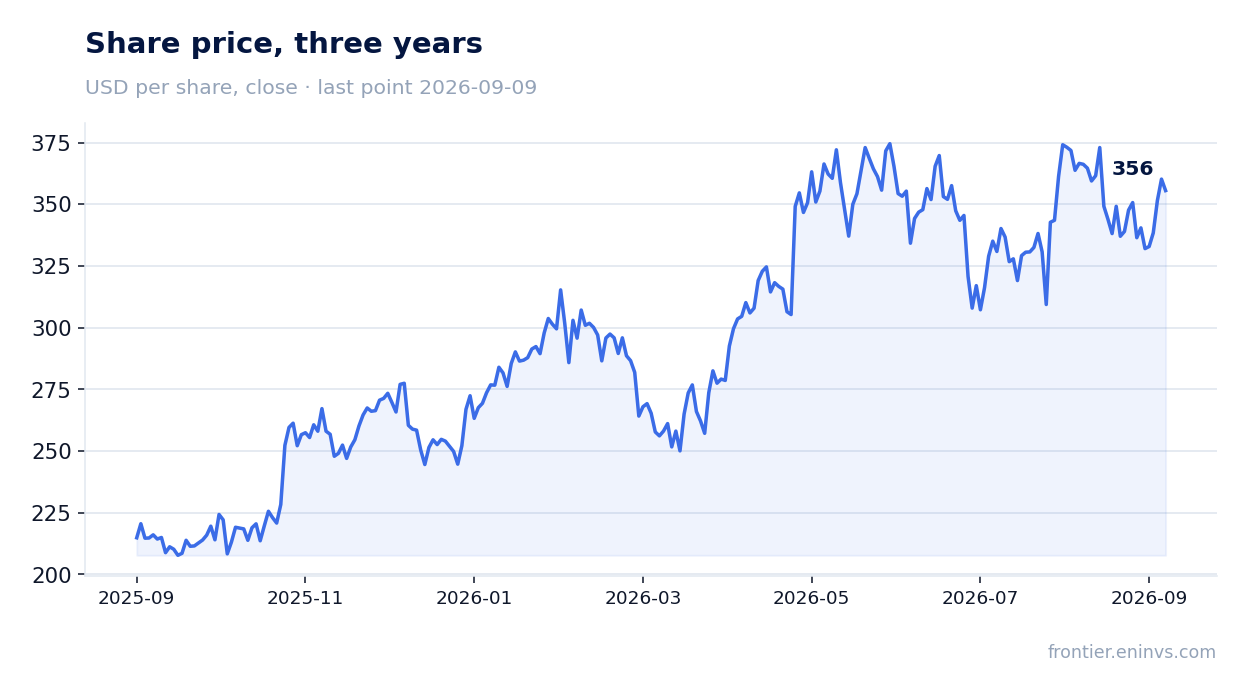
On July 30, WESCO INTERNATIONAL INC reported second-quarter 2026 results. Revenue rose 13.0% year on year to $6,665.1 million, EBITDA added 13.4%, and net profit was up 19.8% to $209.0 million. Operating cash flow, however, came in at $53.7 million against $107.8 million a year earlier. At $309.36 before the release, the share looks attractive: the EV/EBITDA multiple of 14.2x is above its own three-year average of 10.5x, but the portal's model implies 32% upside to fair value.
Key takeaways
— Revenue rose 13.0% year on year to $6,665.1 million, with almost all of the gain organic
— Earnings per share rose 34.8% to $4.57, but included $23.2 million of one-off digital transformation costs
— EBITDA margin rose to 7.3% from 6.7% a year earlier, the best level in recent quarters
— Operating cash flow halved to $53.7 million on higher receivables and supplier prepayments
— Net debt stands at $5,506.0 million, or 3.74x trailing-twelve-month EBITDA
— Dividend yield of 0.54% is low for the company's history, but the payout ratio is low and the payment can grow
— EV/EBITDA of 14.2x is above its own three-year average of 10.5x, the main argument against buying
Attractiveness
Key figures, USD bn
| Metric | Q2 2025 | Q2 2026 | Change |
|---|---|---|---|
| Revenue | 5.90 | 6.67 | +13.0% |
| EBITDA | 0.37 | 0.42 | +13.4% |
| Operating profit | 0.32 | 0.38 | +18.6% |
| Net profit | 0.17 | 0.21 | +19.8% |
| Operating cash flow | 0.11 | 0.25 | +131.9% |
| Capex | 0.02 | 0.03 | +29.4% |
| EBITDA margin | 6.3% | 6.3% | +0.0 pp |
| Net margin | 3.0% | 3.1% | +0.1 pp |
Revenue rose 13.0% year on year to $6,665.1 million, with almost all of the gain organic
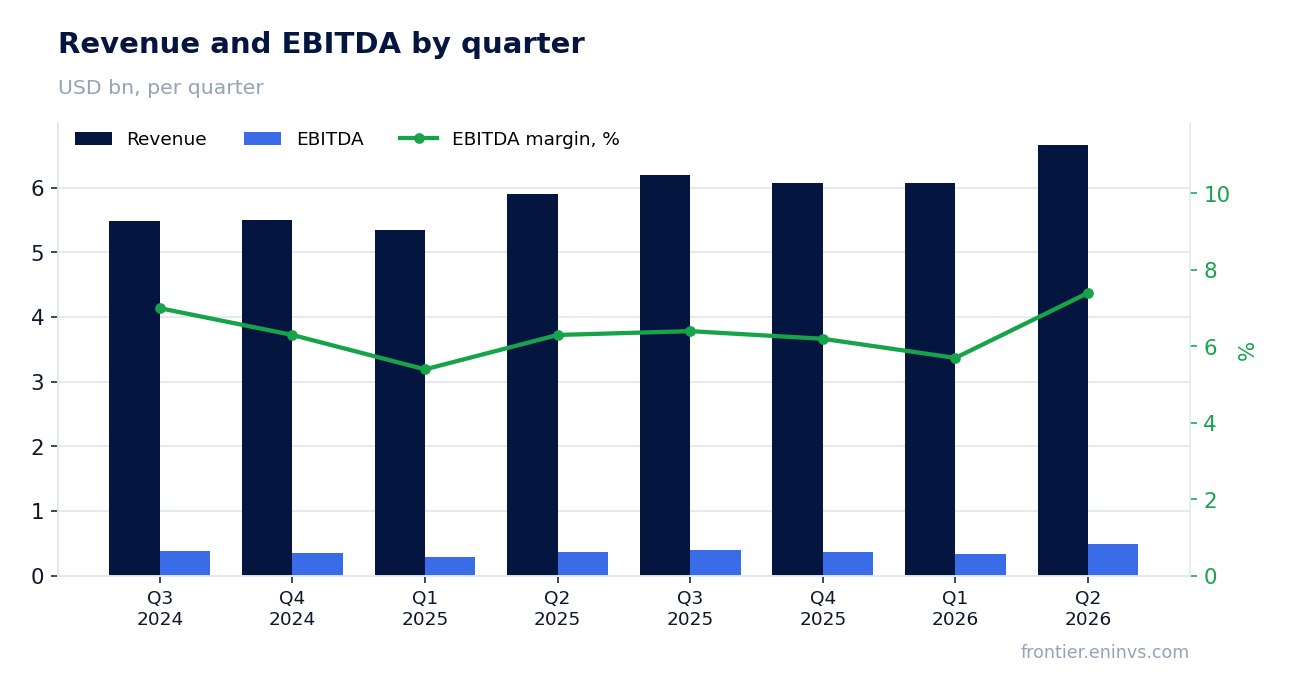
In the second quarter of 2026, revenue reached $6,665.1 million, up 13.0% year on year. Organic growth was 12.6% – almost all of the dynamics came from volumes and prices, not acquisitions. This is the fourth consecutive quarter of double-digit sales growth.
The main contribution came from the CSS segment (communications and security): its sales rose 18.4% to $2,681.2 million. The EES segment (electrical) added 11.2% to $2,510.7 million, and UBS (utility and broadband) rose 7.0% to $1,473.2 million. Data center sales reached $1.5 billion, up about 45% year on year.
Backlog grew by approximately 60% year on year to a record level. The company attributes this to multi-year contracts with large customers, including a new UBS award from a hyperscale data center customer. This creates a base for revenue growth in the coming quarters.
Earnings per share rose 34.8% to $4.57, but included $23.2 million of one-off digital transformation costs
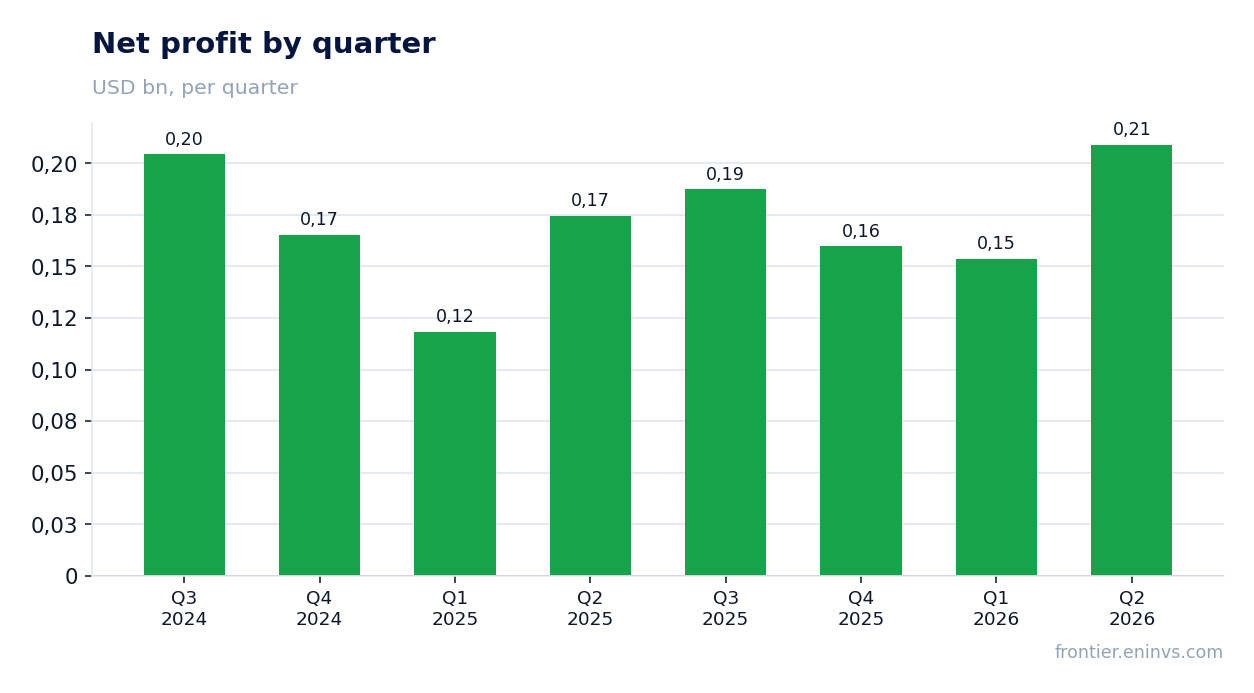
Adjusted earnings per share came in at $4.57, up 34.8% from $3.39 a year earlier. Adjusted EBITDA rose 23.6% to $487.2 million. However, reported profit included $23.2 million of digital transformation costs, up from $7.6 million a year earlier. Without them, adjusted profit would have been lower.
Profit growth was also supported by a lower effective tax rate – 22.9% versus 26.1% a year earlier. The decline is due to larger one-off tax benefits from stock-based awards. This is a one-off factor unlikely to repeat in the coming quarters.
Operating profit rose 18.6% to $382.2 million, but the operating margin only edged up to 5.7% from 5.5%. The main driver of EPS growth was not operating efficiency but tax and one-off items.
EBITDA margin rose to 7.3% from 6.7% a year earlier, the best level in recent quarters
Adjusted EBITDA margin in the second quarter of 2026 was 7.3%, up 60 basis points from a year earlier. This is the best level in at least four quarters: in the first quarter of 2026 the margin was 6.4%, and in the fourth quarter of 2025 it was about 6.2%.
The margin improvement was driven by gross margin rising to 21.8% from 21.1%. The company attributes this to better margins in the EES and CSS segments, partly offset by a decline in UBS. Gross profit rose 17.2% to $1,456.0 million.
A limiting factor remains SG&A expenses, which rose 17.3% to $1,022.7 million. Excluding digital transformation costs, they were 15.0% of revenue versus 14.6% a year earlier. The increase is due to commissions and incentives on strong performance, as well as higher salaries.
Operating cash flow halved to $53.7 million on higher receivables and supplier prepayments
Operating cash flow in the second quarter of 2026 was $53.7 million versus $107.8 million a year earlier – a 50.2% decline. The main reason was a $182.8 million increase in trade receivables due to higher sales across all segments and the timing of customer receipts, as well as a $155.3 million increase in other assets from supplier prepayments.
The decline was partly offset by growth in accounts payable and other liabilities, including higher deferred revenue. But this was not enough to keep cash flow at last year's level. Free cash flow was $32.3 million versus $86.5 million a year earlier.
For the first half of 2026, operating cash flow more than doubled to $275.1 million from $135.8 million. This suggests the quarterly decline may be due to seasonality and payment timing rather than deteriorating earnings quality. Nevertheless, cash conversion remains low.
Net debt stands at $5,506.0 million, or 3.74x trailing-twelve-month EBITDA
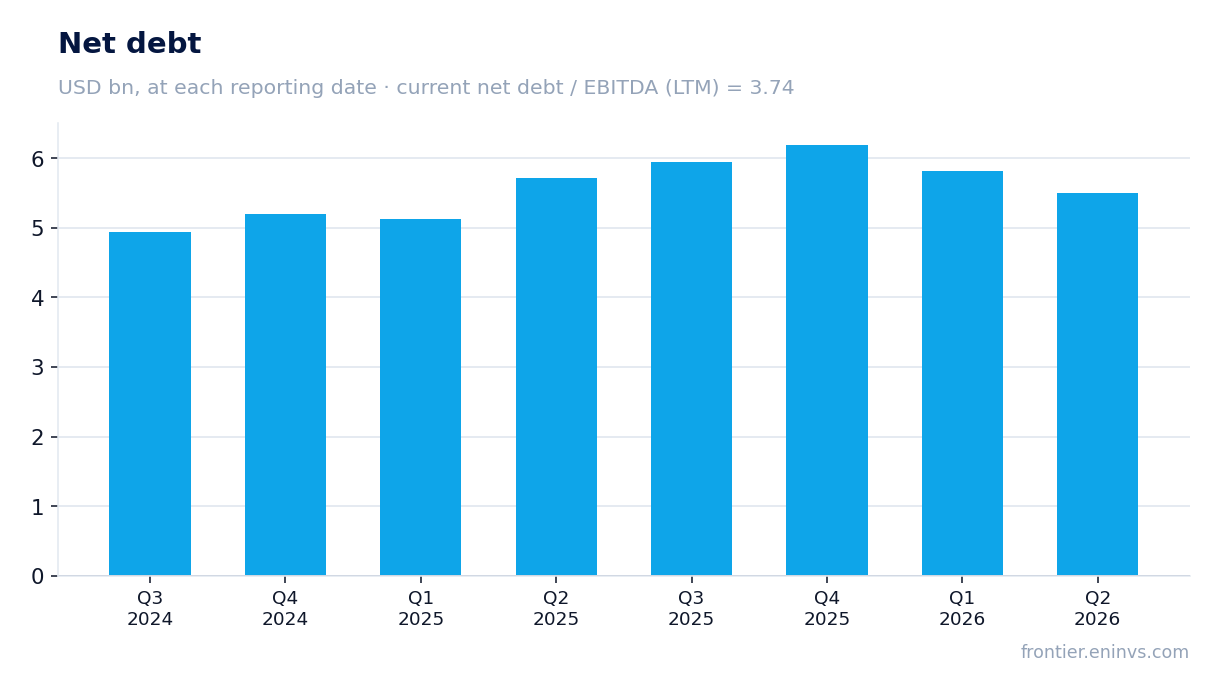
Net debt at the end of the second quarter of 2026 was $5,506.0 million, down $0.3 billion from the previous reporting date and $0.2 billion less than a year earlier. The net debt to trailing-twelve-month EBITDA ratio is 3.74x. This is a moderate level for a distributor, but it limits the capacity for large acquisitions.
The company is actively managing its debt portfolio: in the first half of 2026 it issued $650 million of 5.25% notes due 2031 and $850 million of 5.5% notes due 2034, and redeemed $1,325 million of 7.25% notes due 2028. This reduces future interest expenses, but in the reported quarter interest expense rose by $17.5 million due to a higher debt level.
The net debt to EBITDA ratio of 3.74x is a level the company likely considers comfortable, but it is higher than many peers. Further deleveraging depends on the ability to generate cash flow, which was weak this quarter.
Dividend yield of 0.54% is low for the company's history, but the payout ratio is low and the payment can grow
The trailing twelve-month dividend yield is 0.54% at a price of $309.36. The company paid $48.8 million in dividends in the first half of 2026. This is a small amount relative to trailing-twelve-month net profit of $710.1 million, implying a payout ratio of about 7%.
Our estimate: the dividend could be raised for full-year 2026, as the company generates stable profit and has a low payout ratio. However, the decision depends on the board and may be adjusted for capital needs for acquisitions and debt reduction.
The 0.54% yield is well below the key rate, making the stock unattractive for income-oriented investors. But for a company with a growing business and capital appreciation potential, this is normal. The main risk is that if cash flow remains weak, the company may prefer to reduce debt rather than pay dividends.
EV/EBITDA of 14.2x is above its own three-year average of 10.5x, the main argument against buying
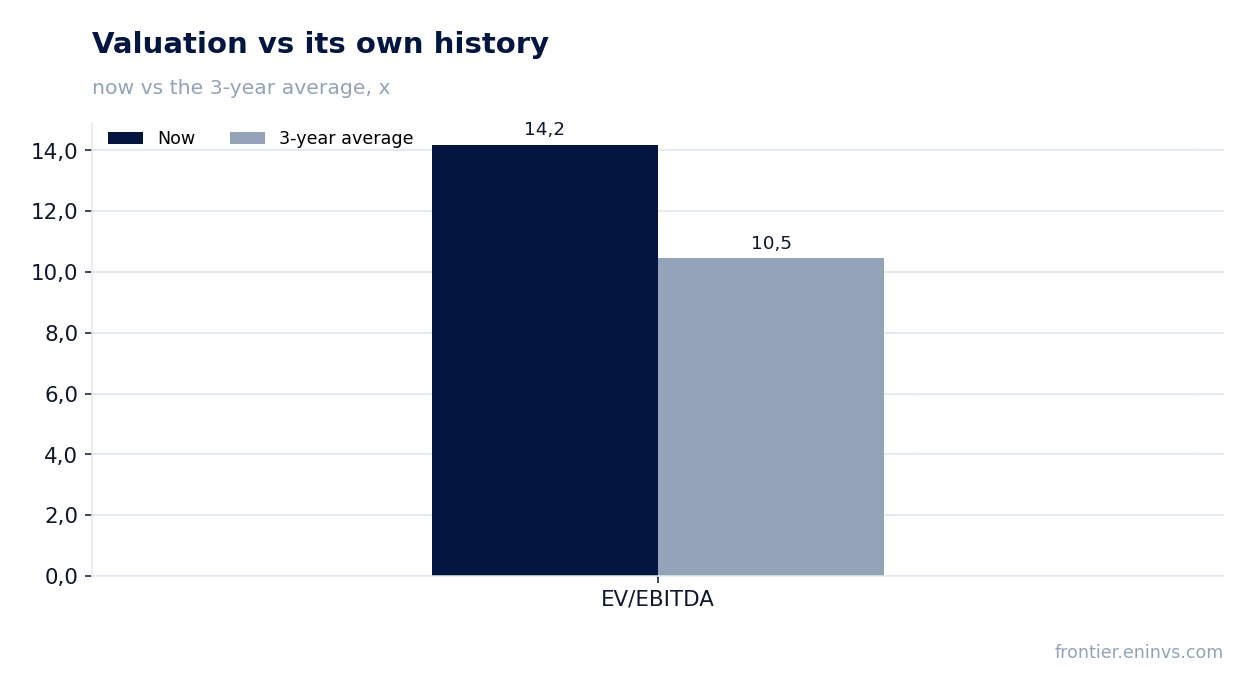
The trailing-twelve-month EV/EBITDA multiple is 14.2x. This is well above its own three-year average of 10.5x. The stock trades at a premium to its history, reflecting market expectations for business growth, especially in data centers.
The trailing-twelve-month P/E is 24.4x. ROE is 16.2%, which is decent for a distributor. However, if growth slows or the margin fails to hold at the achieved level, the multiple could compress to historical values, putting pressure on the share price.
The portal's model values the share at 32% above the current price. This is our own calculation, based on EBITDA growth and a target multiple. It assumes the market will eventually appreciate the sustainability of growth and margin improvement. But if the company cannot maintain double-digit revenue growth, the upside may not materialize.
Valuation on the latest reported figures
| Metric | Value |
|---|---|
| Market cap | 17.3 bn USD |
| P/E (LTM) | 24.4 |
| EV/EBITDA (LTM) | 14.2 |
| P/B | 3.44 |
| Net debt / EBITDA (LTM) | 3.74 |
| Operating cash flow (LTM) | 0.12 bn |
| ROE | 16.2% |
| Dividend yield (12m) | 0.5% |
| EV/EBITDA, 3-year average | 10.5 |
Bottom line
WESCO INTERNATIONAL INC delivered a strong quarter: revenue and EPS hit records, EBITDA margin improved to 7.3%, and backlog grew 60%. However, operating cash flow halved, and profit growth was partly driven by one-off tax benefits and digital transformation costs. Leverage at 3.74x EBITDA is moderate but limits flexibility. The stock trades at a premium to its history – EV/EBITDA of 14.2x versus the 10.5x average – already pricing in high expectations. Yet the portal's model implies 32% upside, which outweighs the premium valuation risk. Verdict: the share is attractive for investors willing to tolerate volatility and bet on continued data center growth.
Open the company's financial profile WCC →
See also: market overview · valuation map · stock screeners