W&T Offshore: profit returned, but hedging marks, not production, made it
On 5 August W&T Offshore, Inc. released its second-quarter 2026 results. Revenue rose 32.9% year on year to USD 162.6 million, adjusted EBITDA jumped 254.8% to USD 54.4 million, and the company posted net income of USD 12.6 million after several loss-making quarters. Most of that result, however, rests on higher oil prices and a one-off mark on derivatives rather than on volumes: production added just 3%, to 34.7 thousand barrels of oil equivalent per day. With an EV/EBITDA of 6.9 and a negative fair-value reading from the portal's model, the share looks neutral – the profit recovery is real but does not yet translate into durable cash flow.
Key takeaways
— Revenue rose 32.9% year on year, but almost all of the gain came from oil prices, not volumes
— EBITDA margin climbed to 29.7% on higher realised prices and lower lease operating expenses
— Net income of USD 12.6 million owes much to a one-off USD 11.8 million mark on derivatives
— Adjusted EBITDA of USD 54.4 million is double last year's level, yet free cash flow remains modest
— Leverage at 1.88x LTM EBITDA is moderate, and net debt fell to USD 202.7 million
— The dividend of USD 0.01 per share has been paid for eleven straight quarters, but yields under 1%
— An EV/EBITDA of 6.9 and negative upside from the portal's model offer little reason for optimism
Attractiveness
Key figures, USD bn
| Metric | Q2 2025 | Q2 2026 | Change |
|---|---|---|---|
| Revenue | 0.12 | 0.16 | +32.9% |
| EBITDA | 0.01 | 0.05 | +254.8% |
| Operating profit | -0.01 | 0.02 | to profit |
| Net profit | -0.02 | 0.01 | to profit |
| Operating cash flow | 0.03 | 0.03 | +19.1% |
| Capex | 0.00 | 0.01 | +2675.2% |
| EBITDA margin | 11.1% | 29.7% | +18.6 pp |
| Net margin | -17.1% | 7.7% | +24.8 pp |
Revenue rose 32.9% year on year, but almost all of the gain came from oil prices, not volumes
In the second quarter of 2026 revenue reached USD 162.6 million, up 32.9% year on year. Production, however, rose only 3%, to 34.7 thousand barrels of oil equivalent per day – physical volumes barely changed. The main driver was price: the average realised oil price climbed to USD 99.30 per barrel from USD 63.55 a year earlier, and the oil-equivalent price to USD 50.23 per barrel.
Oil revenue reached USD 120.5 million, up from USD 80.0 million a year earlier. Gas revenue, by contrast, fell to USD 32.1 million from USD 34.8 million as the gas price dropped to USD 3.31 per thousand cubic feet. The top-line growth therefore rests entirely on the oil segment, while gas remains the weak link.
The company guided third-quarter production to 33.3–36.8 thousand barrels of oil equivalent per day, implying a slight increase from the second quarter. Without further oil-price gains, revenue is unlikely to repeat such strong dynamics.
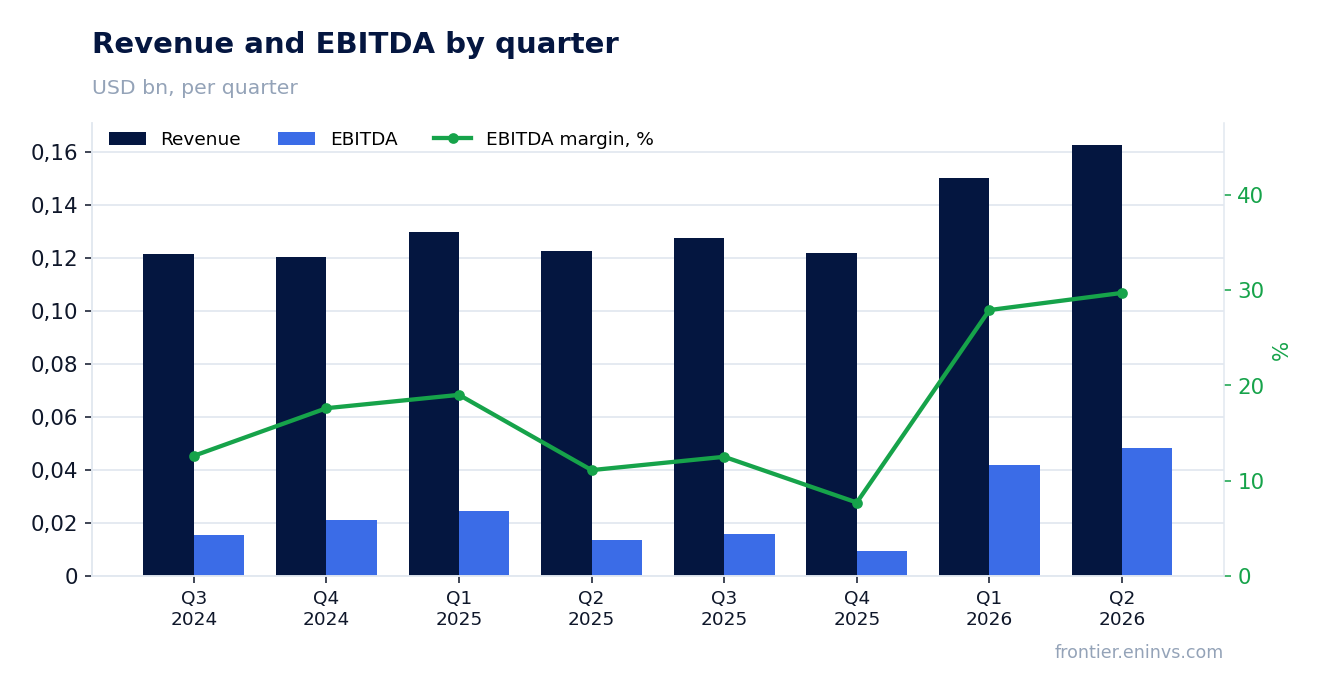
EBITDA margin climbed to 29.7% on higher realised prices and lower lease operating expenses
The EBITDA margin in the second quarter of 2026 was 29.7% versus 11.1% a year earlier. The increase stems not only from oil prices but also from lower unit costs: lease operating expenses fell to USD 22.67 per barrel of oil equivalent from USD 25.20 a year earlier. The company notes that part of the savings came from deferring some work to the third quarter.
Adjusted general and administrative expenses fell 5% quarter on quarter to USD 16.4 million, also supporting the margin. However, total G&A rose 56% year on year to USD 27.5 million due to non-cash share-based compensation tied to the share price.
As a result, adjusted EBITDA reached USD 54.4 million, up 54% from a year earlier. This is a notable operating achievement, but it depends heavily on oil prices, which remain volatile.
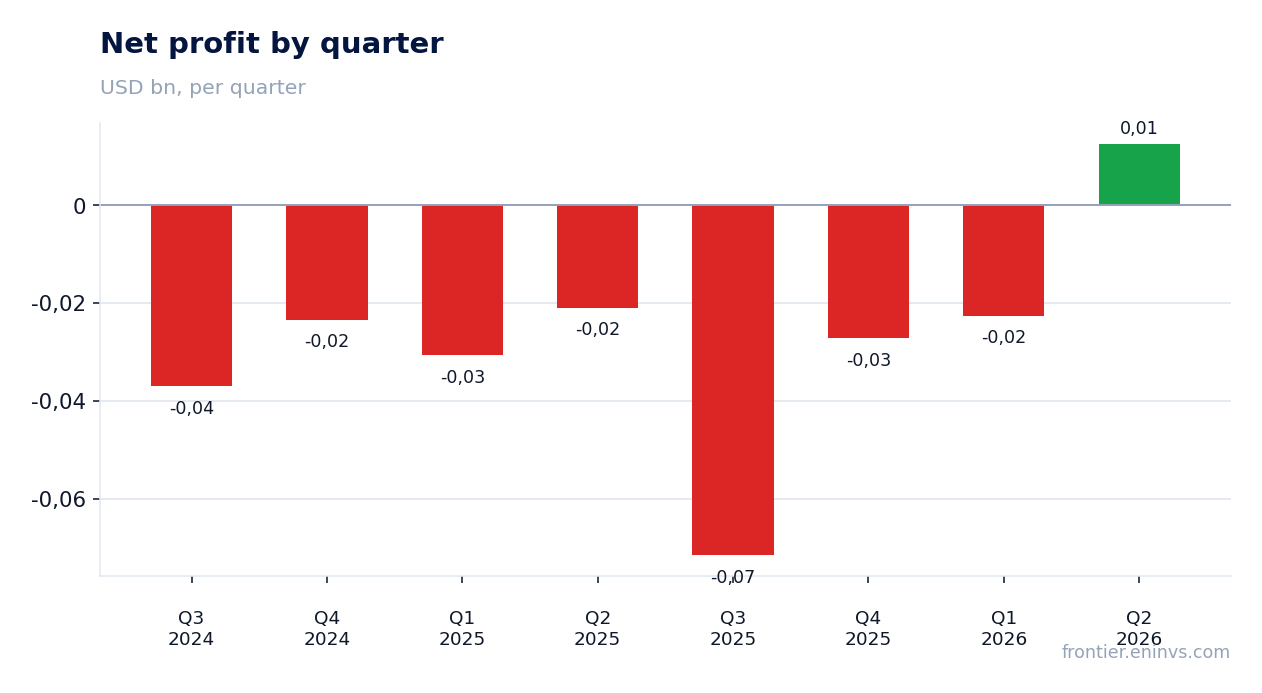
Net income of USD 12.6 million owes much to a one-off USD 11.8 million mark on derivatives
Net income in the second quarter of 2026 was USD 12.6 million versus a loss of USD 20.9 million a year earlier. Much of that result, however, is non-operational: an unrealised gain on derivatives of USD 11.8 million, compared with a USD 2.6 million gain a year earlier. Without this mark, profit would have been significantly lower.
Adjusted net income, which excludes one-off items, was only USD 3.5 million, or USD 0.02 per share, versus a loss of USD 11.8 million a year earlier. This shows that sustainable profitability remains modest.
Operating income turned positive for the first time in a while, at USD 22.6 million versus a loss of USD 12.9 million a year earlier. But the gap between operating and net income is driven by USD 9.2 million in interest expense and taxes.
Adjusted EBITDA of USD 54.4 million is double last year's level, yet free cash flow remains modest
Adjusted EBITDA in the second quarter of 2026 was USD 54.4 million, up 54% from a year earlier. Operating cash flow, however, was only USD 33.3 million, and free cash flow was USD 31.4 million, up 50% from the first quarter but still modest relative to EBITDA.
The gap between EBITDA and cash flow is explained by high interest expense (USD 9.2 million), derivative settlements (USD 13.8 million), and plugging and abandonment costs (USD 3.4 million). The company also spent USD 10.4 million on capital expenditures.
Nevertheless, free cash flow rose to USD 31.4 million from USD 3.6 million a year earlier, allowing cash to increase to USD 150.7 million. This provides some financial flexibility but does not solve the dependence on oil prices.
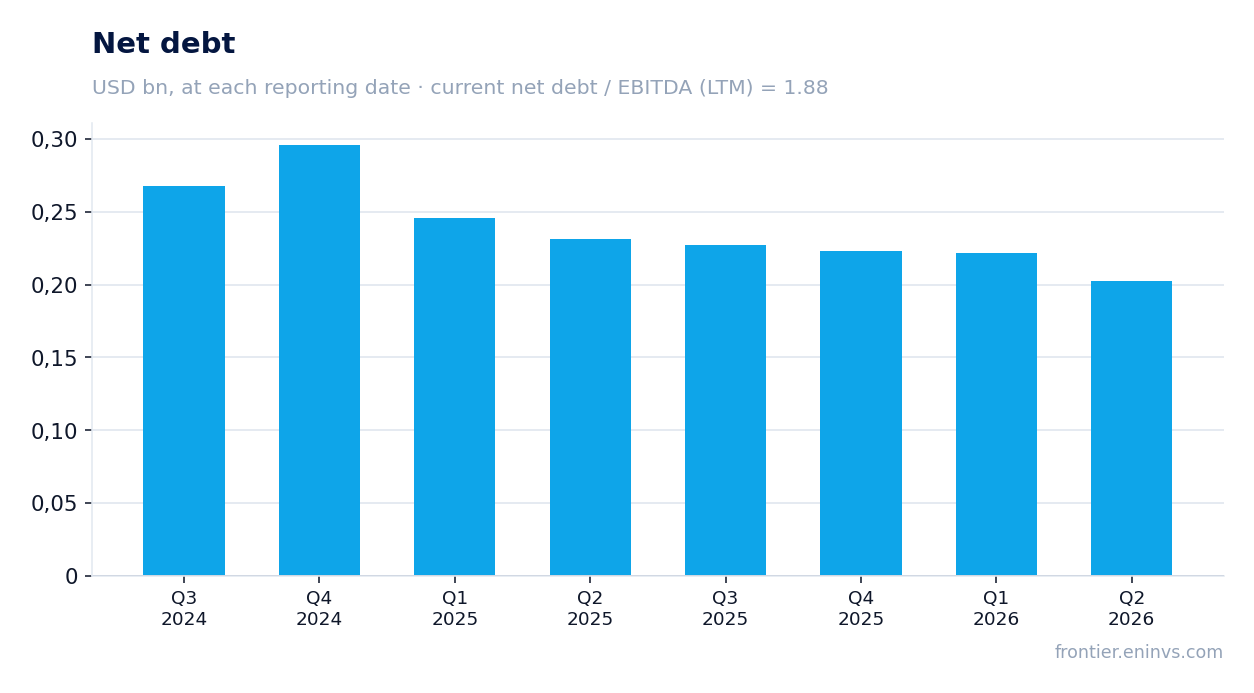
Leverage at 1.88x LTM EBITDA is moderate, and net debt fell to USD 202.7 million
Net debt at the end of the second quarter of 2026 was USD 202.7 million, down from USD 223.1 million at the end of the first quarter. The ratio of net debt to trailing twelve-month EBITDA is 1.88. This is a moderate level, although the company does not disclose the previous value of this ratio, so no conclusion can be drawn about the direction of leverage.
Total debt stands at USD 351.6 million, of which USD 8.2 million is short-term. Interest expense in the second quarter was USD 9.2 million, comparable to operating income of USD 22.6 million. Debt servicing remains a significant burden.
The company holds USD 150.7 million in cash and has available liquidity of USD 194.1 million, including USD 43.4 million under its revolving credit facility. This is sufficient to cover current obligations but not for large acquisitions without additional financing.
The dividend of USD 0.01 per share has been paid for eleven straight quarters, but yields under 1%
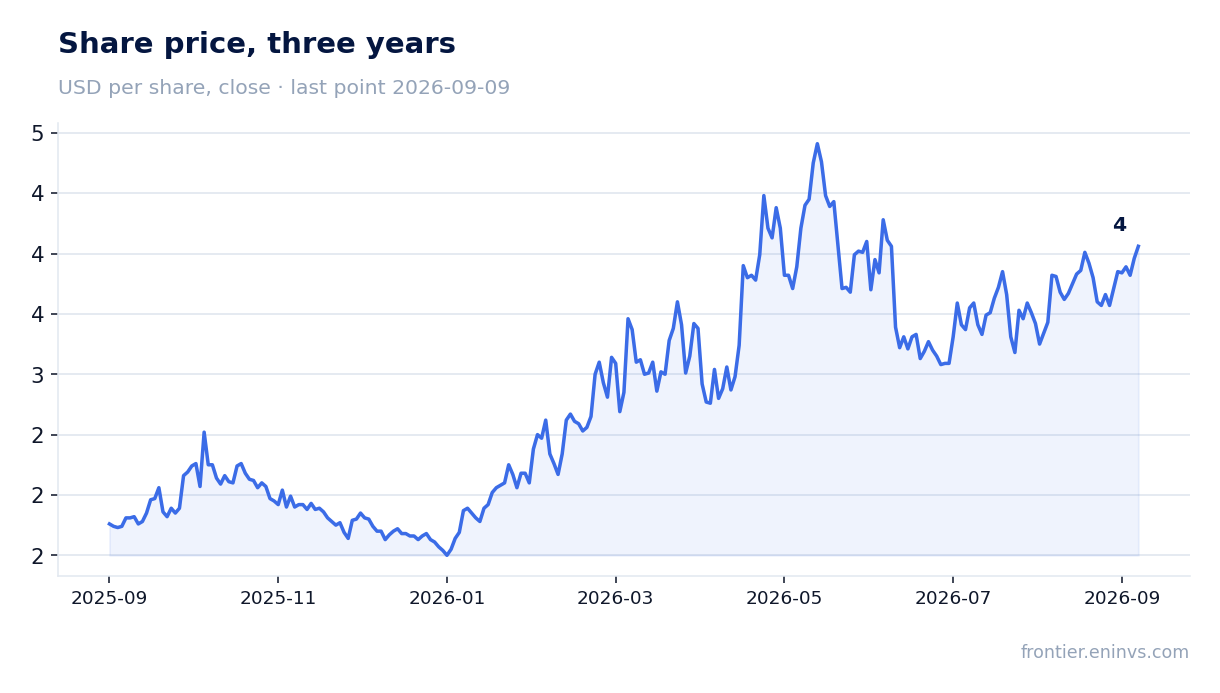
The board declared a third-quarter 2026 dividend of USD 0.01 per share, payable on 26 August 2026. This is the eleventh consecutive quarterly dividend, and the company reaffirms its commitment to payouts. However, at a share price of about USD 3.42, the yield is less than 1%.
Our estimate for the full-year 2026 dividend is USD 0.04 per share, based on the current policy. That implies a yield of about 1.2% at the current price. The payout is covered by adjusted net income but not by free cash flow, which is volatile.
The dividend is not a major factor in the investment case: its size is symbolic and does not compensate for the risks associated with oil-price volatility. Higher payouts would require sustained growth in profit and cash flow.
An EV/EBITDA of 6.9 and negative upside from the portal's model offer little reason for optimism
The trailing twelve-month EV/EBITDA multiple is 6.9. This is a low level by historical standards, but we lack data on the three-year average to judge whether the stock is cheap or expensive relative to its own history. At the same time, ROE reaches 42.8%, reflecting a low equity base due to an accumulated deficit.
According to the portal's model, which re-prices EBITDA at current commodity prices against a target EV/EBITDA, the upside to fair value is negative 84%. This is our own estimate, not a market consensus, and it suggests the current price may be inflated relative to fundamental value.
Since the release, the share has risen 18.7%, while it fell 5.0% on the release day. The market reacted to strong operating results but may be underestimating the one-off nature of the profit. With a neutral verdict, we see no sustainable driver for further gains.
Valuation on the latest reported figures
| Metric | Value |
|---|---|
| Market cap | 0.60 bn USD |
| EV/EBITDA (LTM) | 6.9 |
| Net debt / EBITDA (LTM) | 1.88 |
| Operating cash flow (LTM) | 0.08 bn |
| ROE | 42.8% |
| Dividend yield (12m) | 1.0% |
Bottom line
Bottom line: in the second quarter of 2026 W&T Offshore delivered strong revenue and EBITDA growth, but that growth was driven mainly by oil prices and a one-off mark on derivatives. Sustainable profitability remains modest, free cash flow is volatile, and the dividend yield is below 1%. Leverage is moderate, but debt servicing consumes a significant portion of operating income. With an EV/EBITDA of 6.9 and negative upside from the portal's model, the share looks neutral: the current price already reflects the profit recovery but offers no margin of safety if oil prices decline.
Open the company's financial profile WTI →
See also: market overview · valuation map · stock screeners