Aspen: ZAR 2.65bn profit on a 19.6% revenue decline – the gap between the income statement and cash flow
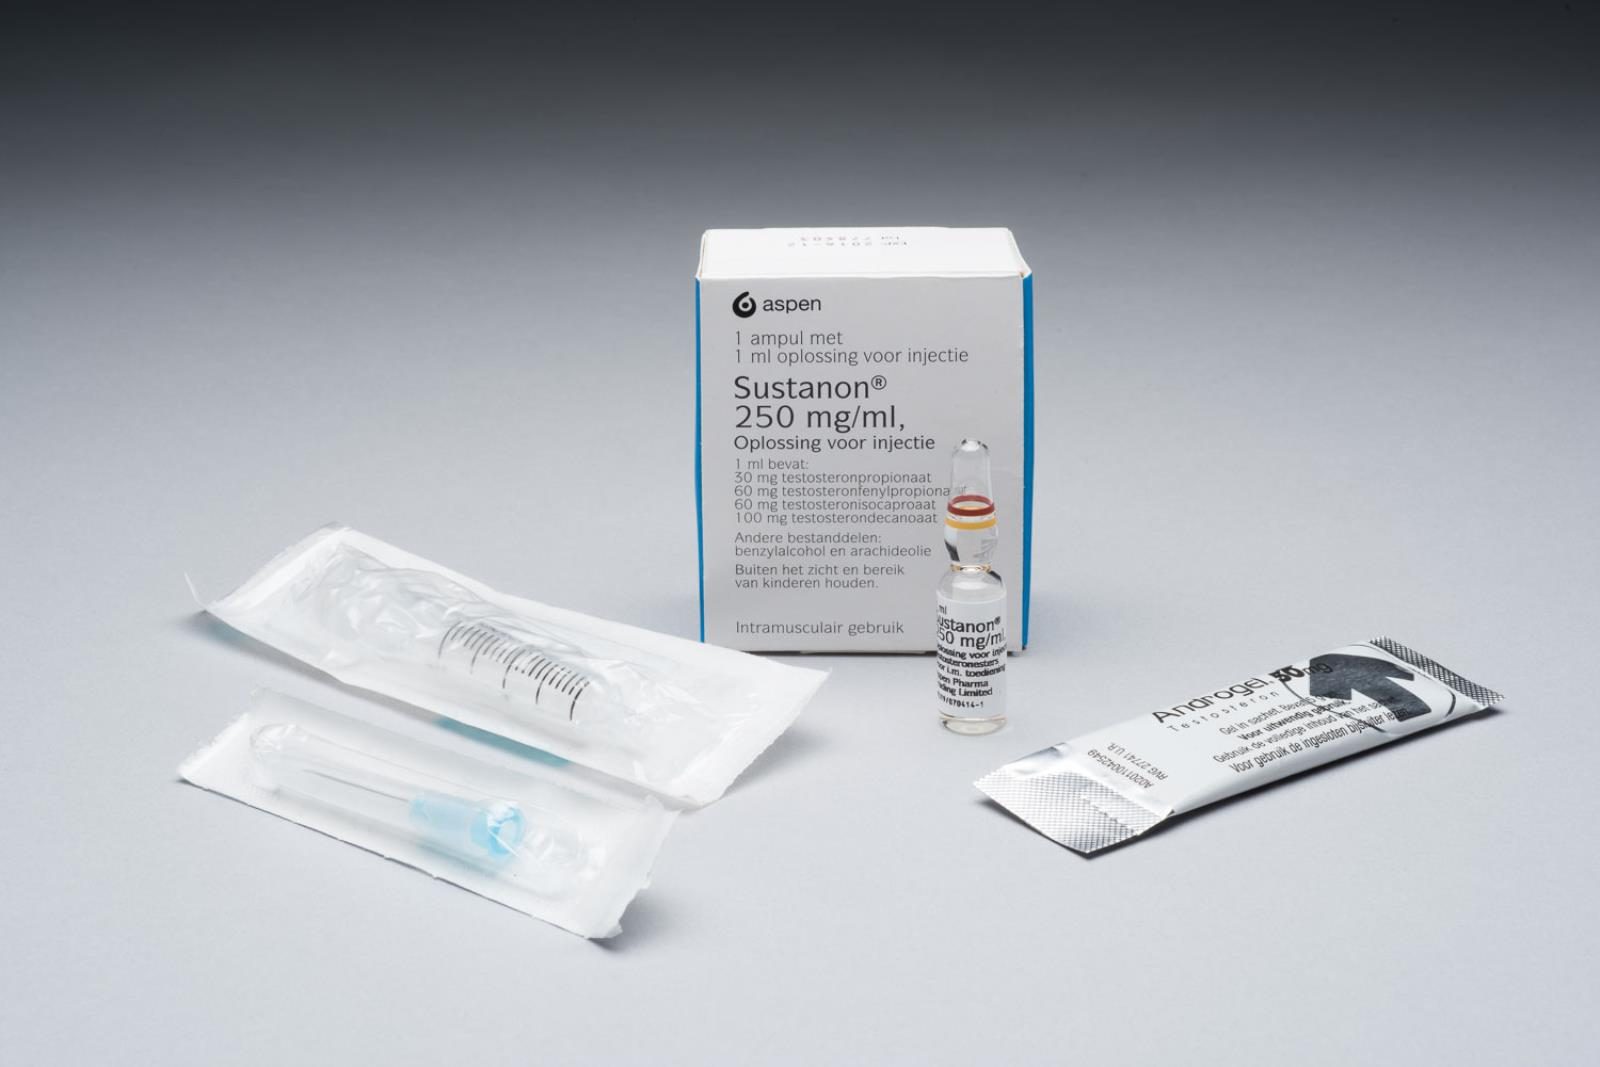
Aspen has released its FY 2026 results. Revenue fell 19.6% year-on-year, EBITDA dropped 75.0% to ZAR 2.68bn, and net profit came in at ZAR 2.65bn with a 7.6% net margin. Operating cash flow remains high at ZAR 6.87bn, and net debt is negative (–ZAR 429m). The share looks unattractive: EV/EBITDA LTM of 24.8 against falling revenue and a compressed margin, while the portal's model points to downside to fair value of up to –100%.
Key takeaways
— Revenue fell 19.6%, and this is not a one-off miss but a consequence of lower sales
— EBITDA collapsed 75.0% – the margin compressed from 24.7% to 7.7%
— Net profit of ZAR 2.65bn was achieved against a negative net margin a year earlier
— Operating cash flow of ZAR 6.87bn exceeds EBITDA, but capex absorbs ZAR 2.14bn
— Net debt is negative, but the net debt / EBITDA LTM ratio of –0.16 says nothing about direction
— Dividend yield of 1.36% with a P/E LTM of 25.3 does not compensate for the risks
— The portal's model estimates downside to fair value of –100%
Attractiveness
Key figures, ZAR bn
| Metric | FY 2025 | FY 2026 | Change |
|---|---|---|---|
| Revenue | 43.4 | 34.9 | -19.6% |
| EBITDA | 10.7 | 2.68 | -75.0% |
| Operating profit | 8.62 | 0.76 | -91.2% |
| Net profit | -1.08 | 2.65 | в прибыль |
| Operating cash flow | 5.16 | 6.87 | +33.1% |
| Capex | 5.05 | 2.14 | -57.6% |
| EBITDA margin | 24.7% | 7.7% | -17.0 pp |
| Net margin | -2.5% | 7.6% | +10.1 pp |
Revenue fell 19.6%, and this is not a one-off miss but a consequence of lower sales
Aspen's FY 2026 revenue came in at ZAR 34.87bn, down 19.6% from a year earlier. A drop of nearly one-fifth is not a fluctuation in demand but a sustained contraction. The company does not disclose in the provided data which segment caused this decline, but the scale suggests systemic issues.
For an investor, it matters that the revenue decline is accompanied by an even sharper fall in profit. If the drop were one-off, a recovery could be expected, but the dynamics point to business weakness.
EBITDA collapsed 75.0% – the margin compressed from 24.7% to 7.7%
FY 2026 EBITDA was ZAR 2.68bn, down 75.0% from a year earlier. The EBITDA margin fell to 7.7% from 24.7% a year earlier. Such a compression means costs did not fall in proportion to revenue, and operating leverage worked against the company.
Operating profit was ZAR 763m, significantly below EBITDA – the difference may be due to depreciation and impairments. This adds pressure on net profit.
Net profit of ZAR 2.65bn was achieved against a negative net margin a year earlier
FY 2026 net profit was ZAR 2.65bn, with a net margin of 7.6%. A year earlier, the net margin was negative at –2.5%. Thus, the company returned to profit despite falling revenue and EBITDA. This discrepancy requires explanation: likely, the profit was not driven by operations but by one-off factors not reflected in EBITDA.
Investors should understand that the sustainability of such profit is questionable, since operating profit was only ZAR 763m, while net profit was 3.5 times higher. This may indicate income from financial operations or taxation.
Operating cash flow of ZAR 6.87bn exceeds EBITDA, but capex absorbs ZAR 2.14bn
FY 2026 operating cash flow was ZAR 6.87bn, more than double EBITDA. This is a positive signal, but it may be driven by working capital release rather than improved operations. Capital expenditures were ZAR 2.14bn, consuming a significant portion of cash flow.
Free cash flow is therefore around ZAR 4.73bn, but this estimate does not account for potential obligations. Importantly, even with falling profit, the company generates enough cash to cover investments.
Net debt is negative, but the net debt / EBITDA LTM ratio of –0.16 says nothing about direction
Net debt at the latest reporting date was –ZAR 429m, meaning cash exceeds debt. The net debt / EBITDA LTM ratio is –0.16. This is a level that does not allow judging the direction of leverage, as the previous value is absent from the facts.
The reduction in net debt by ZAR 27.8bn compared to the previous reporting date and by ZAR 29.6bn over 12 months is a significant improvement, but it may be due to asset sales or one-off inflows. Without report details, the sustainability of this reduction is unclear.
Dividend yield of 1.36% with a P/E LTM of 25.3 does not compensate for the risks
The dividend yield over the trailing 12 months is 1.36%. This is a low level, especially against the key rate, and does not attract income-seeking investors. With a P/E LTM of 25.3, the share is expensive relative to current earnings, making dividend support insignificant.
The company does not disclose its dividend policy in the provided data, so the sustainability of payments cannot be assessed. However, with falling revenue and volatile profit, the likelihood of a dividend cut in the future increases.
The portal's model estimates downside to fair value of –100%
According to the portal's model, the downside to fair value is –100%. This means the model estimates fair value close to zero, which is a model limitation rather than a precise estimate. Nevertheless, it is a strong signal that the share is overvalued.
Market capitalisation is ZAR 66.99bn, and EV/EBITDA LTM is 24.8. Such a high multiple against falling revenue and a compressed margin indicates that the market is pricing in optimistic expectations that may not materialise.
Valuation on the latest reported figures
| Metric | Value |
|---|---|
| Market cap | 67.0 bn ZAR |
| P/E (LTM) | 25.3 |
| EV/EBITDA (LTM) | 24.8 |
| P/B | 0.83 |
| Net debt / EBITDA (LTM) | -0.16 |
| Operating cash flow (LTM) | 6.90 bn |
| ROE | 2.9% |
| Dividend yield (12m) | 1.4% |
Bottom line
Bottom line: Aspen reported a 19.6% revenue decline and a 75.0% EBITDA collapse, yet still posted a net profit of ZAR 2.65bn. The profit is likely one-off in nature, as operating profit was only ZAR 763m. Cash flow remains high, but capex and potential obligations limit free funds. The share is expensive: EV/EBITDA LTM of 24.8 against a compressed margin, and the portal's model points to downside of up to –100%. Verdict: unattractive.
Open the company's financial profile APN →
See also: market overview · valuation map · stock screeners