Harmony Gold: profit doubled on the gold rally, but the portal's model sees 41% downside
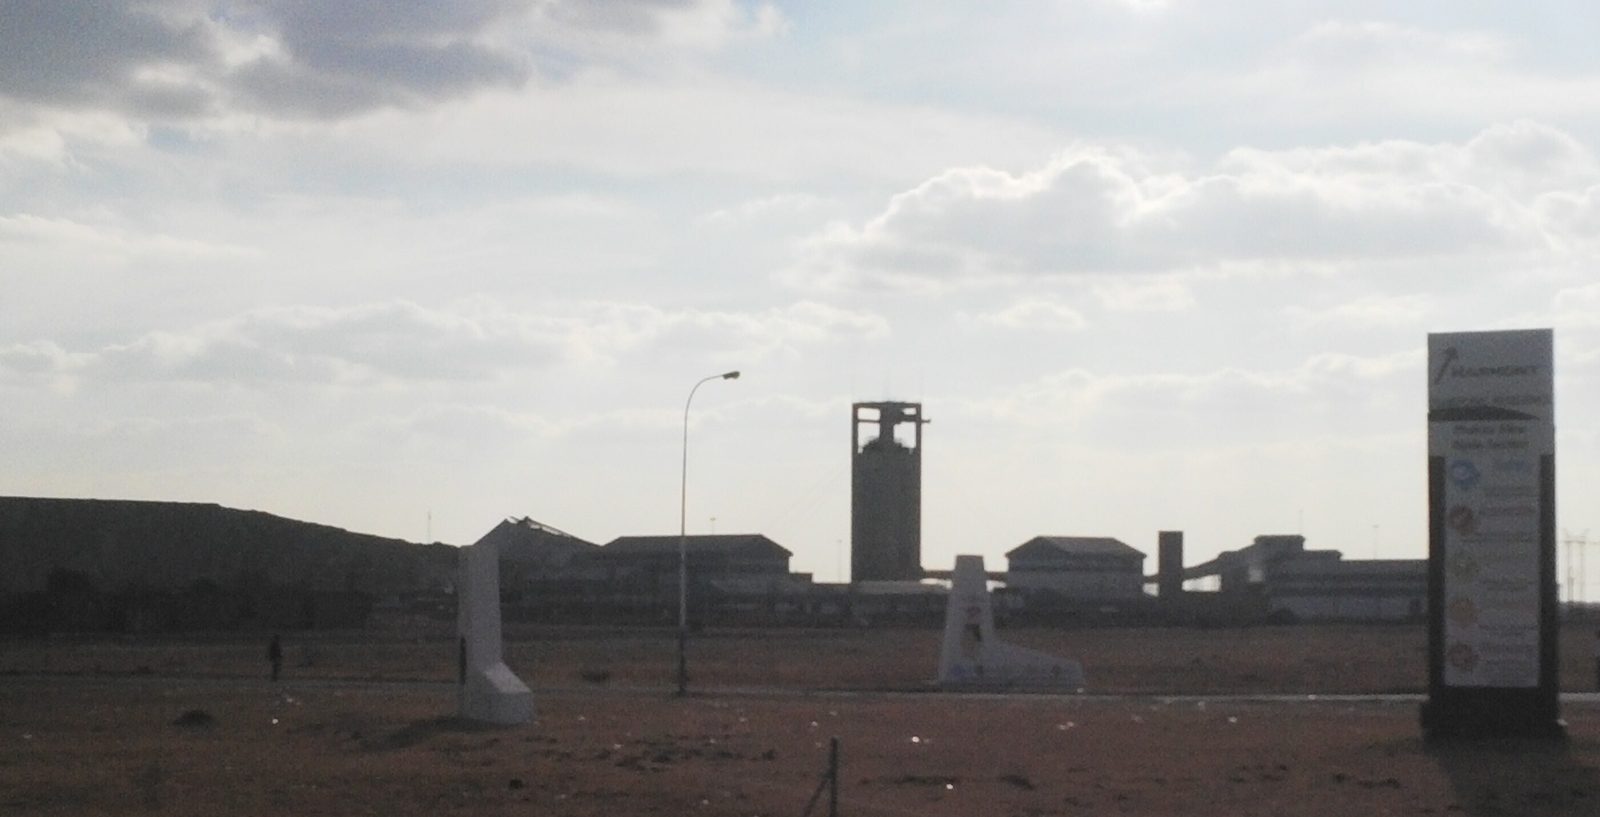
On August 25, Harmony Gold reported results for the fiscal year ended June 30, 2026: revenue rose 34.3%, EBITDA 82.2%, and net profit 104.0%. At the current price, the share looks unattractive: multiples are low, but the portal's model implies 41% downside.
Key takeaways
— Revenue grew by a third, driven by record gold prices and higher volumes
— EBITDA margin expanded to 48.2% from 35.6% a year earlier
— Net profit doubled, helped by the absence of major impairments
— Leverage remains minimal: net debt of ZAR 852 million is just 0.02x EBITDA for the last twelve months
— Return on equity exceeded 50%, reflecting high profitability on a low capital base
— The portal's model values the share 41% below its current price
Attractiveness
Key figures, ZAR bn
| Metric | FY 2025 | FY 2026 | Change |
|---|---|---|---|
| Revenue | 73.9 | 99.2 | +34.3% |
| EBITDA | 26.3 | 47.9 | +82.2% |
| Operating profit | 21.4 | 40.5 | +89.1% |
| Net profit | 14.4 | 29.3 | +104.0% |
| Operating cash flow | 22.6 | 33.6 | +48.4% |
| Capex | 11.9 | 17.8 | +50.5% |
| EBITDA margin | 35.6% | 48.2% | +12.6 pp |
| Net margin | 19.5% | 29.6% | +10.1 pp |
Revenue grew by a third, driven by record gold prices and higher volumes
For the fiscal year ended June 30, 2026, Harmony Gold's revenue reached ZAR 99,200 million, up 34.3% from a year earlier. The main driver was high gold prices, which set record highs during the year, as well as higher production volumes at the company's key mines in South Africa and Papua New Guinea.
The one-third revenue growth is not just a price effect but also the result of operational improvements: the company increased ore throughput and improved metal recovery. This allowed Harmony Gold to fully capitalise on the favourable price environment.
EBITDA margin expanded to 48.2% from 35.6% a year earlier
EBITDA for the reporting period grew 82.2% to ZAR 47,882 million for the trailing twelve months. The EBITDA margin reached 48.2% versus 35.6% a year earlier. The margin expansion is explained by operating leverage: revenue growth outpaced cost growth, especially against a backdrop of stable or declining unit costs.
The margin improvement is a key signal for investors: it shows that the company is not only benefiting from high prices but also controlling costs. This enhances the business's resilience to a potential decline in gold prices.
Net profit doubled, helped by the absence of major impairments
Net profit for the reporting period grew 104.0% to ZAR 29,349 million for the trailing twelve months. Net margin reached 29.6% versus 19.5% a year earlier. The doubling of profit was driven by higher EBITDA and the absence of significant one-off impairments, which had weighed on results in previous years.
The high net margin reflects not only operational efficiency but also a favourable tax environment and the absence of major asset impairment losses. This makes the quality of earnings high, though sensitive to gold prices.
Leverage remains minimal: net debt of ZAR 852 million is just 0.02x EBITDA for the last twelve months
As of the latest balance sheet date, Harmony Gold's net debt stood at ZAR 852 million. The ratio of net debt to EBITDA for the trailing twelve months is 0.02, indicating virtually no leverage. Over the year, net debt increased by ZAR 12.0 billion, but it decreased by ZAR 4.7 billion from the previous reporting date.
Such a low level of debt gives the company significant financial flexibility: it can fund investments and dividends without straining its balance sheet. Even with the year's increase in debt, its absolute size remains immaterial relative to cash flows.
Return on equity exceeded 50%, reflecting high profitability on a low capital base
Return on equity (ROE) for the trailing twelve months was 52.0%. This exceptionally high figure was made possible by record profits and a relatively small equity base – the company has historically returned a significant portion of earnings to shareholders through dividends and buybacks.
High ROE is a consequence, not a cause: it reflects the company's ability to generate profit on invested capital. However, investors should remember that such a level of ROE is unlikely to be sustainable when gold prices normalise.
The portal's model values the share 41% below its current price
According to the portal's model, which re-prices EBITDA at current commodity prices and applies a target EV/EBITDA multiple, the share's fair value is 41% below its current market price. This implies that the market has already priced in sustained high gold prices and current margins.
The share trades at a P/E LTM of 7.0 and EV/EBITDA LTM of 4.3, which looks cheap against historical levels. However, the portal's model accounts for a potential decline in gold prices and indicates limited upside. The current dividend yield is 2.1%, which is below the average for gold miners.
Harmony Gold is included in the 'ZA Commodity-Upside' strategy on the portal, but this merely reflects the share's fit with the strategy's screening criteria, not a buy recommendation.
Valuation on the latest reported figures
| Metric | Value |
|---|---|
| Market cap | 205 bn ZAR |
| P/E (LTM) | 7.0 |
| EV/EBITDA (LTM) | 4.3 |
| P/B | 2.73 |
| Net debt / EBITDA (LTM) | 0.02 |
| Operating cash flow (LTM) | 33.6 bn |
| ROE | 52.0% |
| Dividend yield (12m) | 2.1% |
Bottom line
Harmony Gold's fiscal year report is impressive: revenue grew by a third, EBITDA margin expanded to 48.2%, net profit doubled, and leverage remained minimal. However, these results are entirely driven by record gold prices, and the market has already priced them in: the portal's model sees 41% downside. At a P/E of 7.0 and EV/EBITDA of 4.3, the share looks cheap, but that is justified by the cyclicality of the business. For investors, the key question is the sustainability of gold prices: if they correct, profits and dividends could shrink significantly. We view the share as unattractive at the current level.
Open the company's financial profile HAR →
See also: market overview · valuation map · stock screeners