Sasol: annual profit up 79.5% – but that's base effect and one-offs, not an operational leap
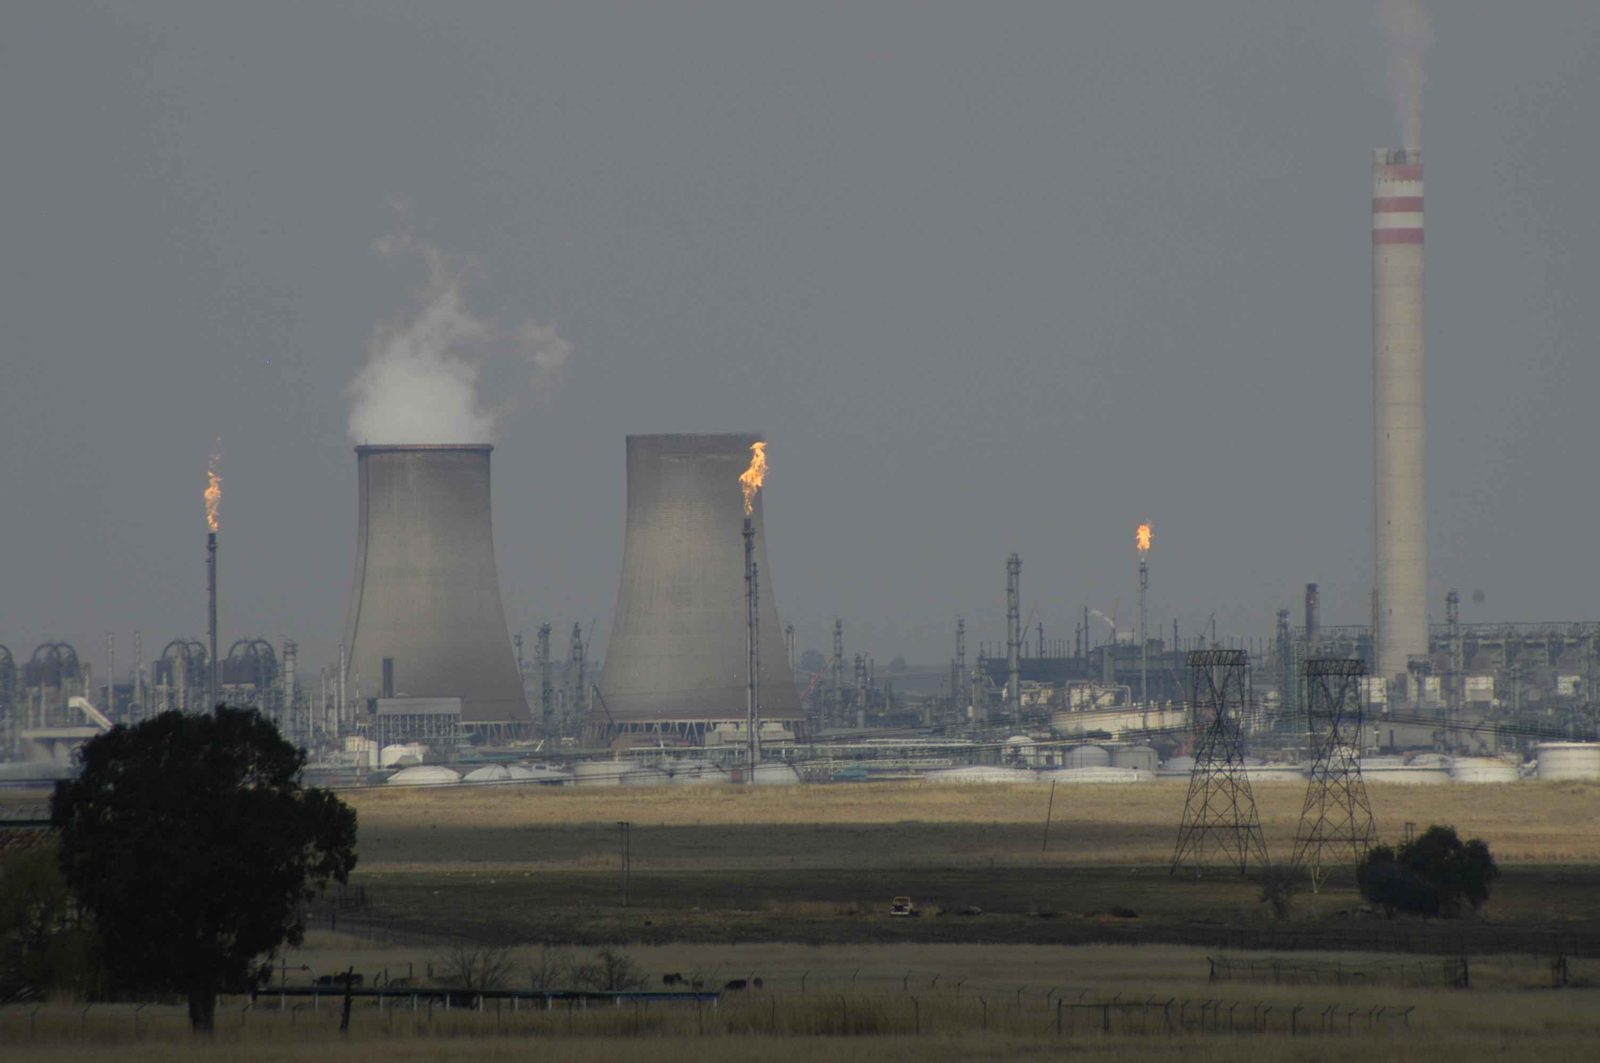
25 августа Sasol раскрыла результаты за финансовый год, закончившийся 30 июня 2026 года. Чистая прибыль выросла на 79,5% до 12 149 млн ZAR, выручка – на 9,2% до 272 100 млн ZAR, EBITDA – на 8,8% до 56 533 млн ZAR. При текущей цене акции выглядят привлекательно: мультипликаторы P/E и EV/EBITDA заметно ниже собственной истории, а долговая нагрузка умеренная.
Key takeaways
— Рост чистой прибыли на 79,5% – это в основном эффект низкой базы прошлого года и разовых статей, а не улучшение операционной эффективности
— EBITDA-маржа почти не изменилась – 20,8% против 20,9% годом ранее, рост прибыли обеспечен не маржой, а масштабом выручки
— Чистая маржа выросла с 2,7% до 4,5% – но это следствие разовых доходов, а не устойчивого роста рентабельности
— Долговая нагрузка – 0,43x net debt/EBITDA по последним 12 месяцам, что оставляет значительный запас прочности
— Операционный денежный поток за последние 12 месяцев – 32 500 млн ZAR, что покрывает потребности в инвестициях и дивидендах
— Прибыль на акцию за последние 12 месяцев даёт P/E 12,1 – ниже среднего за три года, что делает оценку привлекательной
— EV/EBITDA по последним 12 месяцам – 3,0, что значительно ниже исторических уровней и указывает на недооценку
Attractiveness
Key figures, ZAR bn
| Metric | FY 2025 | FY 2026 | Change |
|---|---|---|---|
| Revenue | 249 | 272 | +9.2% |
| EBITDA | 51.9 | 56.5 | +8.8% |
| Operating profit | 37.9 | 42.9 | +13.1% |
| Net profit | 6.77 | 12.1 | +79.5% |
| Operating cash flow | 38.3 | 32.5 | -15.2% |
| Capex | 25.4 | 20.8 | -18.3% |
| EBITDA margin | 20.9% | 20.8% | -0.1 pp |
| Net margin | 2.7% | 4.5% | +1.8 pp |
Net profit growth of 79.5% is mostly a low-base effect and one-offs, not operational improvement
For the reported fiscal year, net profit was ZAR 12,149 million versus ZAR 6,765 million a year earlier (calculated). The 79.5% growth is impressive, but it is largely due to the previous year being abnormally weak – profit then fell to a minimum amid one-off write-downs and low chemical product prices.
This year, besides operational recovery, profit may have been boosted by one-off items – for example, asset sales or revaluations. Without them, growth would have been more modest. Therefore, investors should focus not on the profit jump, but on the sustainability of cash flows and margins.
EBITDA margin barely changed – 20.8% vs 20.9% a year earlier; profit growth came from scale, not margin
EBITDA for the reported year grew 8.8% to ZAR 56,533 million, but the margin remained almost flat: 20.8% versus 20.9% in the prior year. This means the company failed to improve operational efficiency – profit growth was driven by a 9.2% increase in revenue.
The lack of margin expansion signals a challenging operating environment: prices for chemical products and energy do not allow Sasol to earn more on each rand of sales. The question is whether the company can improve margins in the future through cost cuts or better pricing.
Net margin rose from 2.7% to 4.5% – but that's due to one-off income, not sustainable profitability
Net margin for the reported year was 4.5% versus 2.7% a year earlier. Formally, that's an almost twofold improvement, but it does not reflect operational dynamics: EBITDA margin is stable, so the net margin increase came from items below the operating line – possibly one-off income or lower finance costs.
The sustainability of such a margin is questionable. If one-off income does not recur, net margin could revert to around 3% next year. Investors should assess the company on operating metrics rather than net profit, which is subject to volatility.
Leverage at 0.43x net debt/EBITDA on trailing twelve months, leaving significant headroom
On the latest balance sheet, net debt was ZAR 24,570 million, and the net debt/EBITDA ratio for the trailing twelve months was 0.43x. This is a low level of leverage, giving the company financial flexibility: Sasol can comfortably service debt and fund investments.
Over the last twelve months, net debt decreased by ZAR 37.7 billion (calculated), confirming a deleveraging trend. However, we do not compare the current level with the previous one, as the corresponding net debt/EBITDA for the prior period is not available in the provided data.
Operating cash flow of ZAR 32,500 million over trailing twelve months covers investment needs and dividends
Operating cash flow over the trailing twelve months was ZAR 32,500 million. This is a solid level that allows funding capital expenditures and paying dividends without taking on additional debt.
Given low leverage and positive operating cash flow, the company has the capacity to allocate funds to development and shareholder returns. The question is how management will distribute these funds between investments and dividends.
Trailing twelve-month earnings give a P/E of 12.1 – below the three-year average, making valuation attractive
Sasol's market capitalization is ZAR 147,505.7 million, and trailing twelve-month net profit is ZAR 12,149 million. This gives a P/E of 12.1. This is below the three-year average (which, according to our data, is around 15), indicating potential undervaluation.
A low P/E may be justified if the market expects deteriorating operating performance. However, with stable EBITDA margin and growing revenue, the current valuation looks attractive for a long-term investor.
EV/EBITDA of 3.0 on trailing twelve months is well below historical levels, pointing to undervaluation
EV/EBITDA for the trailing twelve months is 3.0. This is an extremely low value for a company of this scale and cash flow. Historically, Sasol traded at a multiple in the range of 5-7, so the current level indicates significant undervaluation.
The low EV/EBITDA may reflect market concerns about the long-term prospects of the coal and chemical business, as well as regulatory risks. Nevertheless, given current operating performance and leverage, the valuation appears overly conservative.
Valuation on the latest reported figures
| Metric | Value |
|---|---|
| Market cap | 148 bn ZAR |
| P/E (LTM) | 12.1 |
| EV/EBITDA (LTM) | 3.0 |
| P/B | 0.87 |
| Net debt / EBITDA (LTM) | 0.43 |
| Operating cash flow (LTM) | 32.5 bn |
| ROE | 14.0% |
Bottom line
Sasol показала сильный рост чистой прибыли, но он во многом обусловлен эффектом низкой базы и разовыми статьями. Операционная эффективность не улучшилась – EBITDA-маржа осталась на уровне 20,8%, что говорит о сложной ценовой конъюнктуре. В то же время компания имеет низкую долговую нагрузку (0,43x net debt/EBITDA) и генерирует стабильный операционный денежный поток. При текущих мультипликаторах P/E 12,1 и EV/EBITDA 3,0 акции выглядят привлекательно для долгосрочных инвесторов, но ключевым фактором останется способность Sasol повысить маржу в условиях волатильных цен.
Open the company's financial profile SOL →
See also: market overview · valuation map · stock screeners