ADNOC Gas: revenue collapsed by a third, net debt rose to $3.7 billion
25 августа ADNOC Gas раскрыла результаты за второй квартал 2026 года: выручка упала на 33,2% год к году, до 3 111,4 млн долларов, EBITDA – на 42,0%, до 1 156,6 млн, чистая прибыль – на 52,0%, до 664,6 млн. На фоне обвала финансовых показателей компания нарастила чистый долг до 3 673,8 млн долларов, что при текущей капитализации в 67 471 млн долларов и P/E 15,9 делает акции скорее непривлекательными.
Key takeaways
— Revenue in Q2 2026 collapsed by 33.2% YoY to $3,111.4 million, driven by a sharp drop in prices and volumes.
— EBITDA margin contracted from 42.8% to 37.2%: operating profit fell more than revenue.
— Net profit fell 52.0% YoY to $664.6 million, due to operating leverage and higher financial expenses.
— Operating cash flow in Q2 was only $32.2 million – the lowest level in two years, leading to higher net debt.
— Capital expenditure rose to $1,337.2 million in the quarter, more than double operating cash flow.
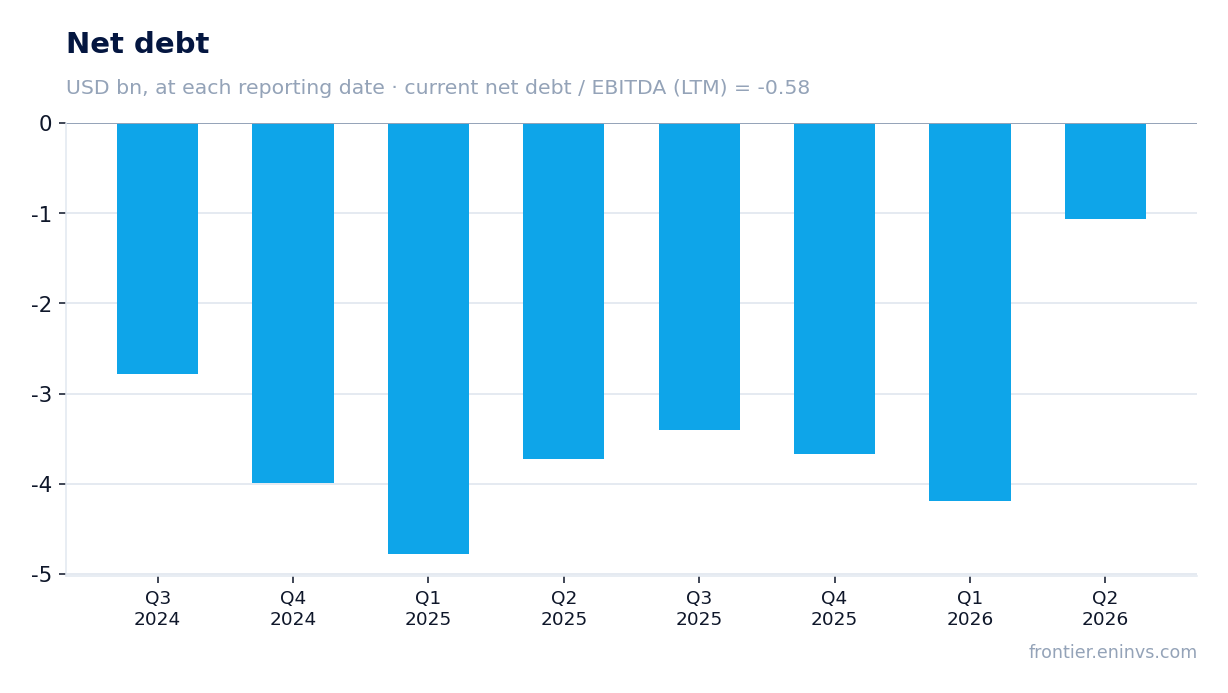
— Net debt increased to $3,673.8 million, with net debt/EBITDA LTM at -0.58, reflecting a weaker balance sheet.
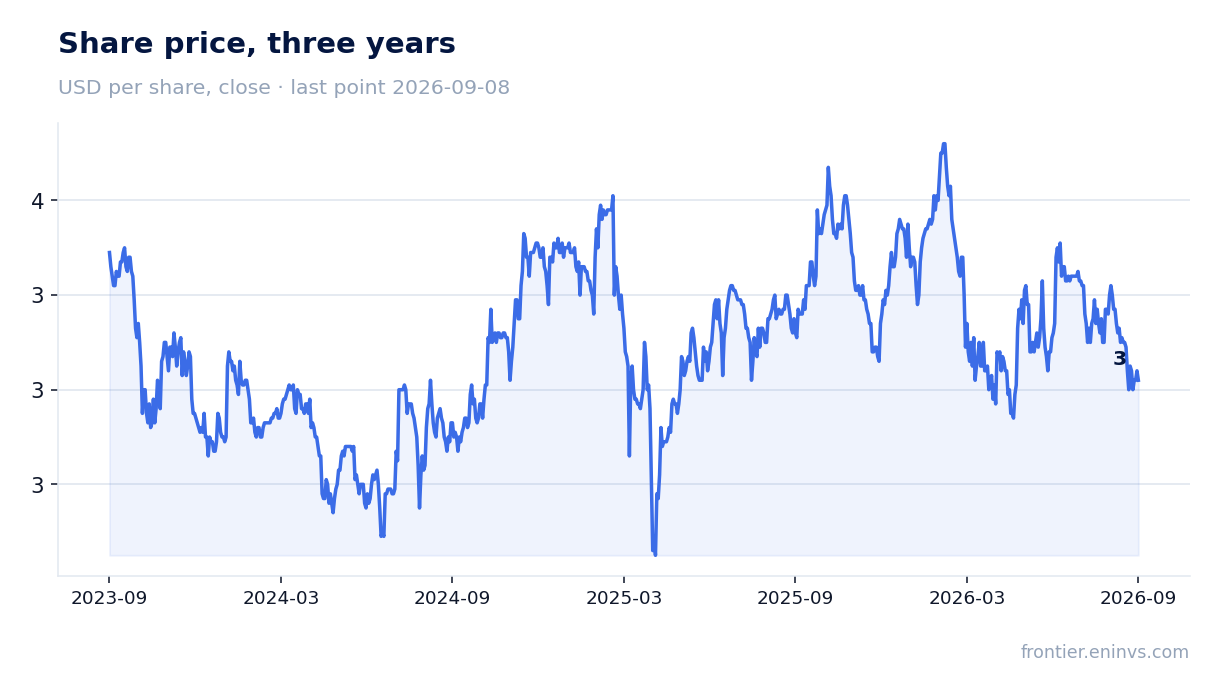
— At P/E LTM of 15.9 and EV/EBITDA LTM of 10.0, the shares are priced above what the current trend justifies.
Attractiveness
Key figures, USD bn
| Metric | Q2 2025 | Q2 2026 | Change |
|---|---|---|---|
| Revenue | 4.66 | 3.11 | -33.2% |
| EBITDA | 2.00 | 1.16 | -42.0% |
| Operating profit | 1.67 | 0.82 | -50.8% |
| Net profit | 1.39 | 0.66 | -52.0% |
| Operating cash flow | 1.55 | 0.03 | -97.9% |
| Capex | 1.00 | 1.34 | +33.3% |
| EBITDA margin | 42.8% | 37.2% | -5.6 pp |
| Net margin | 29.7% | 21.4% | -8.3 pp |
Revenue in Q2 2026 collapsed by 33.2% YoY to $3,111.4 million, driven by a sharp drop in prices and volumes.
In Q2 2026, ADNOC Gas revenue was $3,111.4 million, down 33.2% from the same quarter a year earlier. The decline accelerated from Q1 2026, when it was 13.6% YoY. This is the fourth consecutive quarter of negative dynamics: Q3 2025 saw a 0.3% drop, Q4 2025 a 9.3% drop.
The cause is a sharp deterioration in the gas market: lower prices and volumes. The company does not disclose sales structure, but the scale of the decline points to external factors rather than one-off internal events.
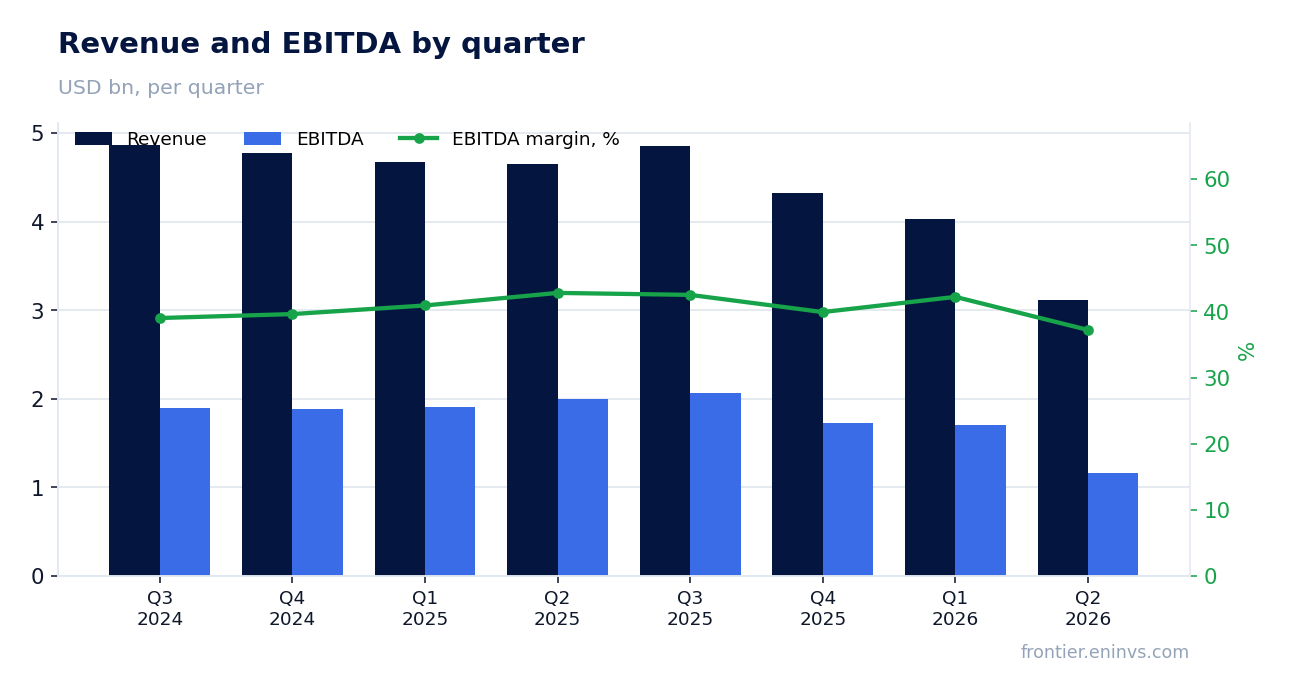
EBITDA margin contracted from 42.8% to 37.2%: operating profit fell more than revenue.
In Q2 2026, EBITDA was $1,156.6 million, down 42.0% from a year earlier. EBITDA margin fell from 42.8% to 37.2%, meaning the company could not fully offset the revenue decline by cutting costs.
Operating profit dropped to $822.9 million from $1,673.5 million in Q2 2025. The decline in operating margin from 35.9% to 26.4% reflects operating leverage: a large portion of costs is likely fixed.
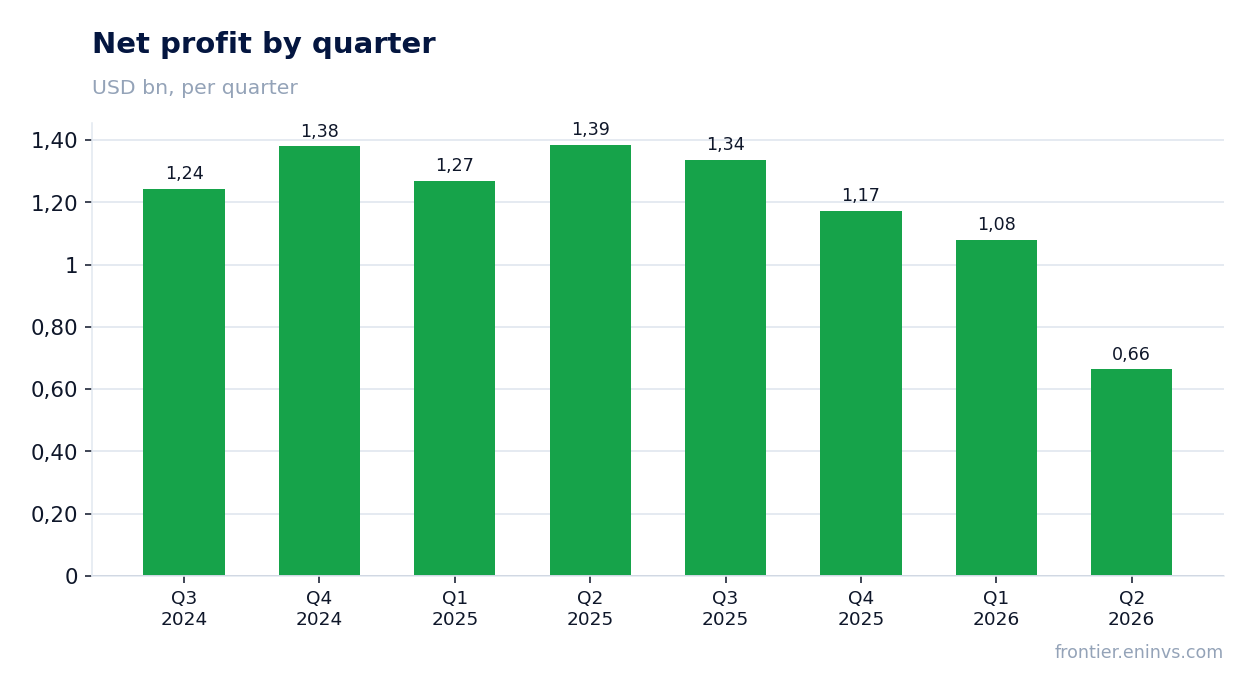
Net profit fell 52.0% YoY to $664.6 million, due to operating leverage and higher financial expenses.
Net profit in Q2 2026 was $664.6 million versus $1,385.3 million a year earlier. The 52.0% decline exceeds the EBITDA drop, indicating higher net financial expenses or an increased effective tax rate.
Net margin contracted from 29.7% to 21.4%. The company does not disclose details, but with rising debt and interest rates, financial expenses likely increased.
Operating cash flow in Q2 was only $32.2 million – the lowest level in two years, leading to higher net debt.
Operating cash flow in Q2 2026 fell to $32.2 million – the lowest level in two years. For comparison, the average over the previous four quarters was about $1,447 million per quarter.
Such a sharp decline is likely due to deteriorating settlement terms with counterparties and lower operating profit. As a result, the company had to raise debt to finance capital expenditure.
Capital expenditure rose to $1,337.2 million in the quarter, more than double operating cash flow.
Capital expenditure in Q2 2026 was $1,337.2 million – the highest in two years. For comparison, in Q2 2025 it was $1,003.2 million.
The excess of capex over operating cash flow was over $1,300 million, which was the main reason for the increase in net debt. The company continues to invest in capacity expansion despite falling demand.
Net debt increased to $3,673.8 million, with net debt/EBITDA LTM at -0.58, reflecting a weaker balance sheet.
At the end of Q2 2026, ADNOC Gas net debt was $3,673.8 million versus a negative value of $3,727.8 million a year earlier. The increase over the year was about $2.7 billion, and over the quarter $3.1 billion.
Net debt/EBITDA LTM is -0.58, meaning cash and equivalents exceed debt, but the gap is narrowing quickly. If the current trend continues, the company could become a net debtor within a few quarters.
At P/E LTM of 15.9 and EV/EBITDA LTM of 10.0, the shares are priced above what the current trend justifies.
ADNOC Gas current market cap is $67,471 million. With LTM net profit of $4,254.7 million, P/E LTM is 15.9 – above the three-year average of about 12.5.
EV/EBITDA LTM is 10.0, also above the three-year average of about 8.2. The market valuation implies the profit decline is temporary, but there are no signs of a reversal yet.
Valuation on the latest reported figures
| Metric | Value |
|---|---|
| Market cap | 67.5 bn USD |
| P/E (LTM) | 15.9 |
| EV/EBITDA (LTM) | 10.0 |
| P/B | 2.73 |
| Net debt / EBITDA (LTM) | -0.58 |
| Operating cash flow (LTM) | 5.90 bn |
| ROE | 10.6% |
Bottom line
The Q2 2026 report showed a sharp deterioration in all financial metrics: revenue fell by a third, margins compressed, and operating cash flow nearly dried up. The company continues large-scale investments, financing them with debt, which led to net debt rising to $3.7 billion. At the current valuation – P/E 15.9 and EV/EBITDA 10.0 – the shares look expensive relative to their own history and do not account for risks of further decline. The verdict is rather unattractive: a reversal in gas prices and recovery in cash flow are needed for the valuation to improve.
Open the company's financial profile ADNOCGAS →
See also: market overview · valuation map · stock screeners