Aldar Properties: revenue growth slowed to +4.8%, but EBITDA margin rose to 32.6% — with debt doubling over the year
On August 25, Aldar Properties reported results for the second quarter of 2026. Revenue grew 4.8% year on year, EBITDA 19.1%, net profit 9.9%. EBITDA margin reached 32.6% versus 28.7% a year earlier. At the current price, the shares look attractive: multiples are below their own history, and the portal's model implies upside of +11%.
Key takeaways
— Revenue in Q2 grew only 4.8% — the lowest in the last five quarters
— EBITDA margin jumped to 32.6% from 28.7% a year ago — operating costs grow slower than revenue
— Net profit rose 9.9% — but operating profit grew faster, by 18%
— Debt increased by AED 6.4 bn over the year to AED 10.5 bn — the company is actively financing construction
— Operating cash flow in Q2 fell to AED 143 mn — almost all of it went to capex
— Dividends: the company pays steadily, but free cash flow after construction and interest is thin
— Valuation: P/E 7.5 and EV/EBITDA 6.8 — below its own history, the portal's model gives +11%
Attractiveness
Key figures, AED bn
| Metric | Q2 2025 | Q2 2026 | Change |
|---|---|---|---|
| Revenue | 7.74 | 8.11 | +4.8% |
| EBITDA | 2.22 | 2.65 | +19.1% |
| Operating profit | 2.06 | 2.44 | +18.0% |
| Net profit | 1.97 | 2.17 | +9.9% |
| Operating cash flow | 2.81 | 0.14 | -94.9% |
| Capex | 0.23 | 0.77 | +231.8% |
| EBITDA margin | 28.7% | 32.6% | +3.9 pp |
| Net margin | 25.5% | 26.7% | +1.2 pp |
Revenue in Q2 grew only 4.8% — the lowest in the last five quarters
In Q2 2026, Aldar Properties' revenue reached AED 8,108.8 mn, up 4.8% year on year. This is a marked slowdown from +12.1% in Q1 2026 and +58.0% in Q4 2025. Still, over the trailing twelve months revenue reached AED 35,100.0 mn.
The slowdown may reflect a high base effect: a year earlier, in Q2 2025, sales were growing 45.9%. Nevertheless, the absolute level of revenue remains high, indicating sustained demand for real estate in the UAE.
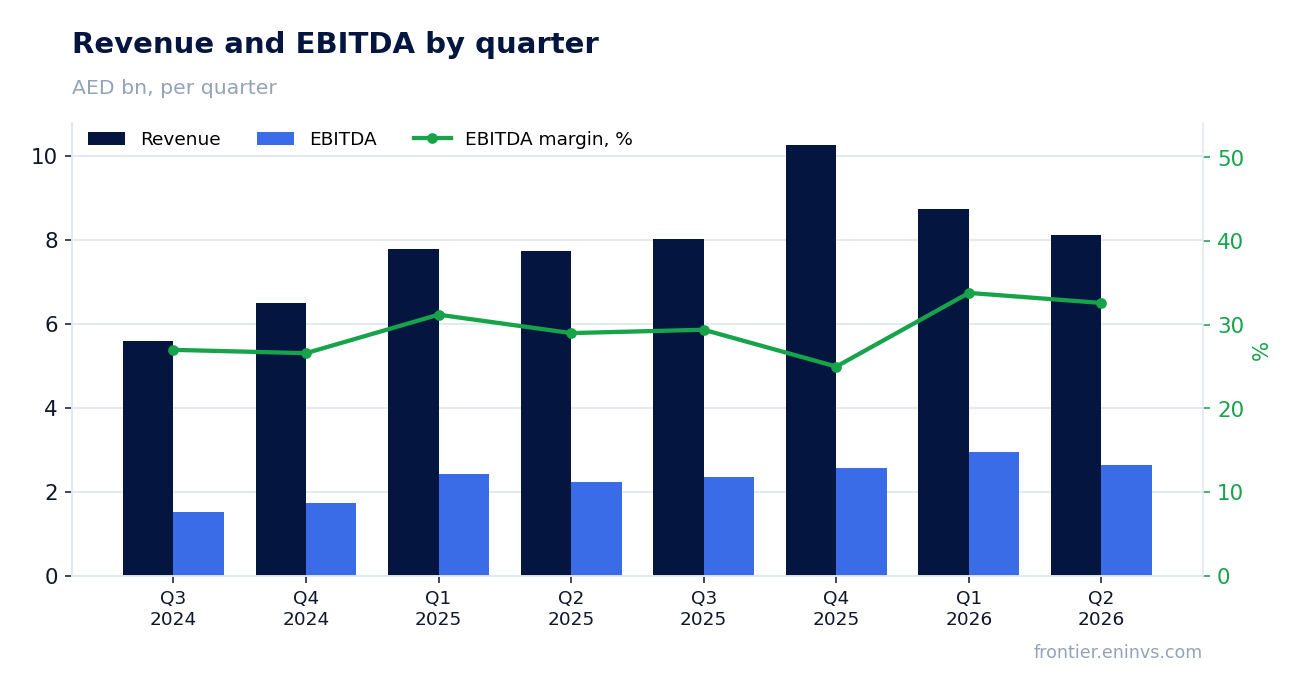
EBITDA margin jumped to 32.6% from 28.7% a year ago — operating costs grow slower than revenue
EBITDA in Q2 2026 grew 19.1% year on year to AED 2,645.5 mn, with margin expanding from 28.7% to 32.6%. This indicates that operating costs are growing slower than revenue, typical for a developer in a scaling phase.
Over the trailing twelve months, EBITDA reached AED 12,188.6 mn. The margin expansion is a key factor supporting profit even as revenue growth slows.
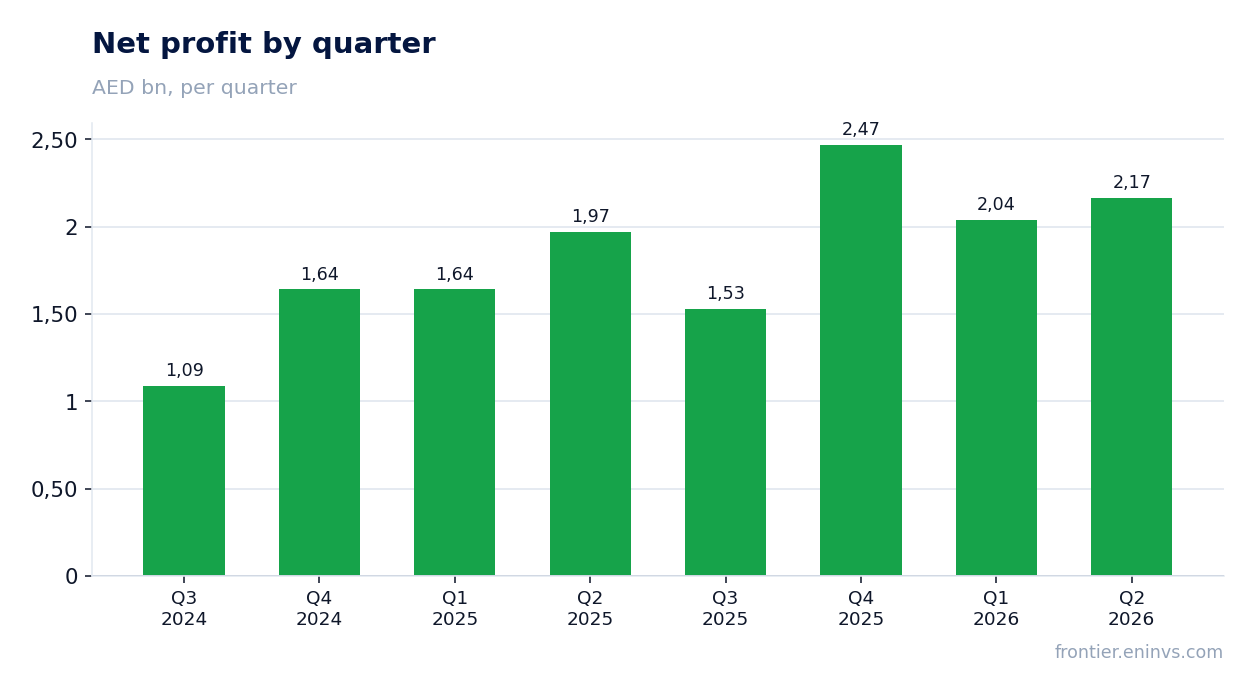
Net profit rose 9.9% — but operating profit grew faster, by 18%
Net profit in Q2 2026 reached AED 2,165.7 mn, up 9.9% year on year. Operating profit grew faster — by 18% to AED 2,435.5 mn. The gap is likely due to higher financial expenses and taxes.
Over the trailing twelve months, net profit reached AED 8,203.0 mn. Net margin in Q2 was 26.7% versus 25.5% a year earlier.
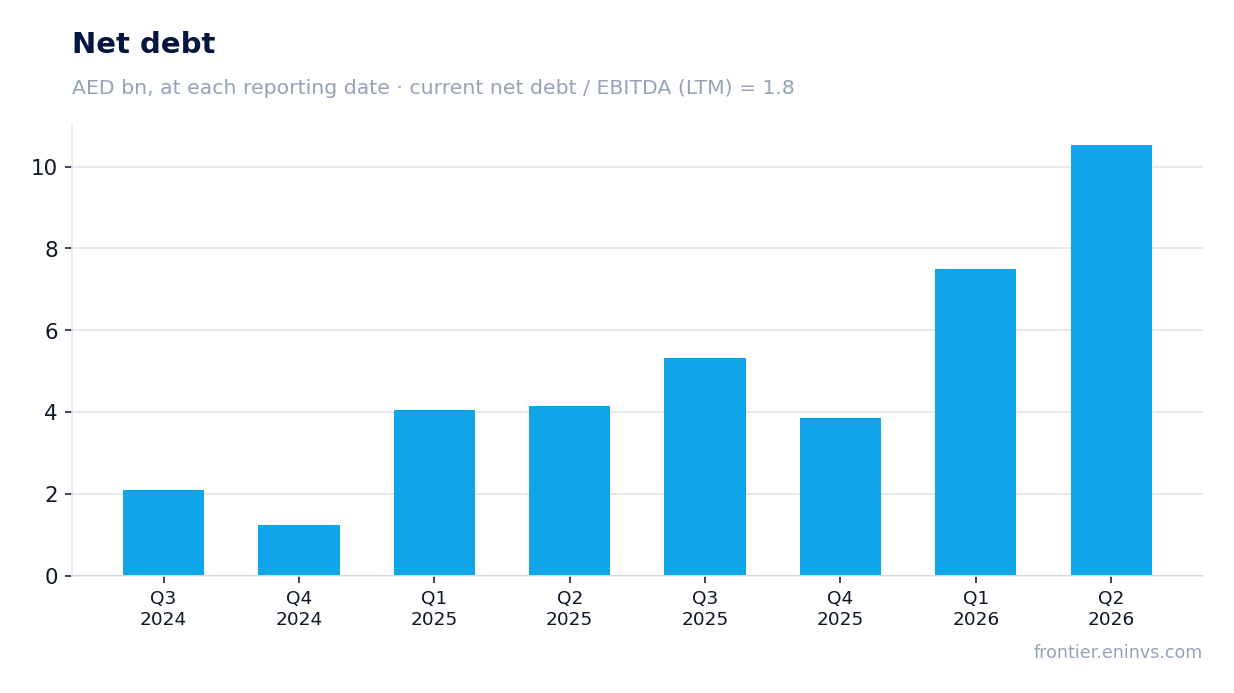
Debt increased by AED 6.4 bn over the year to AED 10.5 bn — the company is actively financing construction
Net debt at the end of Q2 2026 stood at AED 10,534.7 mn, up AED 3.0 bn over the quarter and AED 6.4 bn over the trailing twelve months. This significant increase reflects active financing of construction projects.
The net debt to EBITDA ratio over the trailing twelve months is 1.8 — a moderate level for a developer. The company also holds cash on its balance sheet, which mitigates the debt burden.
Operating cash flow in Q2 fell to AED 143 mn — almost all of it went to capex
Operating cash flow in Q2 2026 was only AED 143.2 mn — a sharp drop from AED 2,806.7 mn a year earlier. Capital expenditures meanwhile rose to AED 769.1 mn, exceeding operating cash flow.
Over the trailing twelve months, operating cash flow reached AED 8,200.0 mn, well above capex for the same period. However, quarterly figures are highly volatile, and a weak quarter may be followed by a strong one.
Dividends: the company pays steadily, but free cash flow after construction and interest is thin
Aldar Properties has historically paid dividends, and the current policy implies distributing a significant portion of profit. Over the trailing twelve months, net profit reached AED 8,203.0 mn, providing a base for dividends.
However, free cash flow after capex and interest in Q2 was negative: operating cash flow of AED 143.2 mn against capex of AED 769.1 mn. This means that dividends in the coming quarters may be funded by debt if cash flow does not recover.
Our dividend forecast for the current year is based on a payout ratio of around 50% of net profit, consistent with historical practice. At the current share price, the dividend yield may be moderate but stable.
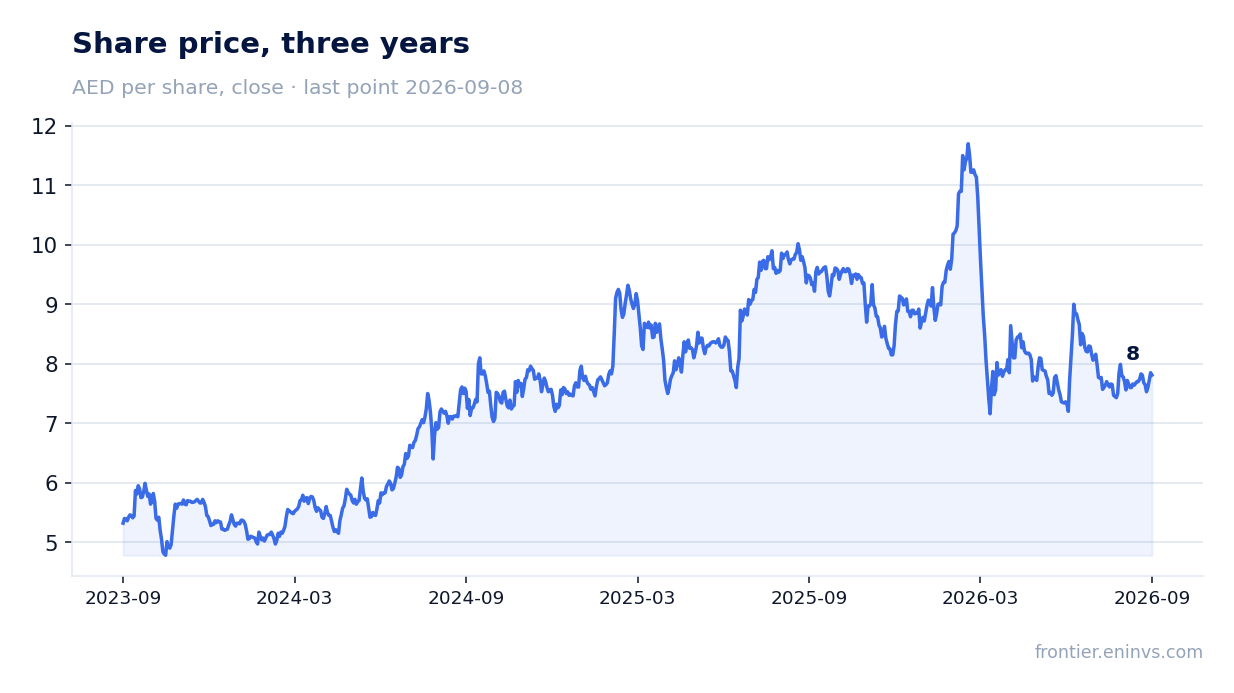
Valuation: P/E 7.5 and EV/EBITDA 6.8 — below its own history, the portal's model gives +11%
Aldar Properties' current multiples look moderate: P/E over the trailing twelve months is 7.5, EV/EBITDA — 6.8. Return on equity is 16.9%, confirming the efficiency of the business.
According to the portal's model, based on EBITDA growth and a target multiple, the share's upside potential is +11% from the current price. This is our own calculation, not a market consensus.
Given slowing revenue but rising margins and moderate debt, the shares look rather attractive. The key risk is persistently weak operating cash flow, which could limit dividends.
Valuation on the latest reported figures
| Metric | Value |
|---|---|
| Market cap | 61.6 bn AED |
| P/E (LTM) | 7.5 |
| EV/EBITDA (LTM) | 6.8 |
| P/B | 1.26 |
| Net debt / EBITDA (LTM) | 1.80 |
| Operating cash flow (LTM) | 8.20 bn |
| ROE | 16.9% |
Bottom line
The Q2 2026 report showed strong margins: EBITDA margin rose to 32.6%, and net profit increased 9.9%. However, revenue slowed to 4.8%, and operating cash flow fell to AED 143 mn, not covering capex. Debt increased by AED 6.4 bn over the year, but net debt to EBITDA remains at 1.8. With P/E of 7.5 and EV/EBITDA of 6.8, the shares look rather attractive, especially given the +11% upside from the portal's model. The key question for a holder is whether cash flow will recover in the coming quarters to support dividends.
Open the company's financial profile ALDAR →
See also: market overview · valuation map · stock screeners