DEWA: revenue falls for the first time in a year in Q2, but profit rises 1.4%
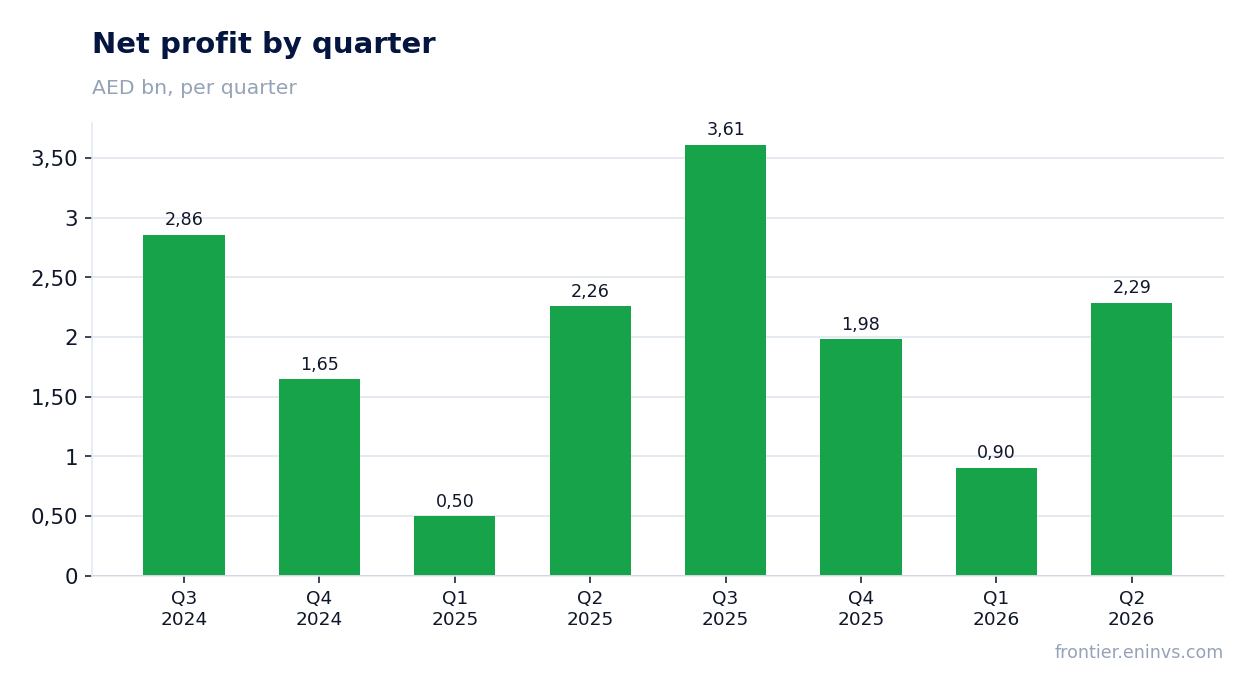
On August 25, DEWA reported results for the second quarter of 2026. Revenue fell 2.6% year on year to AED 8,413.0 million, while net profit rose 1.4% to AED 2,289.0 million. At the current price, the shares look rather attractive: a moderate multiple, growing cash flow, and a dividend yield above 4.5%.
Key takeaways
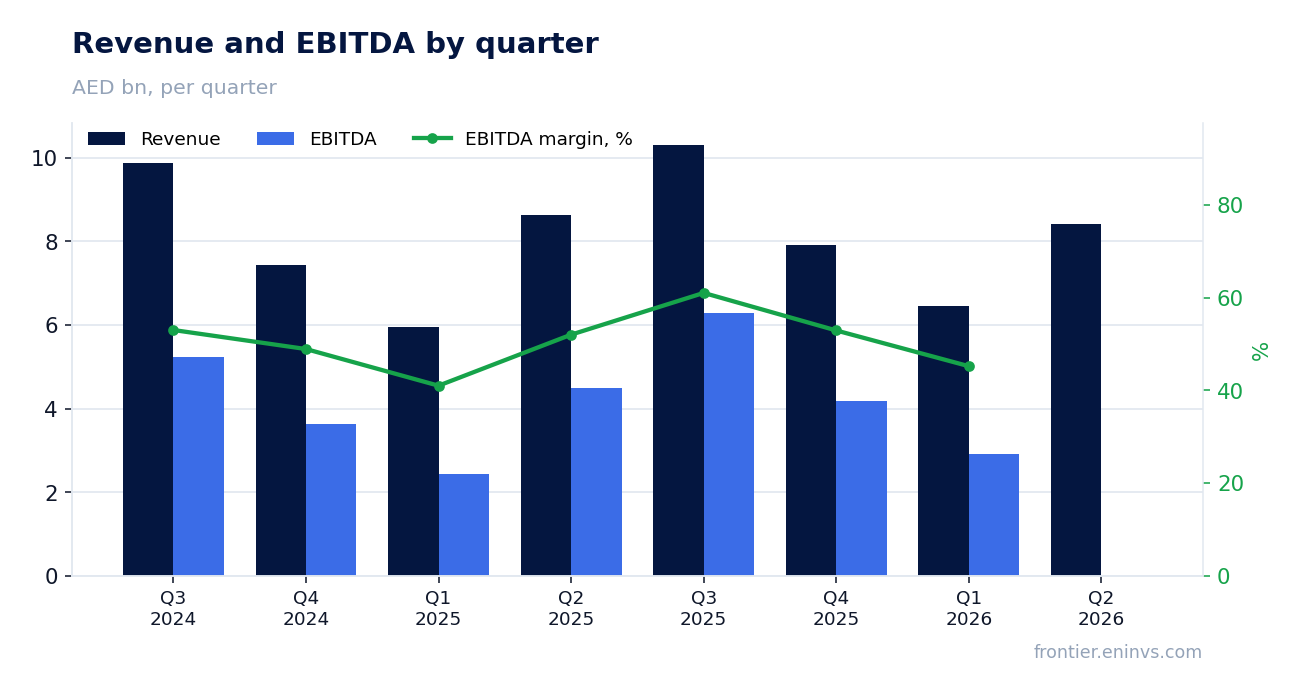
— Revenue in Q2 fell 2.6% – the first decline in a year, but net profit rose 1.4%
— Net margin expanded to 27.2% from 26.1% a year earlier
— Operating cash flow in the quarter fell 26.7% to AED 3,891.8 million
— Capex fell to AED 1,982.2 million, supporting free cash flow
— Net debt fell AED 1.4 billion in the quarter but rose AED 6.0 billion over the year
— Dividend yield over the trailing twelve months is 4.6%, above the key rate
— Shares trade at P/E of 15.5 and EV/EBITDA of 9.6 – below their three-year averages
Attractiveness
Key figures, AED bn
| Metric | Q2 2025 | Q2 2026 | Change |
|---|---|---|---|
| Revenue | 8.64 | 8.41 | -2.6% |
| EBITDA | 4.50 | — | — |
| Net profit | 2.26 | 2.29 | +1.4% |
| Operating cash flow | 5.31 | 3.89 | -26.7% |
| Capex | 2.28 | 1.98 | -13.0% |
| EBITDA margin | 52.0% | — | — |
| Net margin | 26.1% | 27.2% | +1.1 pp |
Revenue in Q2 fell 2.6% – the first decline in a year, but net profit rose 1.4%
In Q2 2026, DEWA's revenue was AED 8,413.0 million, 2.6% lower than a year earlier. This is the first quarterly decline after four quarters of growth: in Q1 2026 revenue rose 8.2%, in Q4 2025 – 6.5%, in Q3 – 4.5%, and in Q2 – 9.8%.
Despite the revenue decline, net profit rose 1.4% to AED 2,289.0 million. This was possible due to margin expansion: net margin rose to 27.2% from 26.1% a year earlier. The company likely controlled operating expenses, though the exact reason is not disclosed.
Net margin expanded to 27.2% from 26.1% a year earlier
Net margin in Q2 2026 was 27.2% versus 26.1% in the same quarter of 2025. This means the company managed to maintain profit despite lower revenue, indicating tight cost control or a favorable shift in the cost structure.
Over the trailing twelve months, net profit reached AED 8,785.2 million on revenue of AED 33,100.0 million, implying a margin of about 26.5%. If the margin expansion trend continues, it will support financial results even if revenue stagnates.
Operating cash flow in the quarter fell 26.7% to AED 3,891.8 million
In Q2 2026, operating cash flow was AED 3,891.8 million, 26.7% lower than a year earlier (AED 5,311.2 million). The decline occurred amid falling revenue and possibly changes in working capital.
Over the trailing twelve months, operating cash flow reached AED 21,900.0 million, well above net profit (AED 8,785.2 million). This indicates high earnings quality and the company's ability to generate cash.
Capex fell to AED 1,982.2 million, supporting free cash flow
Capex in Q2 2026 was AED 1,982.2 million, lower than both the previous quarter (AED 2,129.9 million) and the year-ago level (AED 2,278.7 million). The reduction in capex helped maintain positive free cash flow despite the drop in operating cash flow.
Over the trailing twelve months, capex totaled about AED 10,349.7 million (sum of quarterly values), roughly 31% of operating cash flow. This is a moderate investment level for an infrastructure company, allowing substantial funds to be directed to dividends.
Net debt fell AED 1.4 billion in the quarter but rose AED 6.0 billion over the year
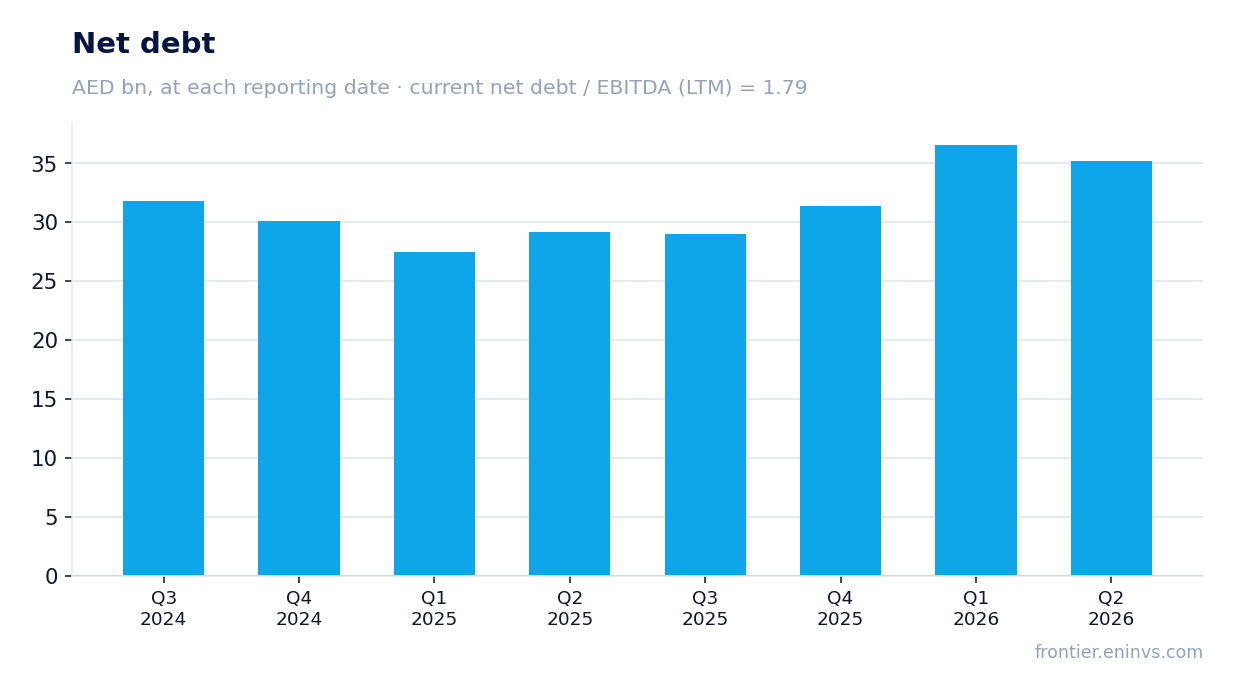
At the end of Q2 2026, net debt was AED 35,154.4 million, AED 1.4 billion lower than at the previous reporting date (AED 36,575.9 million). However, over the trailing twelve months, net debt rose AED 6.0 billion – from AED 29,144.7 million in Q2 2025.
The ratio of net debt to EBITDA over the trailing twelve months is 1.79. This is a moderate level of leverage for a utility with stable cash flow. The annual increase in debt is partly explained by the investment program, but the quarterly decline shows the company is managing its debt burden.
Dividend yield over the trailing twelve months is 4.6%, above the key rate
Over the trailing twelve months, DEWA paid dividends providing a yield of 4.6% at the current price. This is above the key rate, making the stock attractive for income-oriented investors.
Our estimated dividend for the current year, based on net profit and the payout ratio, suggests a yield of around 4.5–5%. However, payouts could be lower if the company increases capex or faces a profit decline. The key factor is the stability of cash flow and distribution policy.
Shares trade at P/E of 15.5 and EV/EBITDA of 9.6 – below their three-year averages
Current P/E is 15.5 and EV/EBITDA is 9.6. These multiples are below their three-year averages, indicating relative undervaluation compared to the company's own history.
The company's market capitalization is AED 136,000.0 million. With stable cash flow and moderate debt, the current valuation looks justified. If the company continues to show profit growth and maintains dividends, the shares have potential for upward re-rating.
Valuation on the latest reported figures
| Metric | Value |
|---|---|
| Market cap | 136 bn AED |
| P/E (LTM) | 15.5 |
| EV/EBITDA (LTM) | 9.6 |
| P/B | 1.39 |
| Net debt / EBITDA (LTM) | 1.79 |
| Operating cash flow (LTM) | 21.9 bn |
| ROE | 9.8% |
| Dividend yield (12m) | 4.6% |
Bottom line
The strength of the report was the expansion of net margin to 27.2% and a 1.4% rise in profit despite the revenue decline. Operating cash flow over twelve months remains high at AED 21,900.0 million, supporting dividends and debt service. However, the decline in revenue and quarterly cash flow are worrying signals to watch. At the current valuation (P/E 15.5, EV/EBITDA 9.6) and a dividend yield of 4.6%, the shares look rather attractive, but confirmation of revenue stabilization in the next report would strengthen this view.
Open the company's financial profile DEWA →
See also: market overview · valuation map · stock screeners